3438
Downfield Proton MRSI with whole-brain coverage at 3T
İpek Özdemir1, Sandeep Ganji2, Joseph Gillen1,3, Michal Považan4, and Peter B Barker1,3
1Russell H. Morgan Department of Radiology and Radiological Science, Johns Hopkins University, Baltimore, MD, United States, 2Philips Healthcare, Best, Netherlands, 3F.M. Kennedy Krieger Institute, Baltimore, MD, United States, 4Danish Research Centre for MR, Copenhagen, Denmark
1Russell H. Morgan Department of Radiology and Radiological Science, Johns Hopkins University, Baltimore, MD, United States, 2Philips Healthcare, Best, Netherlands, 3F.M. Kennedy Krieger Institute, Baltimore, MD, United States, 4Danish Research Centre for MR, Copenhagen, Denmark
Synopsis
Keywords: Data Acquisition, Spectroscopy, Downfield MRSI
A 3D downfield-MRSI sequence with whole brain coverage, 22-minute scan time, and 0.7 cm3 nominal spatial resolution has been developed at 3T. The sequence was tested in 5 normal volunteers; LCModel analysis showed CRLB average values of 3-4% for protein amide resonances in 3 selected gray and white matter regions. A 3D downfield-MRSI sequence with whole brain coverage, 22-minute scan time, and 0.7 cm3 nominal spatial resolution has been developed at 3T. The sequence was tested in 5 normal volunteers; LCModel analysis showed CRLB average values of 3-4% for protein amide resonances in 3 selected gray and white matter regions.
Introduction
Recently, a single slice, 2D MRSI study of the downfield (DF) resonances in normal human brain was published at a nominal spatial resolution of 1.5 cm3 using a 3T magnet (1) In this sequence, spectral-spatial excitation pulses and frequency selective refocusing are used to excite downfield signals while avoiding saturation of the brain water magnetization. This allows a short TR to be used to maximize sensitivity via the ‘relaxation enhancement’ effect of exchange (or cross-relaxation) with the fully relaxed water signal (2–5)The objective of the current study was to develop a 3D version of this sequence with full brain coverage and higher spatial resolution.
Methods
5 healthy volunteers (2F, age 32.6±13.68, max 57, min 25) were scanned using a 45-minute MR protocol which included anatomical MRI, 3D downfield and 3D water reference MRSI scans (Philips 3T ‘Ingenia Elition’, 32-channel head coil). A 3D, circularly phase-encoded version of the previously developed 2D MRSI sequence (1) with a spatial excitation and frequency selective refocusing was implemented (Fig. 1). All MRSI scans were performed with a matrix of 26x29x8 (elliptical k-space sampling), nominal voxel size 7x7x15 mm (≈0.7 cm3). Scan parameters were TR/TE 287/22 ms, flip angle 78˚, FOV 200x180x120 mm, 120mm slab excitation, 1 excitation, scan time 22m 40s. The pulse delay (δ) was set to give maximum excitation at 7.4 ppm, and frequency-selective refocusing was achieved using a sinc-Gauss 180˚ pulse applied at 7.8 ppm (11ms, 400 Hz BW). An inferior saturation pulse was also applied. Using an oblique axial proscription, coverage was achieved from the base of the cerebellum to the vertex (Fig. 1).Reconstruction of MRSI maps was performed using MATLAB code and LCModel fitting software (6). The basis set for the DF spectra was created in previous work as a collection of individual Gaussian peaks at nine DF resonances (1). Specifically, the DF peaks at 6.83, 7.09, 7.30, 7.48, 7.90, 8.18, 8.24, 8.37, 8.49 ppm were used to fit the DF-MRSI. A stiffer spline was used for the baseline (7). DF-MRSI spectra were frequency corrected using information from the water reference scan prior to the LCModel fitting; residual water was removed using an HLSVD filter. Downfield signal from nine resonances including the amide groups at 8.1-8.3 ppm relative to the water signal (institutional units, ‘i.u’) was measured for all spectra within the brain mask of the 3D MRSI-data.
Mean concentrations (institutional units, ‘i.u.’) and Cramer Rao Lower Bounds (CRLBs) of the DF signals were compared between three selected regions of interest in gray and white matter (anterior cingulate cortex (ACC), dorsolateral prefrontal cortex (DLPFC), and centrum semiovale (CSO) white matter). The metabolite concentration and CRLB values were tested for normality (Kolmogorov-Smirnov) and a non-parametric test (Kruskal-Wallis) was performed to compare the brain regions.
Results
Fig. 2 shows spectra from the 3 brain regions selected for analysis in one subject. NAA and amides show the largest peaks at 7.9 and 8.1-8.3 ppm. Fig. 3 shows reconstructed maps of the combined resonances of amide groups from all 8 slices and associated CRLB maps. For most brain regions, CRLBs were typically lower than 5%.Fig. 4 shows example LCModel fits for the three brain regions, as well as the mean and standard deviation of the concentration and CRLB values of amide groups for all 5 subjects. Both, concentration and CRLB distributions were non-normal (p<0.05). For the concentration estimates, ACC has no significant differences to CSO or DLPFC while CSO and DLPFC are significantly different (p=0.0083). The CRLB values found to be significantly different between ACC and CSO while there was no significant difference between ACC or CSO and DLPFC (p=0.0287).
Discussion
Downfield MRSI with 3D coverage is achievable at 3T in a clinically feasible scan time. Compared to conventional upfield MRSI, downfield MRSI has some technical advantages, including the ability to use short TR (due to the ‘relaxation enhancement’ effect), no need for additional water or lipid suppression, and slightly less sensitivity to field inhomogeneity, since the downfield resonances have broader intrinsic linewidths.Amide proton transfer (APT) chemical exchange saturation transfer (CEST) MRI has been shown to have value in evaluating patients with brain tumors (8); DF-MRSI may give specific metabolic information on slowly exchanging molecules that is complementary to that observed using APT-CEST MRI, which is more sensitive for intermediate exchange rates. Compared to APT-CEST, DF-MRSI offers somewhat greater spectral resolution but lower spatial resolution.
Although the current scan time for DF-MRSI was 22 minutes, further developments such as sequence optimization and use of fast-MRSI techniques (for instance, parallel-imaging (SENSE), or readout gradient methods such as echo-planar spectroscopic imaging) should allow scan times of 5 to 10 minutes to be achieved.
Conclusion
3D downfield MRSI of the human brain at 3T for the mapping of exchangeable amide resonances is feasible in clinically acceptable scans times at a nominal spatial resolution of 0.7 cm3.Acknowledgements
Supported by NIH grants R01EB028259 and P41EB031771.References
- Povazan M, Schar M, Gillen J, Barker PB. Magnetic resonance spectroscopic imaging of downfield proton resonances in the human brain at 3 T. Magn Reson Med. 2022 Apr;87(4):1661–72.
- Gonçalves SI, Ligneul C, Shemesh N. Short echo time relaxation-enhanced MR spectroscopy reveals broad downfield resonances. Magn Reson Med. 2019;82(4):1266–77.
- Shemesh N, Dumez JN, Frydman L. Longitudinal relaxation enhancement in 1H NMR spectroscopy of tissue metabolites via spectrally selective excitation. Chemistry. 2013 Sep 23;19(39):13002–8.
- Shemesh N, Rosenberg JT, Dumez JN, Muniz JA, Grant SC, Frydman L. Metabolic properties in stroked rats revealed by relaxation-enhanced magnetic resonance spectroscopy at ultrahigh fields. Nat Commun. 2014 Dec;5(1):4958.
- Fichtner ND, Giapitzakis IA, Avdievich N, Mekle R, Zaldivar D, Henning A, et al. In vivo characterization of the downfield part of (1) H MR spectra of human brain at 9.4 T: Magnetization exchange with water and relation to conventionally determined metabolite content. Magn Reson Med. 2018 Jun;79(6):2863–73.
- Provencher SW. Automatic quantitation of localized in vivo 1H spectra with LCModel. NMR Biomed. 2001 Jun;14(4):260–4.
- Giapitzakis IA, Shao T, Avdievich N, Mekle R, Kreis R, Henning A. Metabolite-cycled STEAM and semi-LASER localization for MR spectroscopy of the human brain at 9.4T. Magn Reson Med. 2018;79(4):1841–50.
- Jiang S, Eberhart CG, Zhang Y, Heo HY, Wen Z, Blair L, et al. Amide Proton Transfer-Weighted MR Image-Guided Stereotactic Biopsy in Patients with Newly Diagnosed Gliomas. Eur J Cancer Oxf Engl 1990. 2017 Sep;83:9–18.
Figures
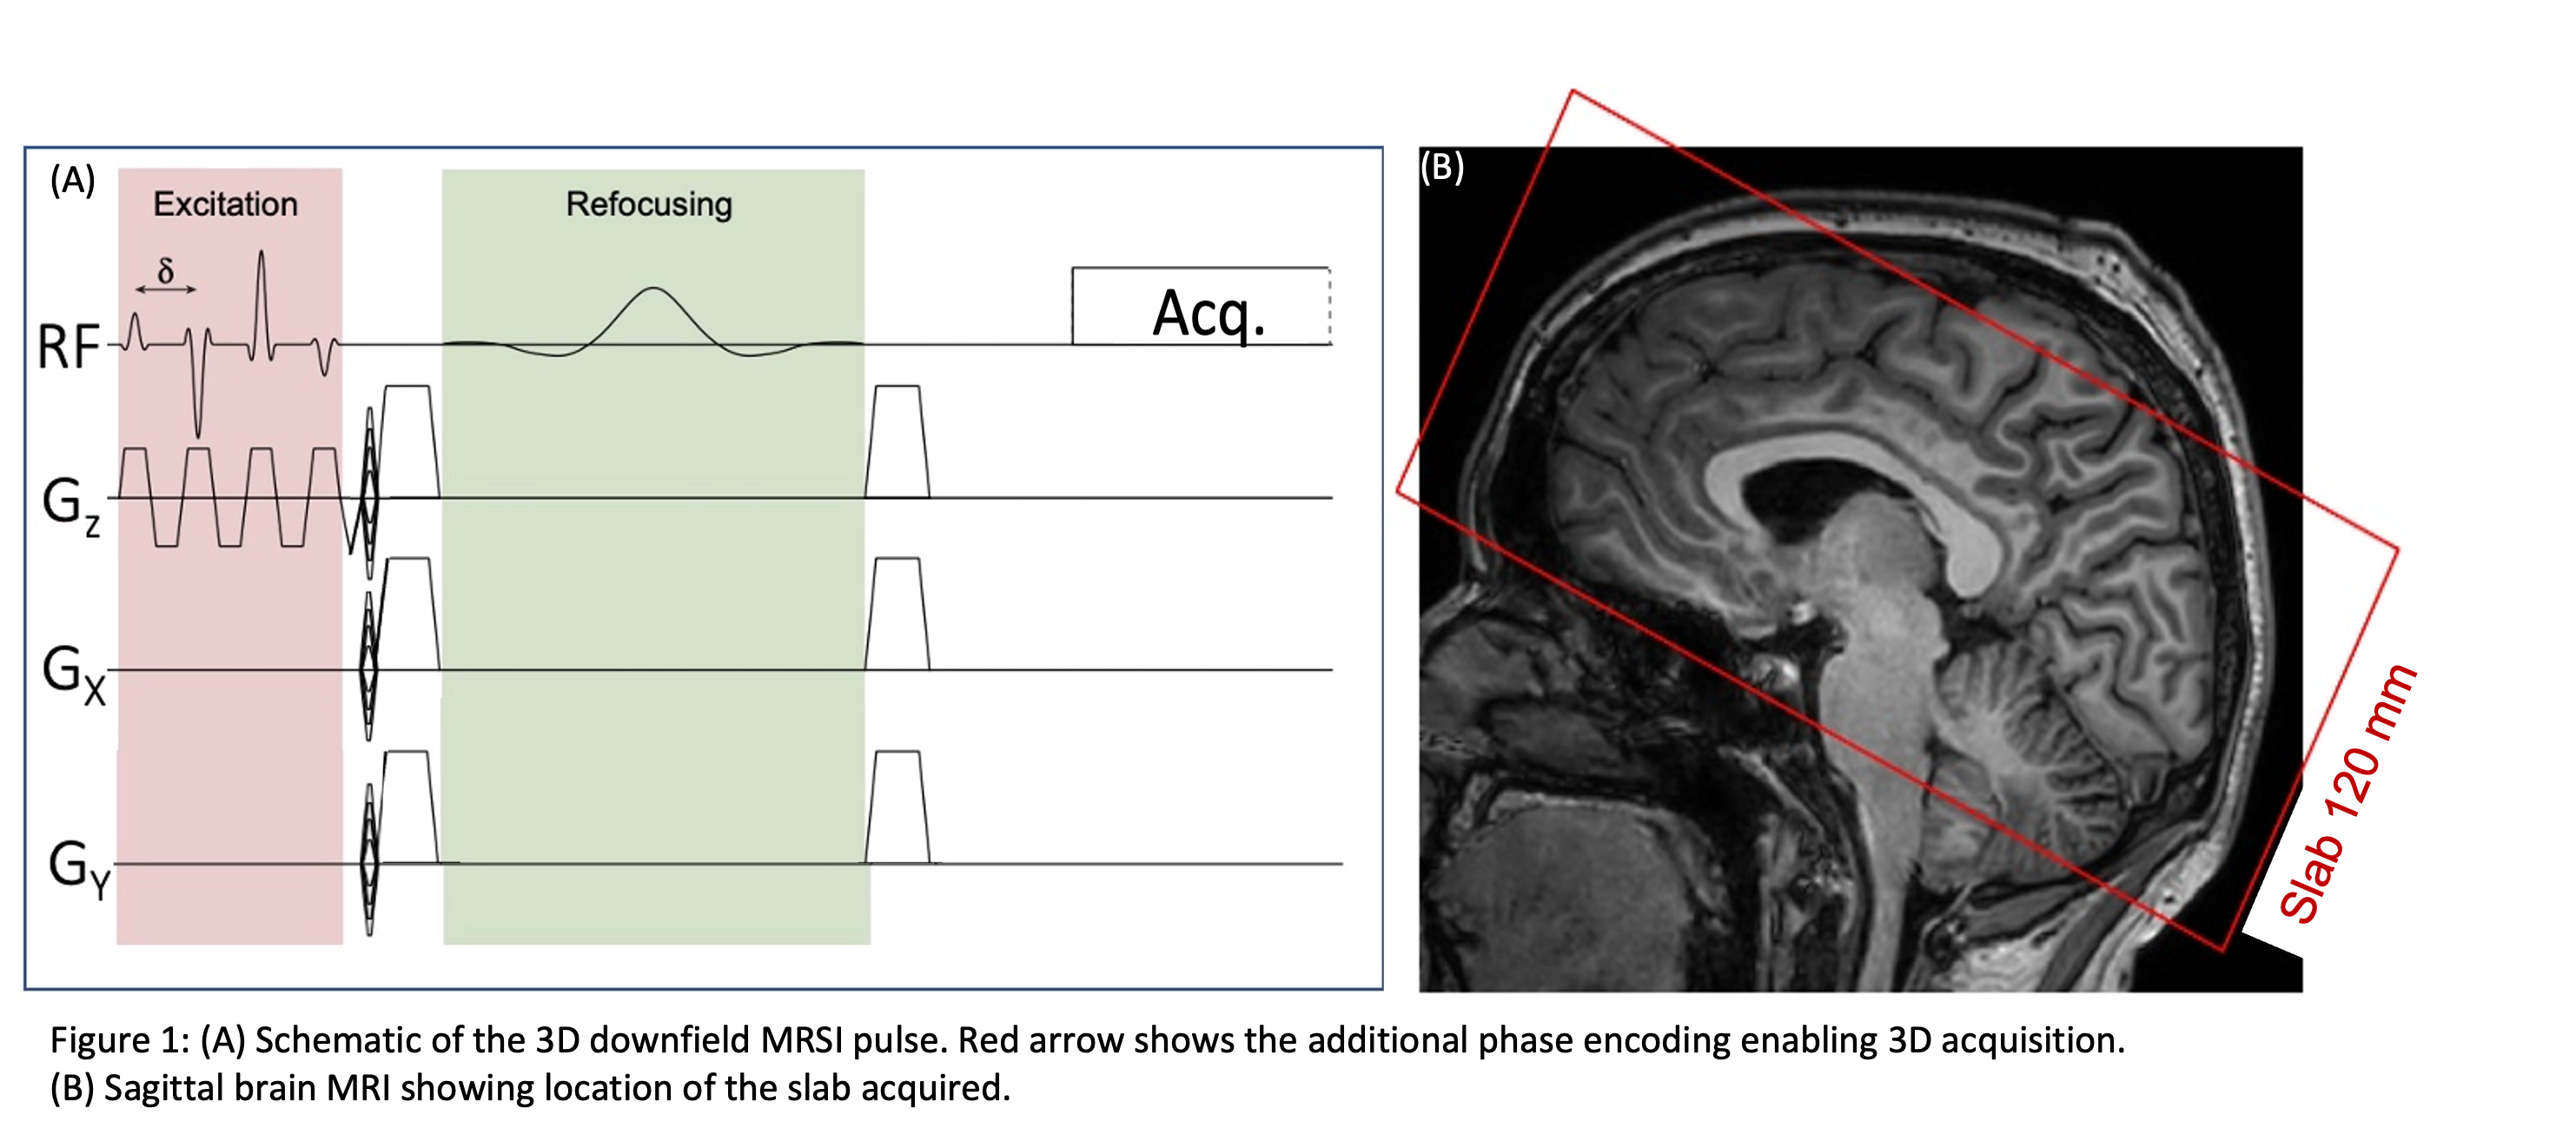
Figure 1: (A) Schematic of the 3D downfield MRSI pulse. (B) Sagittal brain MRI showing location of the slab acquired.
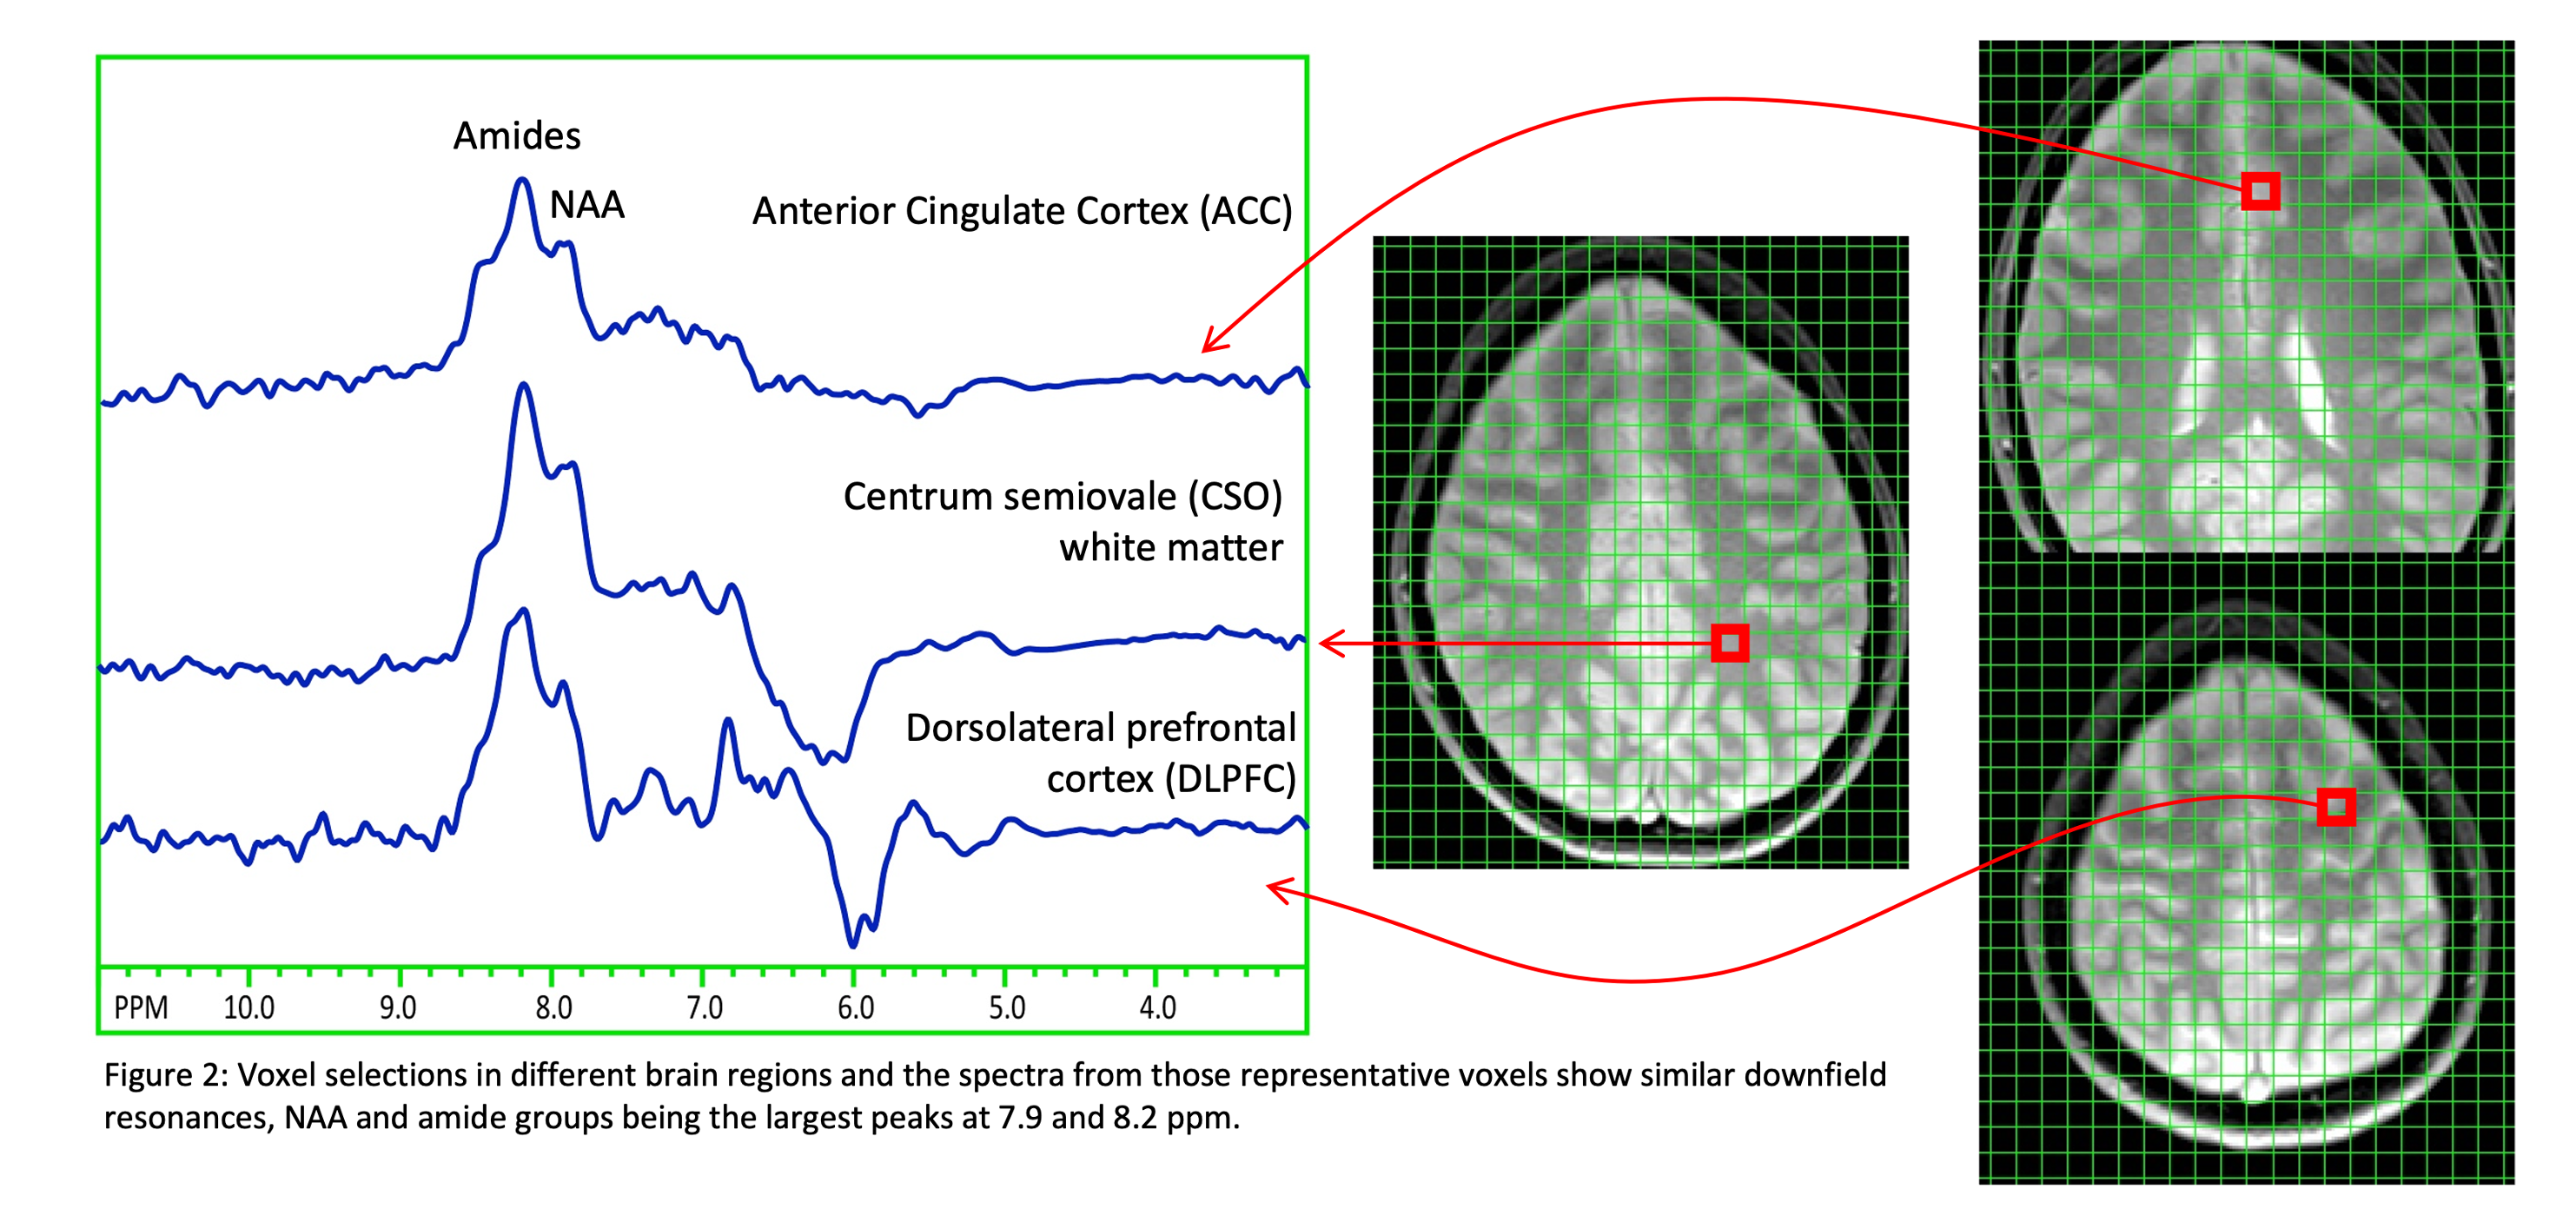
Figure 2: Voxel selections in different brain regions and the spectra from those representative voxels show similar downfield resonances, NAA and amide groups being the largest peaks at 7.9 and 8.2 ppm.
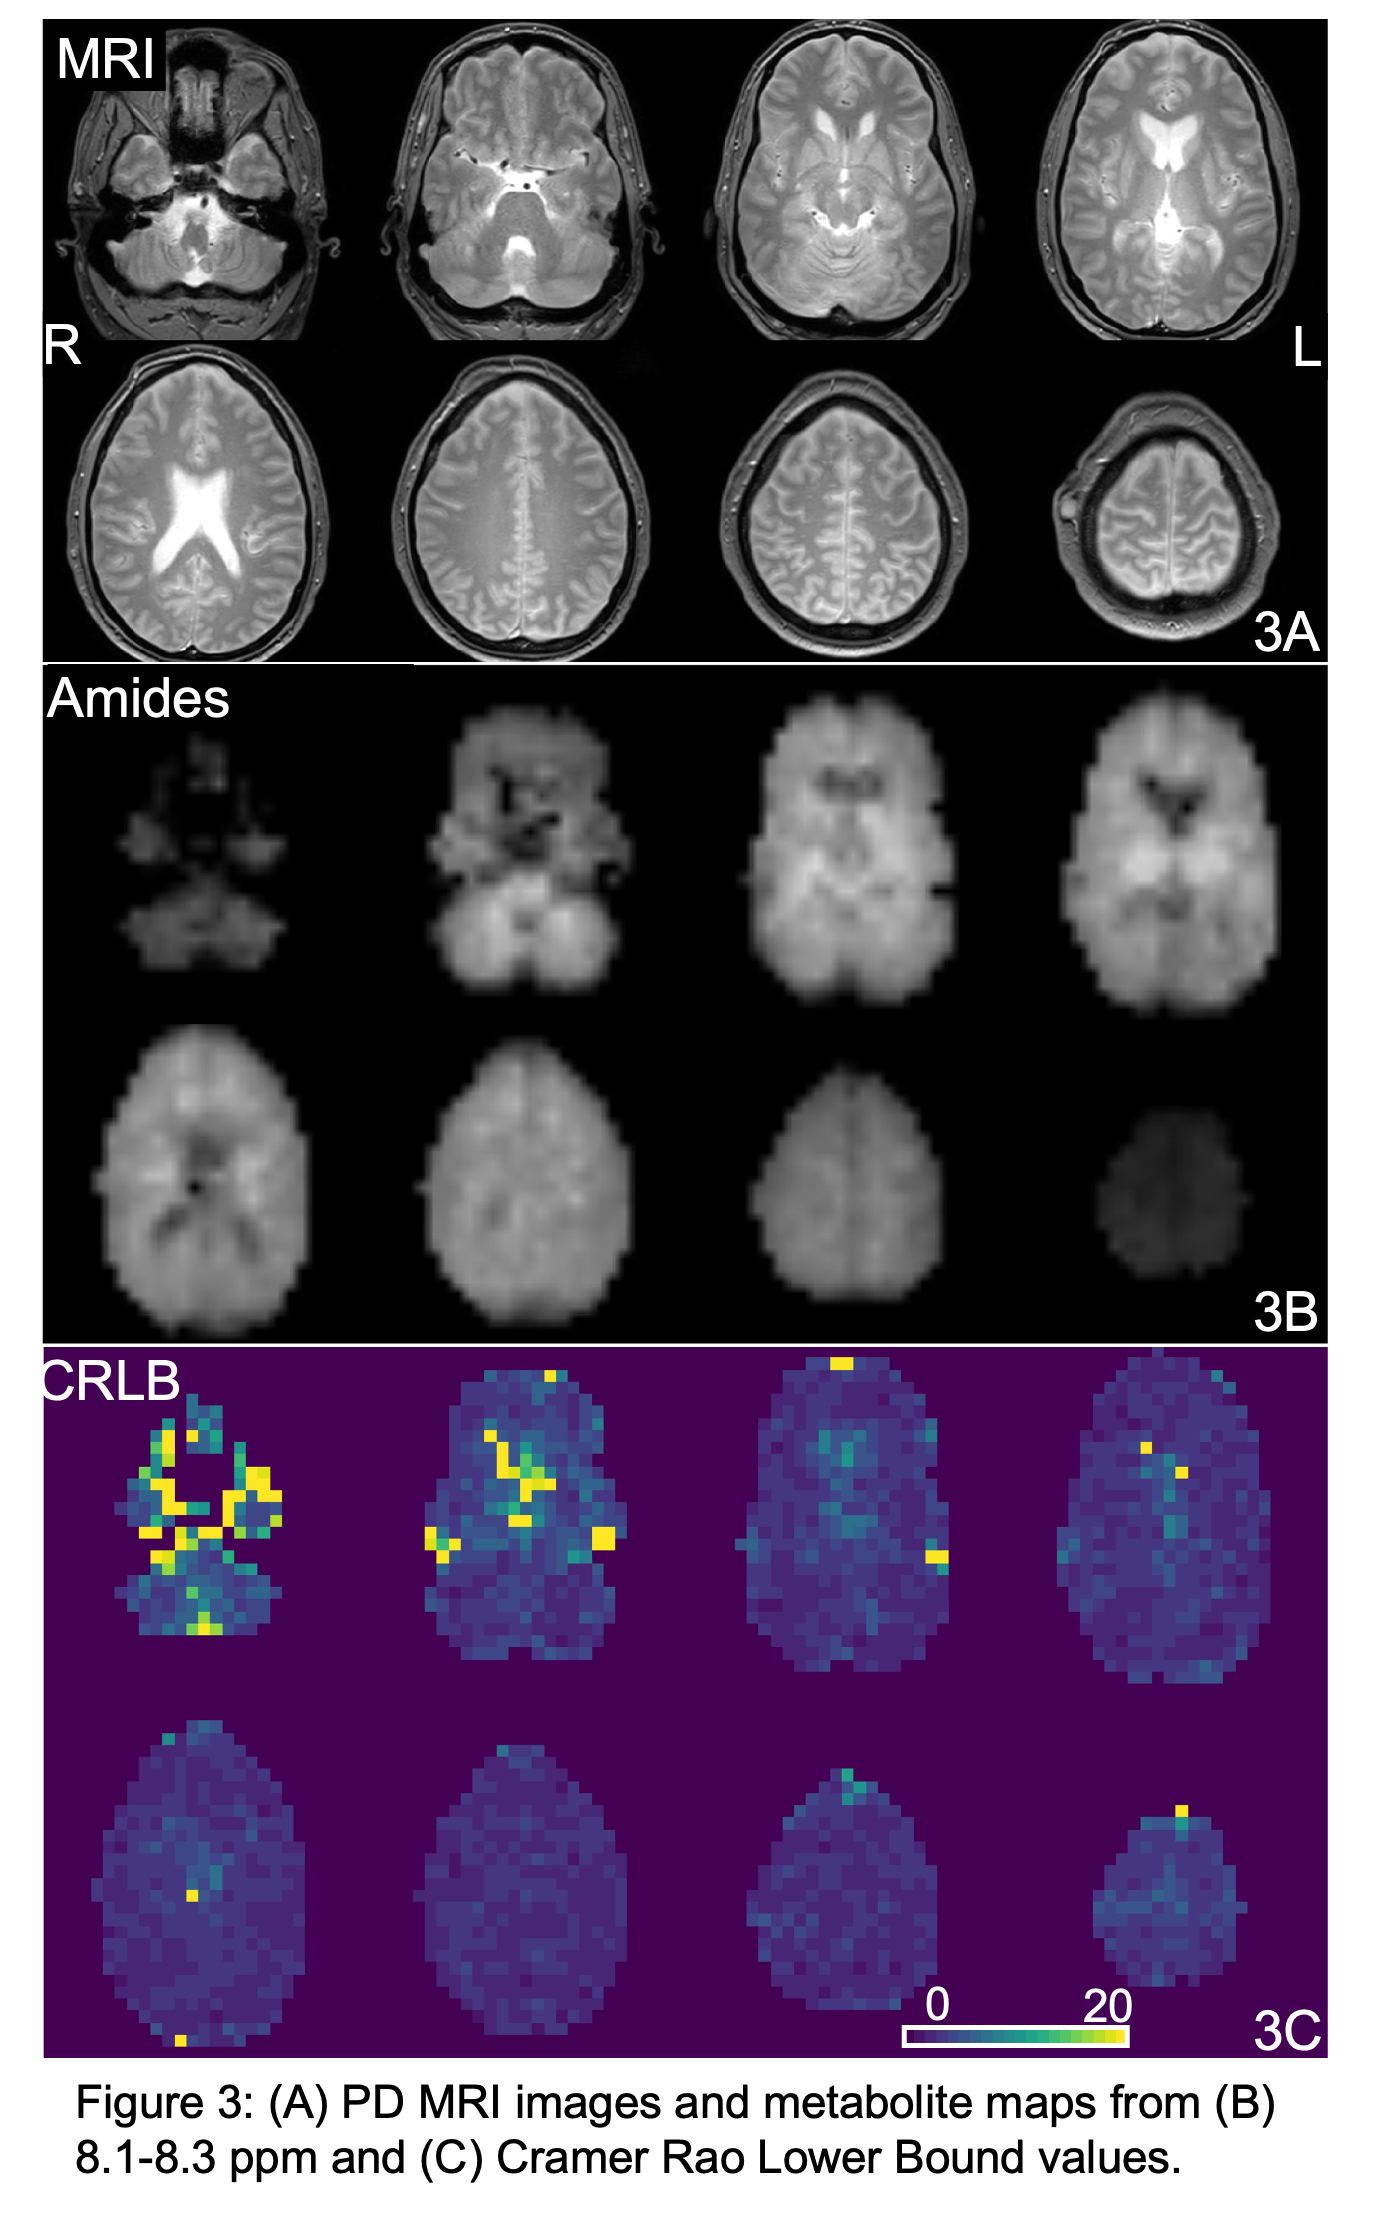
Figure 3: (A) PD MRI images and metabolite maps from (B) 8.1-8.3 ppm and (C) Cramer Rao Lower Bound values.
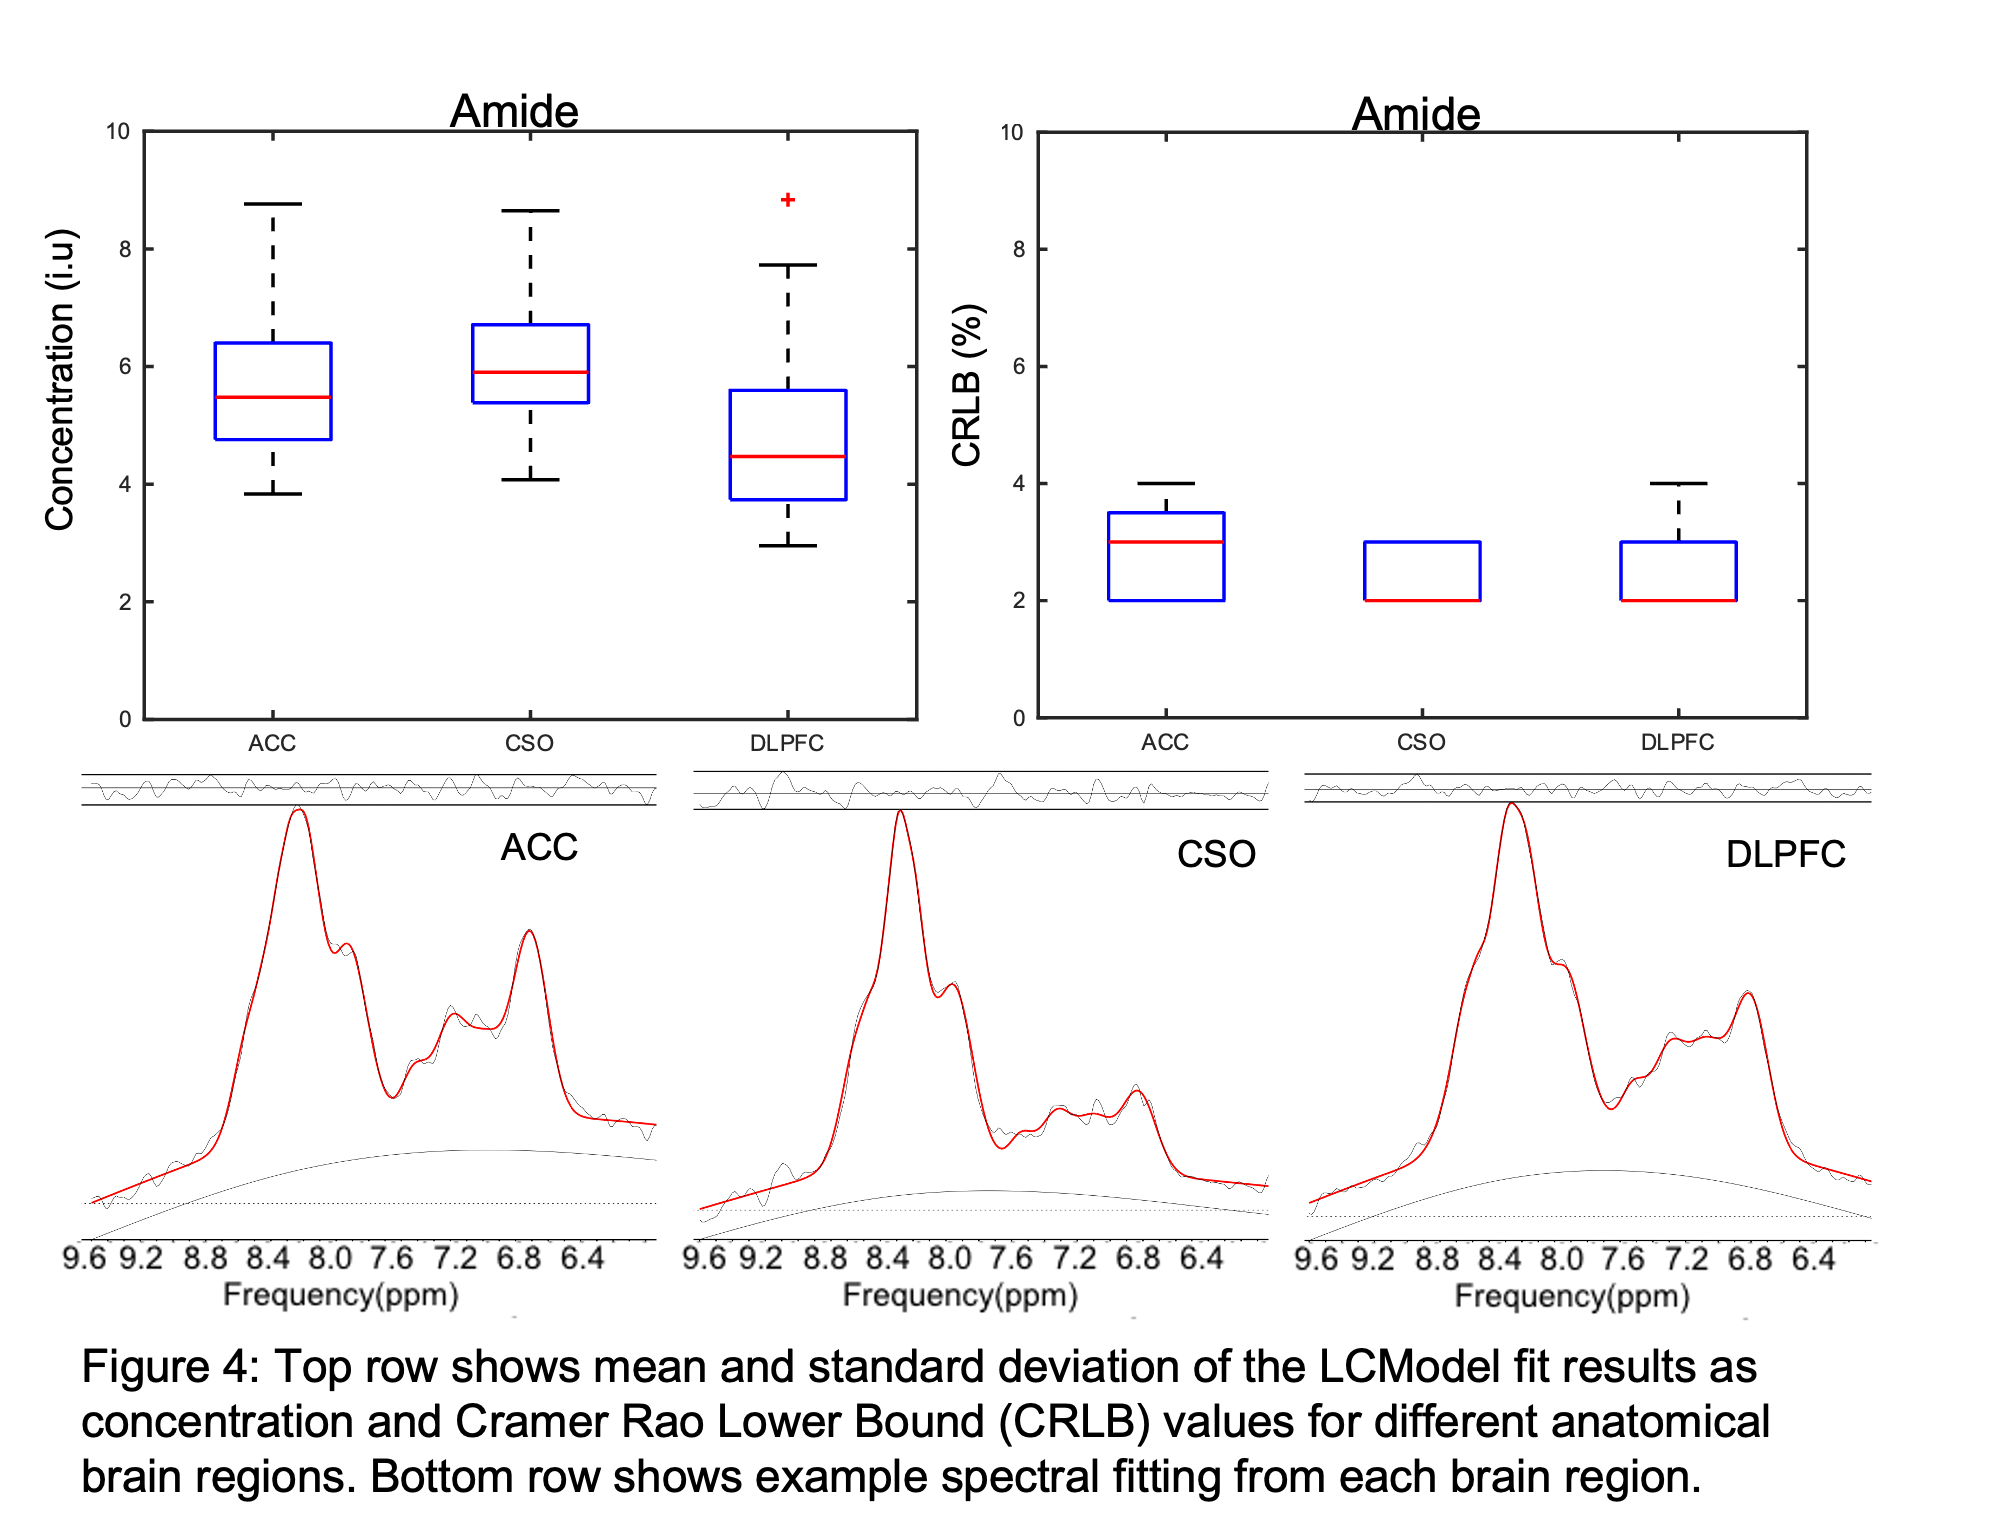
Figure 4: Top row shows mean and standard deviation of the LCModel fit results as concentration and Cramer Rao Lower Bound (CRLB) values for different anatomical brain regions. Bottom row shows example spectral fitting from each brain region.
DOI: https://doi.org/10.58530/2023/3438