3437
The Influence of the MT effect on the Accuracy of T1 Quantification by the Dual Flip Angle Method1Department of Biomedical Engineering, Johns Hopkins University School of Medicine, Baltimore, MD, United States, 2Russell H. Morgan Department of Radiology and Radiological Science, Johns Hopkins University School of Medicine, Baltimore, MD, United States, 3Kirby Center, Kennedy Krieger Institute, Baltimore, MD, United States
Synopsis
Keywords: Signal Modeling, Brain, Relaxometry
The dual flip angle (DFA) method is widely used for brain T1 quantification. In addition to the well-known RF field effect, this study investigated the overlooked magnetization transfer (MT) effect for the accuracy of in-vivo T1 mapping. Based on the two-pool Bloch simulation, the DFA derived T1 estimation revealed FA and TR dependence, which was confirmed by the in-vivo brain T1 mapping using the same set of sequence parameters. Longer TR (30 ms) reduced the variation between FA pairs and were closer to the literature values, but at the cost of longer acquisition time.Introduction
The dual flip angle (DFA) method1 based on steady-state spoiled gradient echo sequences is widely used for brain T1 quantification. DFA derived in-vivo T1 values were shown to be in agreement with the result from the inversion recovery gold standard method in simple liquid phantom, but over 30% higher in white matter2, which was attributed largely to the inhomogeneous RF field effect. The magnetization transfer (MT) effect has previously been accounted for the inversion recovery method3-5. This study investigated the overlooked MT effect in the DFA method for the accuracy of in-vivo T1 mapping.Methods
To investigate the MT effect between the free water protons (WP) and the macromolecular protons (MP) on the DFA T1 mapping method, we first established a two-pool cross-relaxation simulation model characterized by the Bloch-McConnell equation3,6,7:\begin{equation}\frac{dM_{z,m}}{dt} = (M_{0,m} - M_{z,m})R_m - k_m M_{z,m} + k_w M_{z,w}\\
\frac{dM_{z,w}}{dt} = (M_{0,w} - M_{z,w})R_w - k_w M_{z,w} + k_m M_{z,m}\end{equation}
Where $$$M_z$$$ is the longitudinal magnetization and $$$M_0$$$ is the equilibrium magnetization. $$$R$$$ is the relaxation rate $$$(R=1/T_1)$$$, $$$k_m$$$ denotes the magnetization exchange rate from the MP pool to the WP pool as a fraction of the MP pool, and $$$k_w$$$ denote the rate for the reverse exchange as a fraction of the WP pool.
Next, the steady-state SPGR signal $$$S_m,S_w$$$ were generated based on the two-pool model. Then, we applied the approximate DFA parameter method on our water proton signal8, where $$$S_{w,1}, S_{w,2}$$$ denote the water signal from two flip angles (FA) $$$\alpha_1,\alpha_2$$$, respectively, TR is the repetition time.
$$T_{1app} = 2TR \frac{ \frac{S_{w,1}}{\alpha_1} - \frac{S_{w,2}}{\alpha_2} }{ S_{w,2}\cdot\alpha_2 - S_{w,1}\cdot\alpha_1 }$$$$M_{0app} = \frac{S_{w,1}S_{w,2}\left( \frac{\alpha_2}{\alpha_1} - \frac{\alpha_1}{\alpha_2} \right)}{ S_{w,2}\cdot\alpha_2 - S_{w,1}\cdot\alpha_1 }$$
Considering the extremely short transverse relaxation times of MP9 ($$$T_{2,m}$$$ < 100 μs), the T2 effect of MP was not negligible. To estimate the real flip angle for MP, we assumed $$$T_{2,m}$$$ = 70 μs.
In our two-pool simulation, these parameters were assumed3,4: $$$R_w$$$ = 0.4 Hz ($$$T_{1,w}$$$ = 2500 ms), $$$R_m$$$ = 5 Hz ($$$T_{1,m}$$$ = 200 ms), $$$k_m$$$ = 5 Hz. $$$f_m=k_w/(k_w+k_m)$$$ where $$$f_m$$$ is the MP pool fraction, $$$f_m = 0.3$$$ for white matter and $$$f_m = 0.15$$$ for gray matter.
As for the DFA parameters, we tested combinations of three set of FA pairs ([3°, 12°]1, [3°, 20°]2, [6°, 24°]10) and three sets of TR (10, 20, 30 ms), respectively.
We applied the same nine sets of DFA parameters for steady-state spoiled gradient echo sequence sequences on a young female’s brain. The field of view (FOV) and acquisition resolution were set to be $$$220\times 220\times 80\text{ mm}^3$$$ and $$$1.2\times 1.2\times 1.2\text{ mm}^3$$$. The RF phase increment of 150$$$^{\circ}$$$ and default gradient spoiling moment of 10-20 mT$$$\cdot$$$ms/m were used. With compressed sensing factor of 4, the scan duration for each FA was 0.57 min for TR = 10 ms, 1.15 min for TR = 20 ms, and 1.72 min for TR = 30 ms. The B1+ map was also acquired with RF-prepared 3D FLASH acquisition11.
The T1 maps are calculated based on the rational approximation of the Ernst equation12 with and without the B1 field correction, respectively. At a slice above the AC-PC line, white matter and cortical gray matter ROIs were segmented using empirical thresholds.
Result
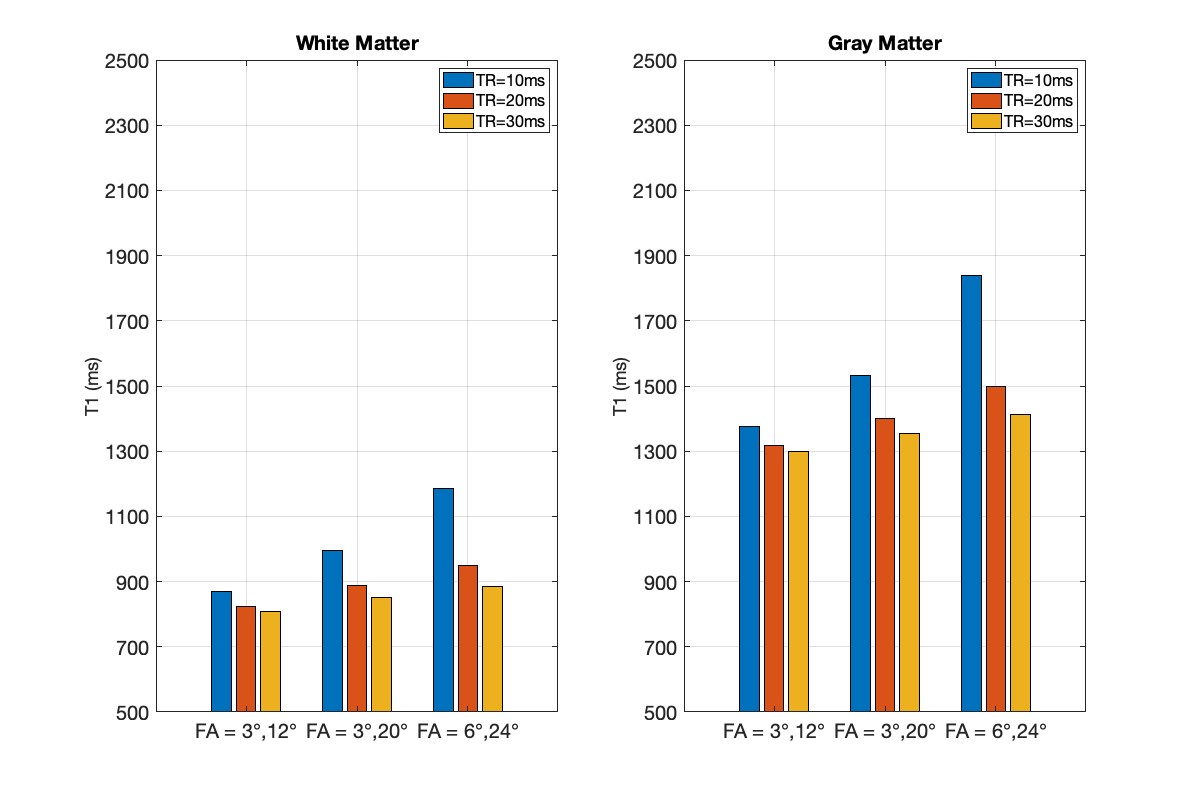
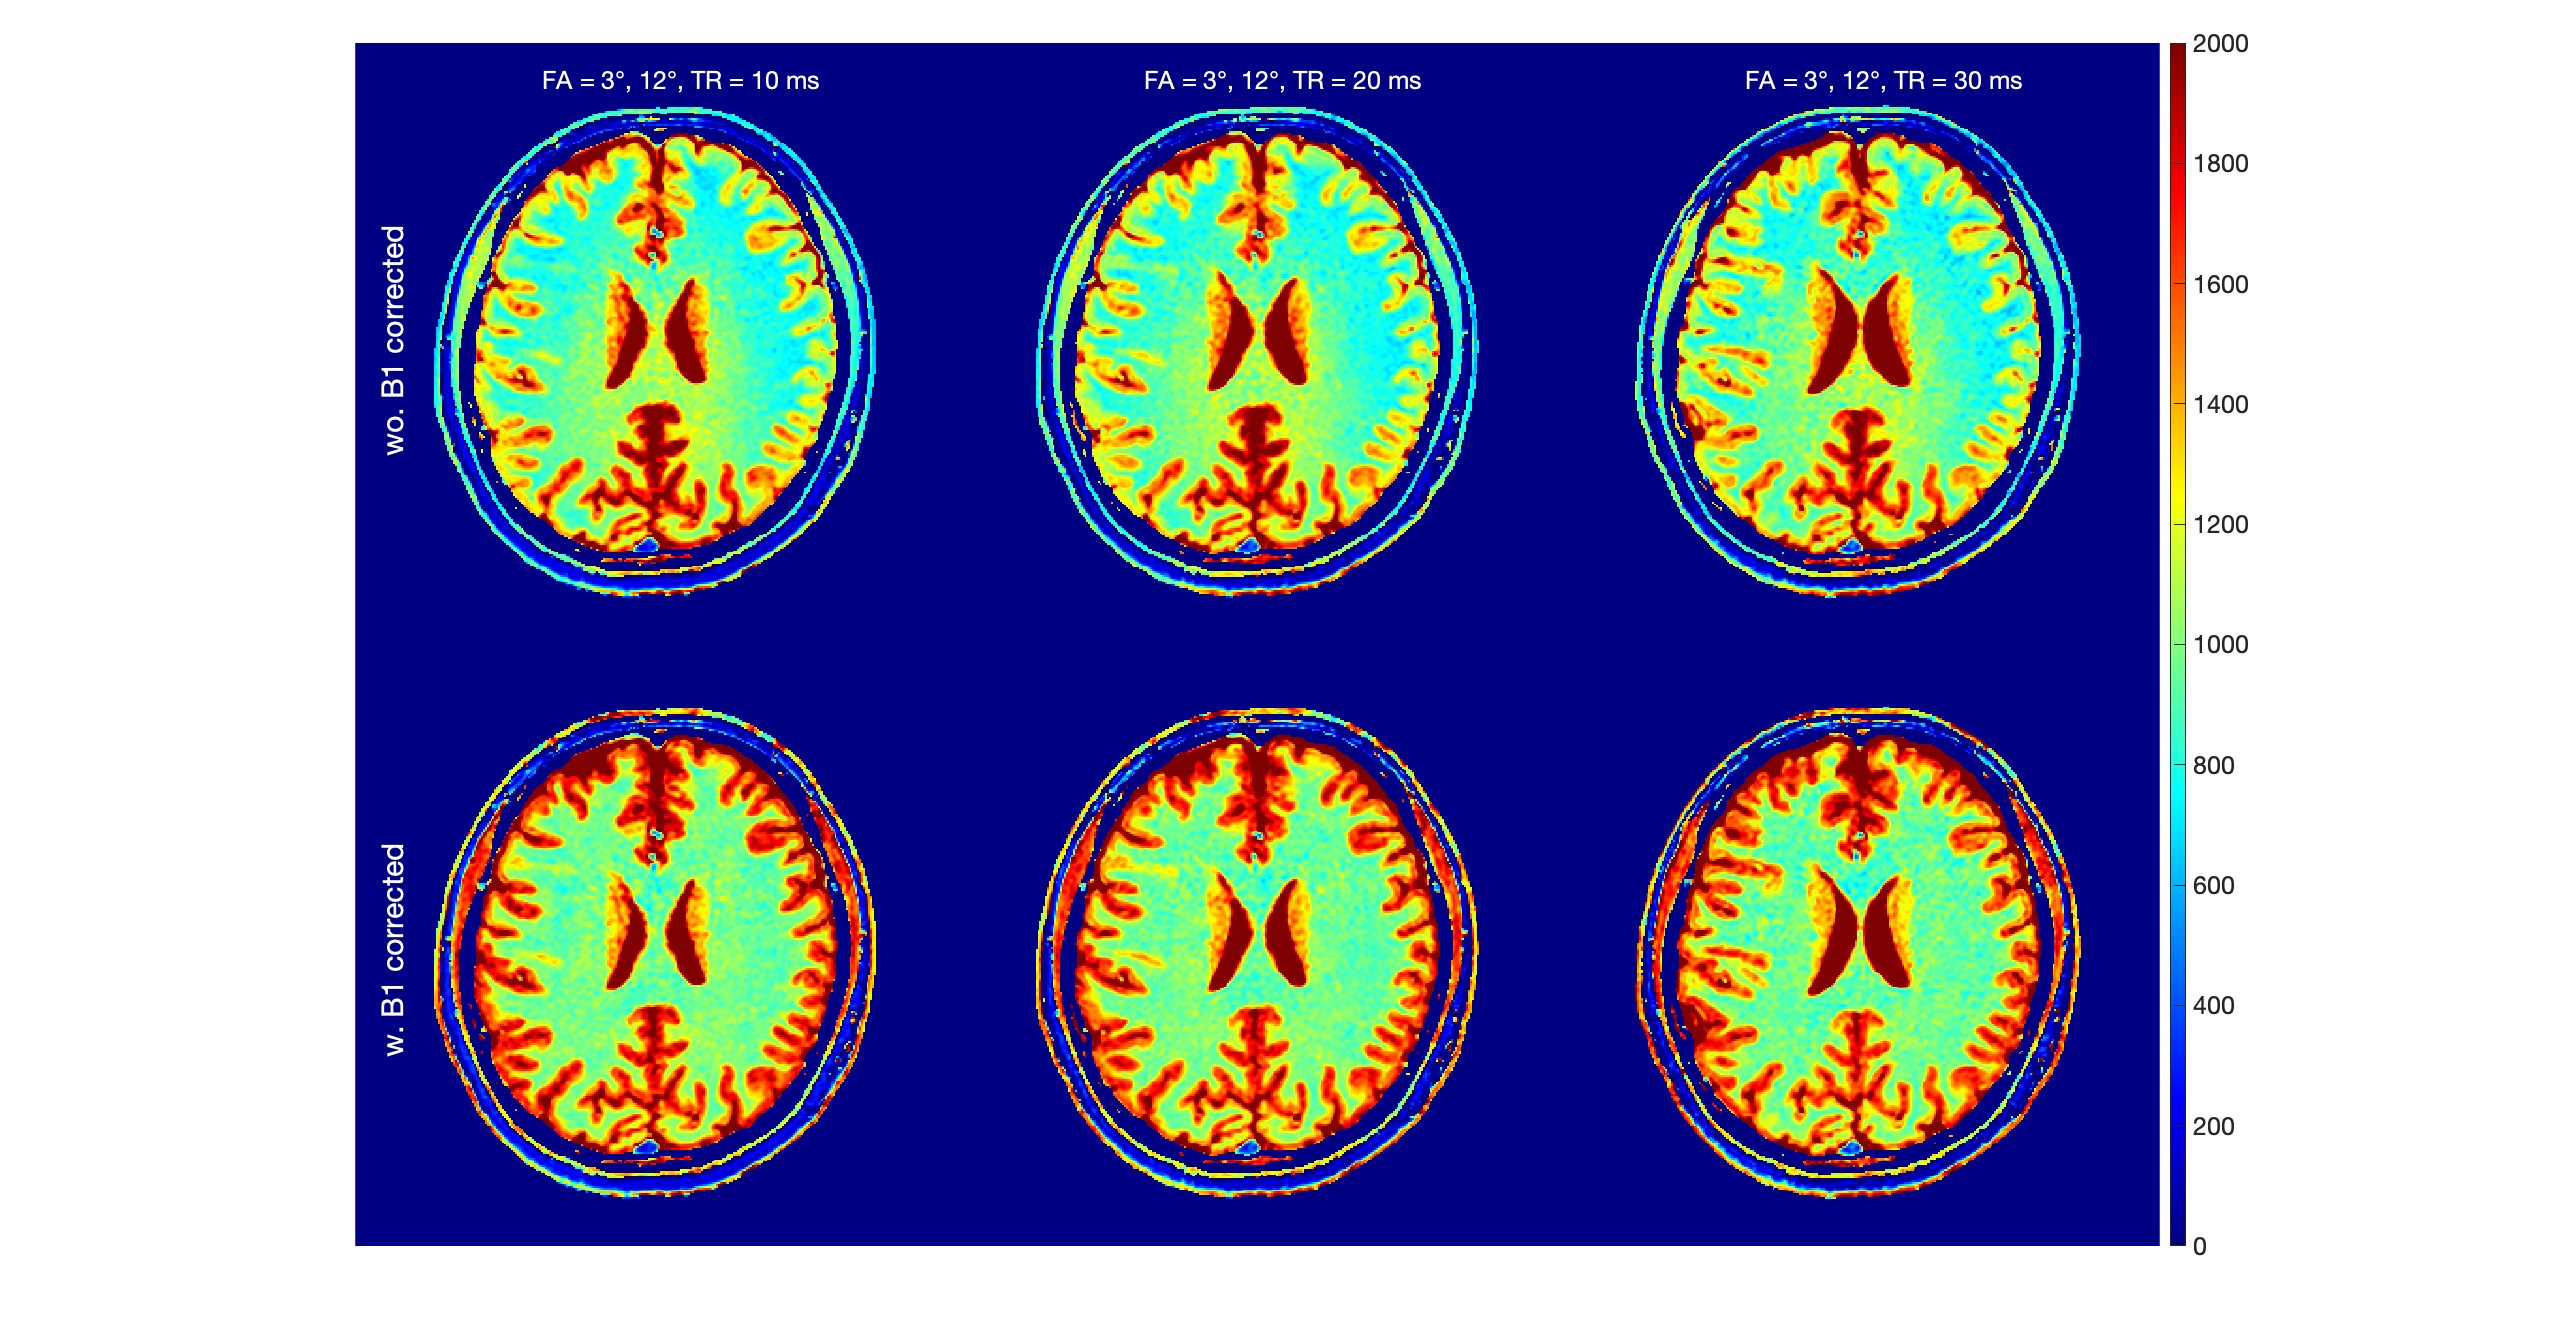
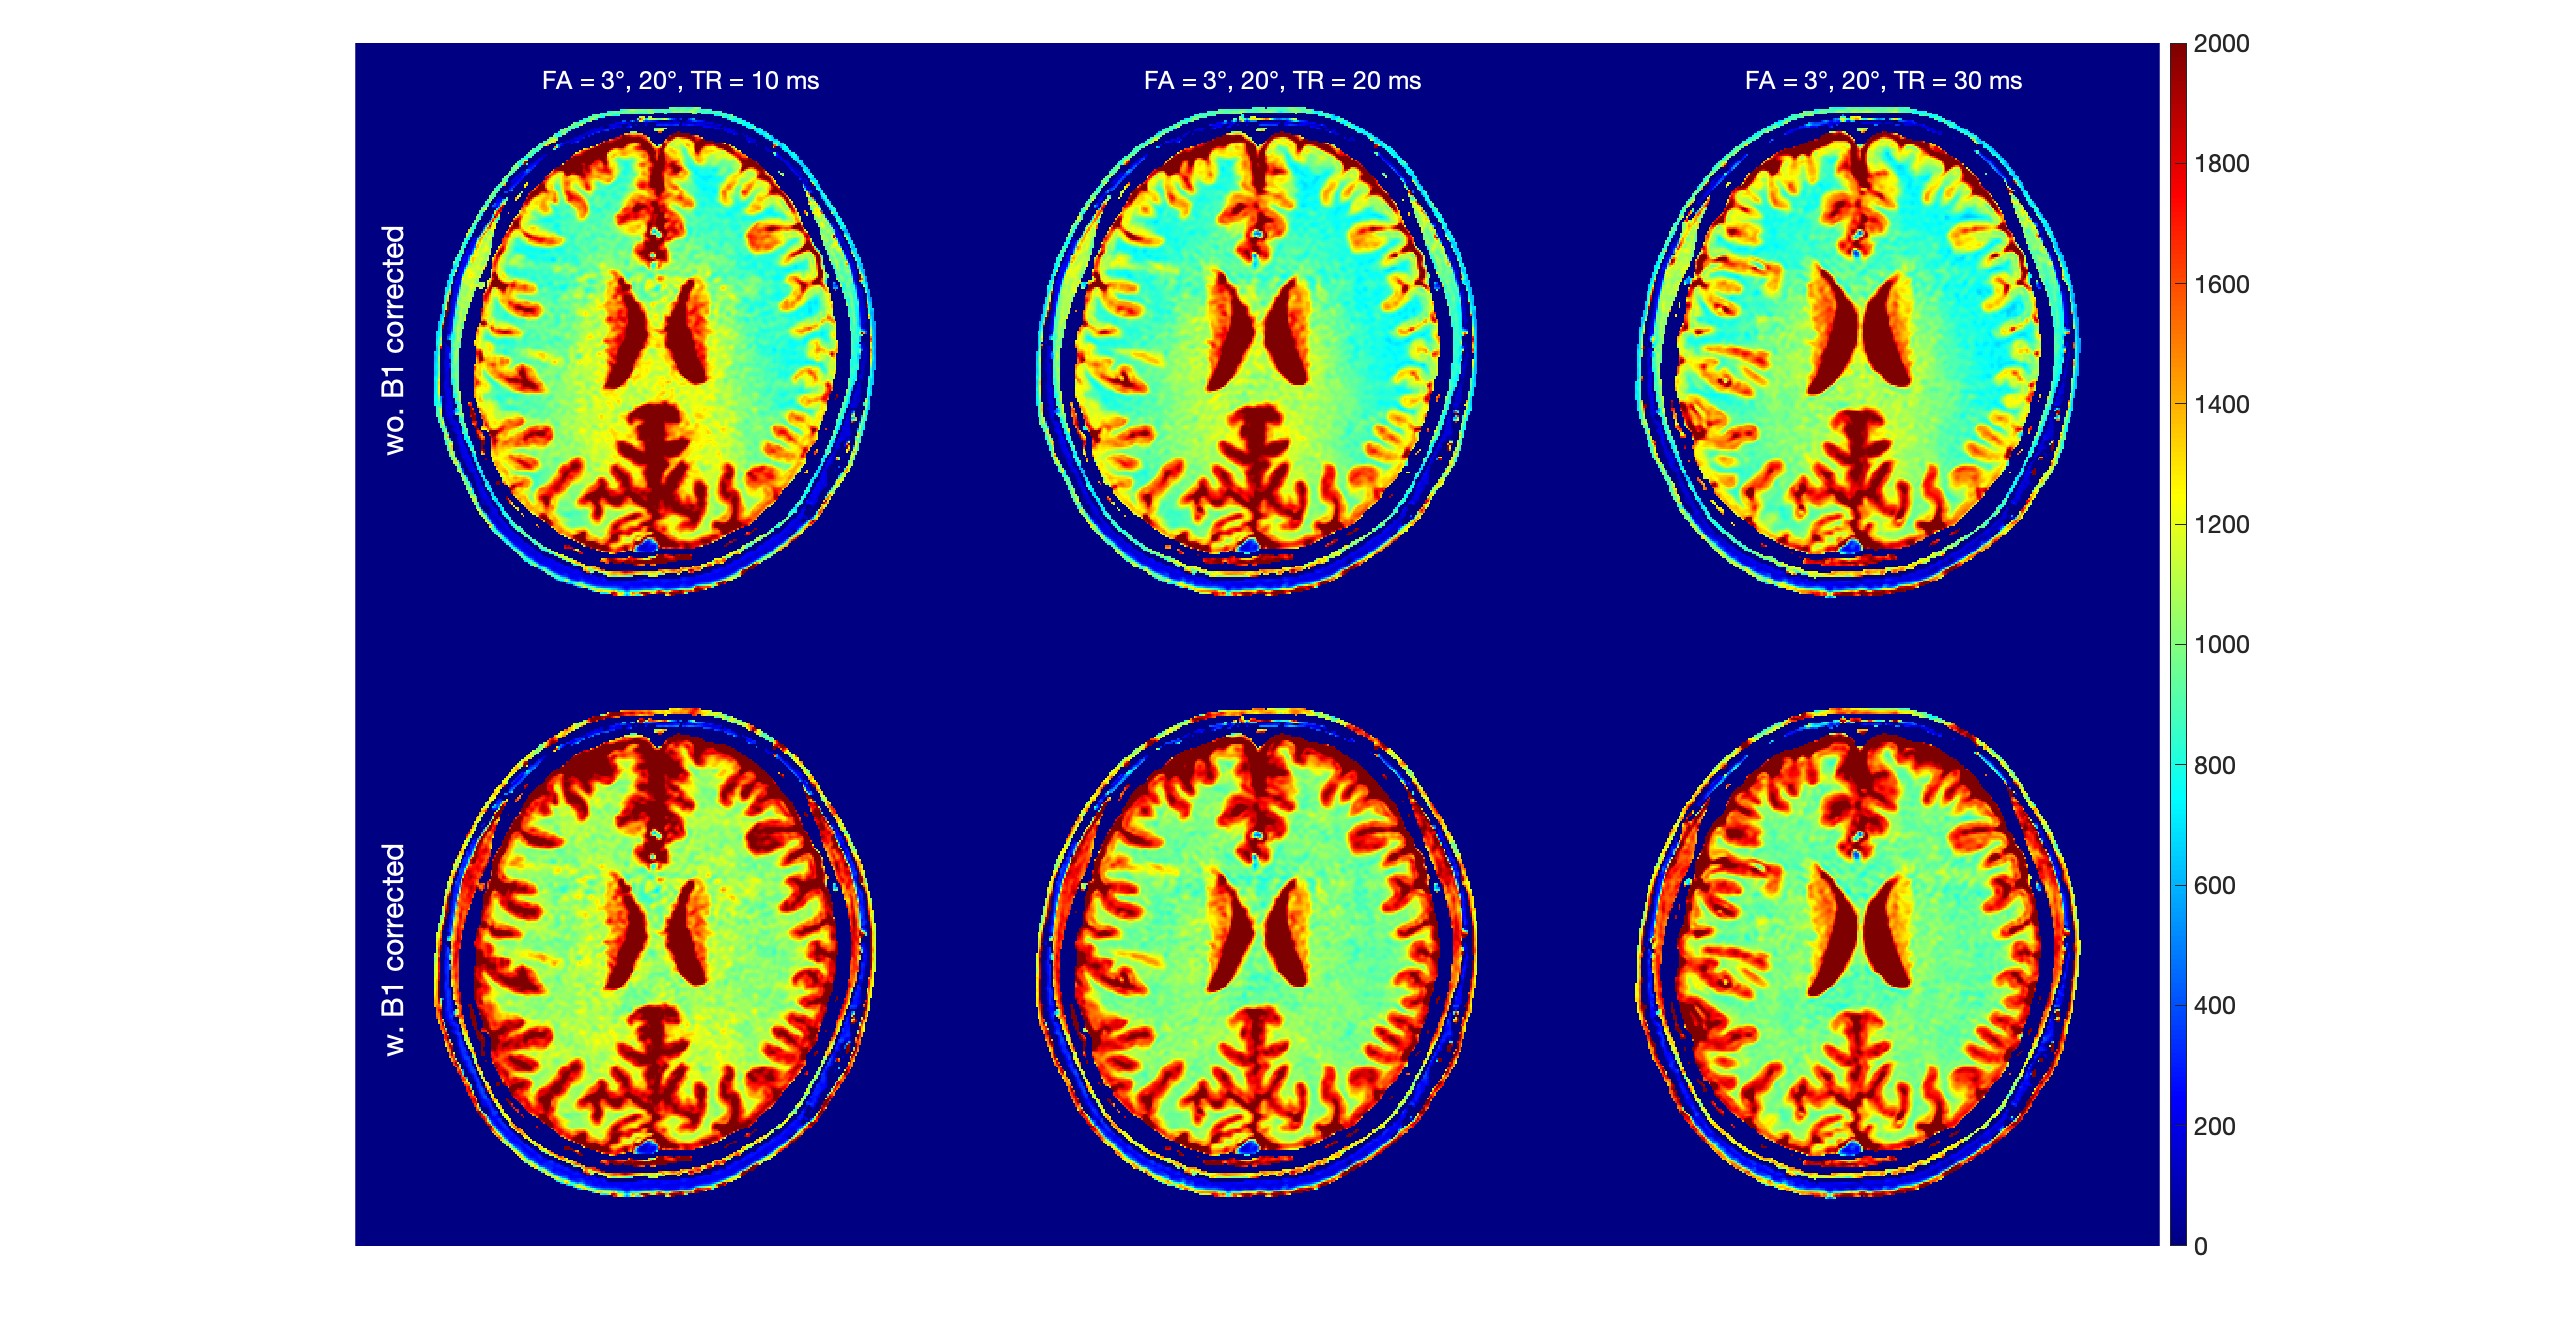
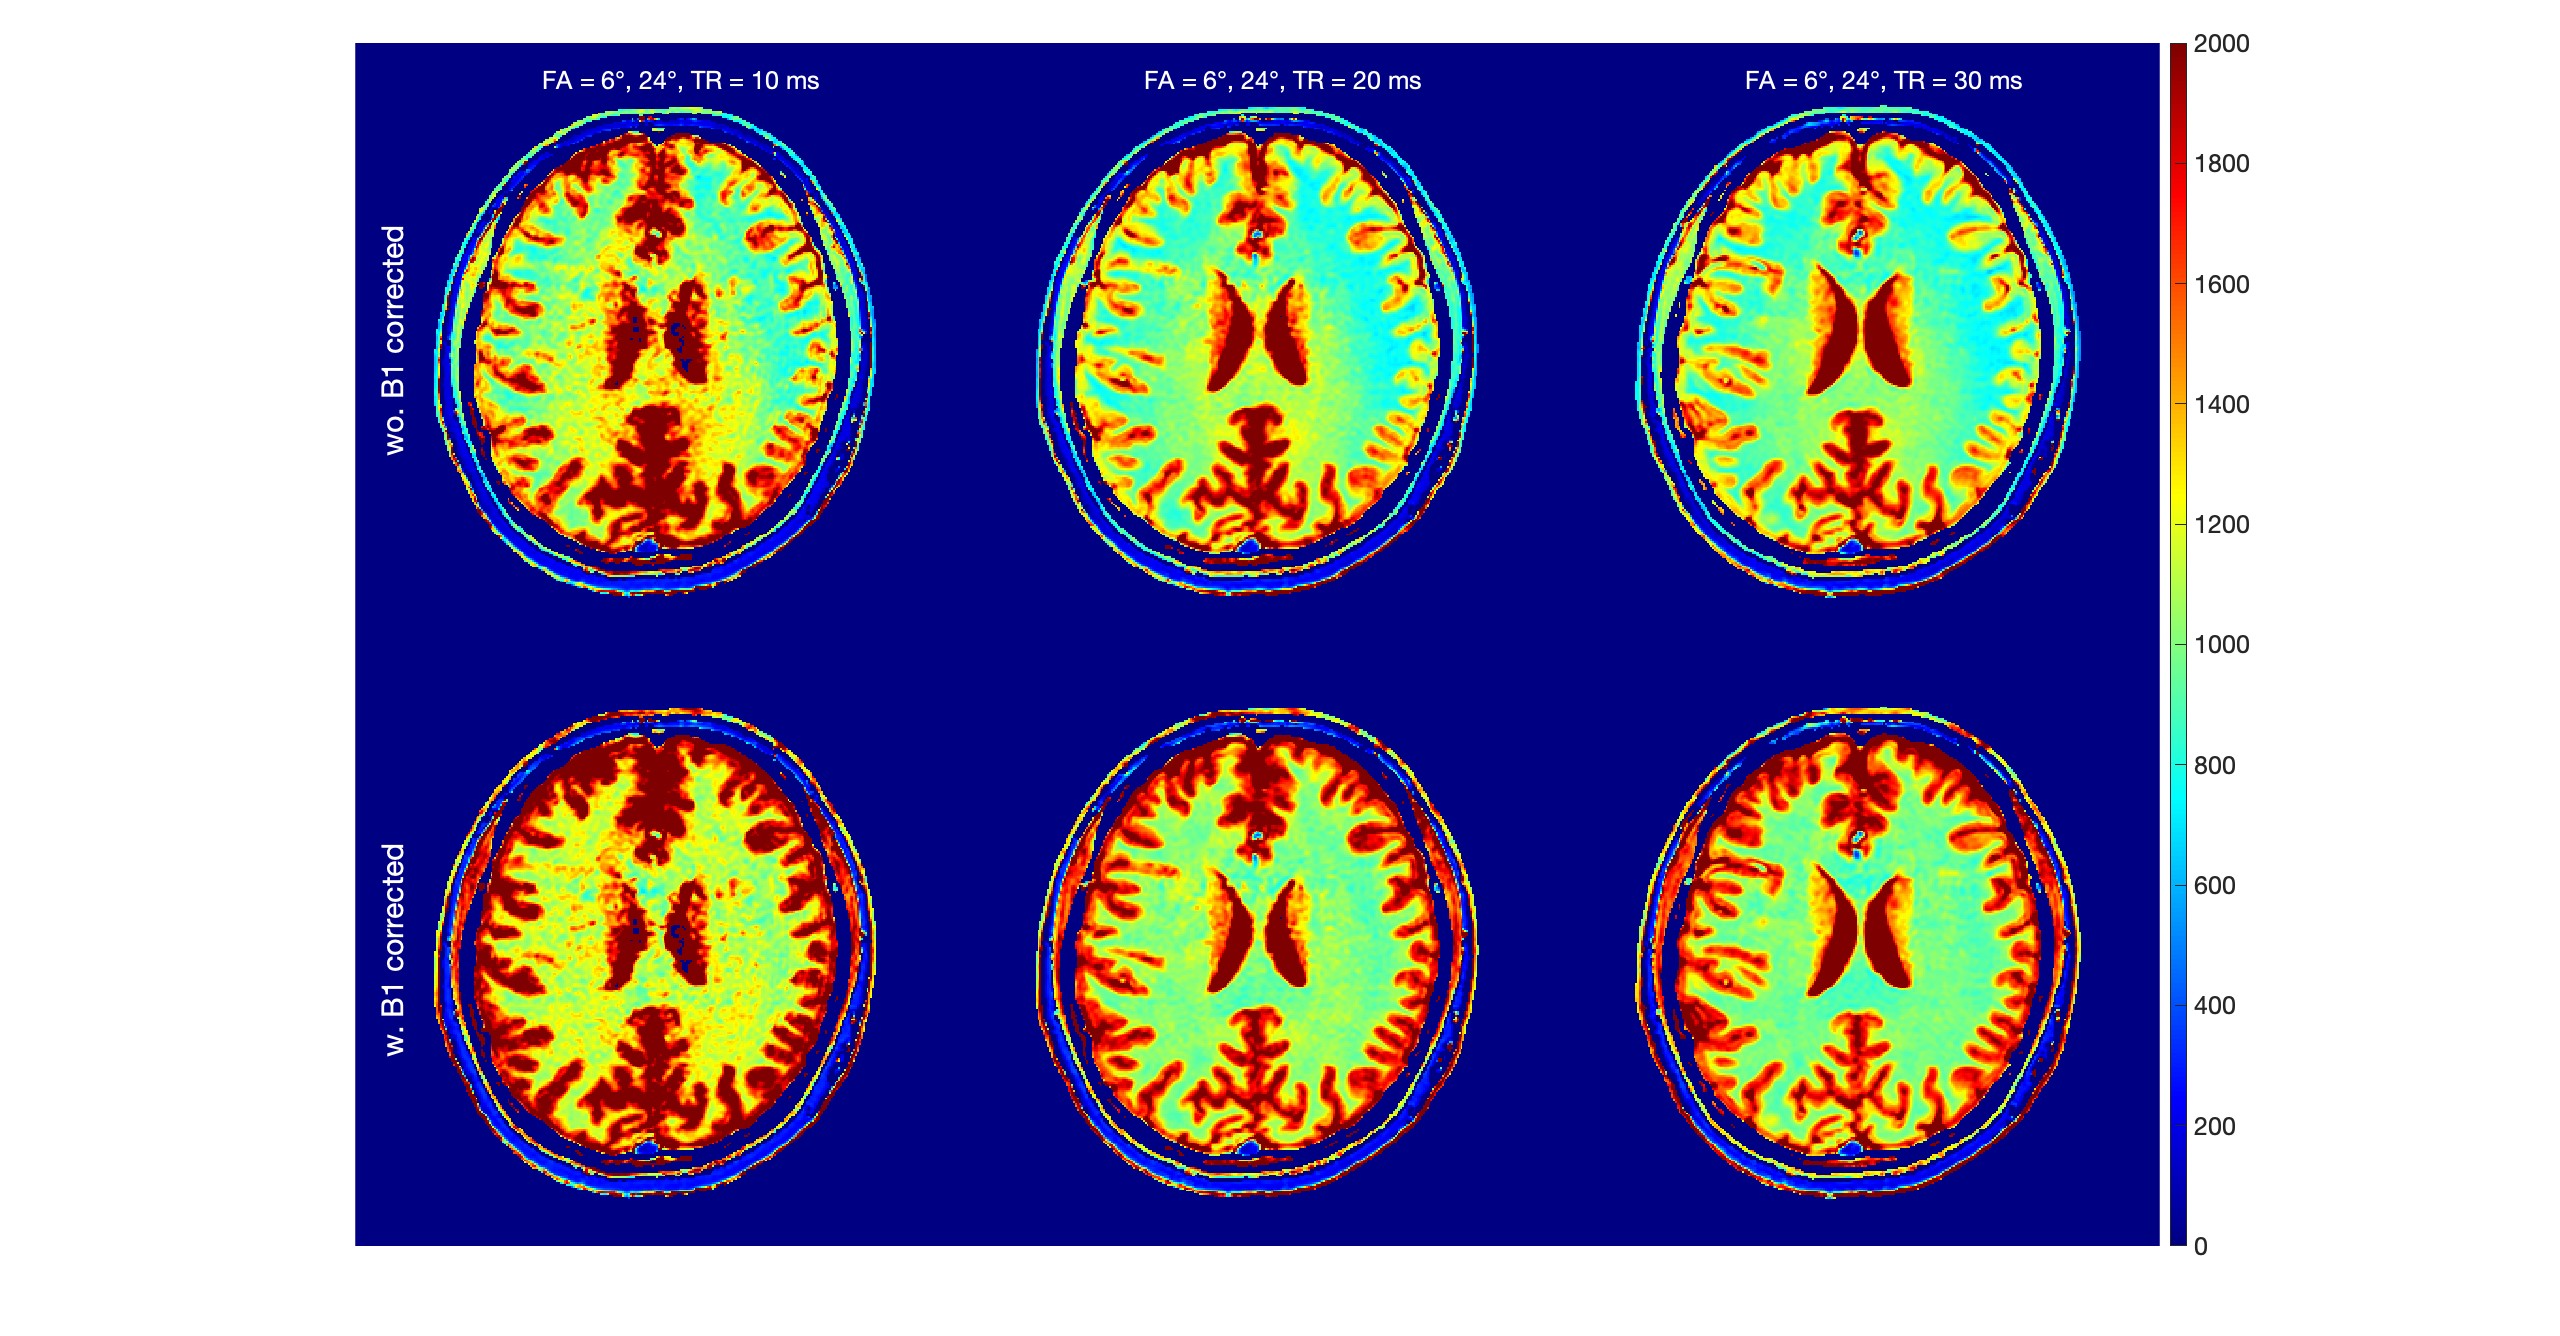
The two-pool T1 simulation results are shown in Fig.1. For all three FA pairs and for both white matter and gray matter, the calculated T1 values were highest at TR = 10 ms and lowest at TR = 30ms; At TR = 10ms, the T1s were highest at FA = 6°/24° and lowest at FA = 3°/12°; The T1s reveal much less difference between different FA pairs at TR = 30 ms than at shorter TRs.The in-vivo T1 Maps from the same three sets of DFA parameters are shown with the three TRs in Figs. 2-4, respectively. We compared the results without (first row) and with (second row) the B1 correction. Compared to results before the B1 correction, T1 values after the B1 correction were 68±8 ms and 278±23 ms higher in white matter and gray matter ROIs.
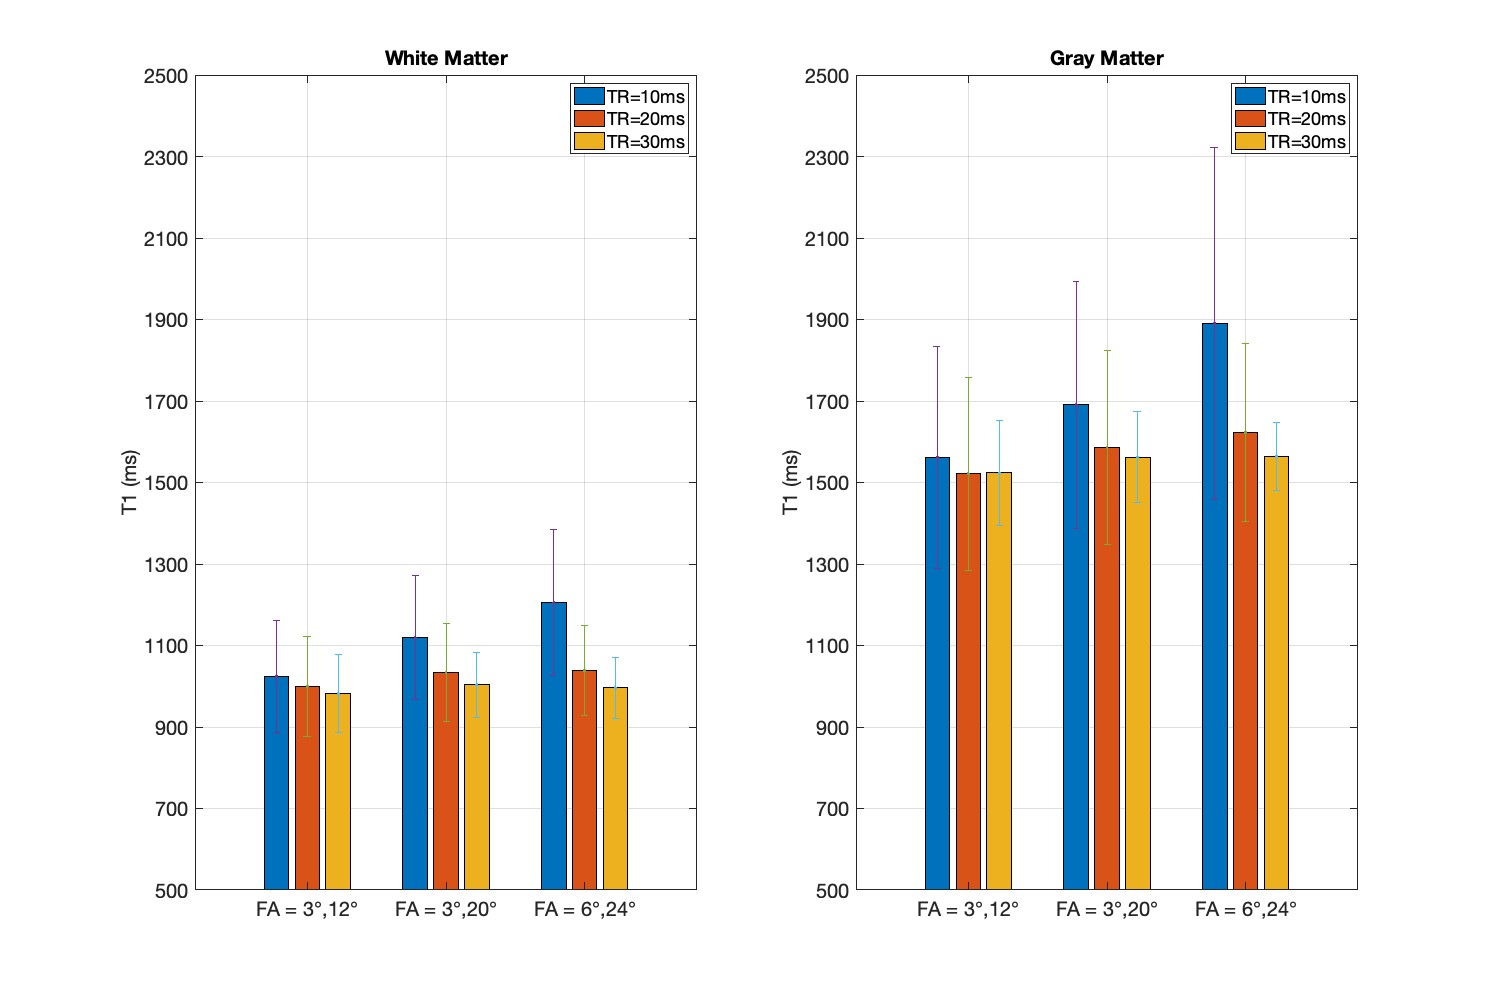
The in-vivo T1 results after B1 correction from white matter and gray matter ROIs are grouped with TRs for each FA pairs in Fig. 5. The result displayed a similar TR-dependent pattern as shown in the two-pool simulation result (Fig.1). At FA = 6°/24°, the averaged B1-corrected T1 values were 1206±179 ms and 1891±432 ms at TR = 10 ms, compared to 996±74 ms and 1564±84 ms at TR = 30 ms, for the white matter and gray matter ROIs, respectively. For the three FA pairs, the B1-corrected T1 values at TR = 30 ms were 982±96 ms, 1004±80 ms, 996±74 ms within the white matter ROI and 1524±129 ms, 1562±112 ms, 1564±84 ms within the gray matter ROI.
Conclusion
The consideration of MT effect resulted in the FA and TR dependence of the DFA derived T1 estimation based on the two-pool Bloch simulation, which was confirmed by the in-vivo brain T1 mapping using the same set of sequence parameters. Longer TR (30ms) reduced the variation between FA pairs and were closer to the literature white matter and gray matter values, at the cost of longer acquisition time.Acknowledgements
No acknowledgement found.References
1. Deoni S C L, Rutt B K, Peters T M. Rapid combined T1 and T2 mapping using gradient recalled acquisition in the steady state[J]. Magnetic Resonance in Medicine: An Official Journal of the International Society for Magnetic Resonance in Medicine, 2003, 49(3): 515-526.
2. Stikov N, Boudreau M, Levesque I R, et al. On the accuracy of T1 mapping: searching for common ground[J]. Magnetic resonance in medicine, 2015, 73(2): 514-522.
3. Wang Y, van Gelderen P, de Zwart J A, et al. B0-field dependence of MRI T1 relaxation in human brain[J]. Neuroimage, 2020, 213: 116700.
4. van Gelderen P, Jiang X, Duyn J H. Rapid measurement of brain macromolecular proton fraction with transient saturation transfer MRI[J]. Magnetic resonance in medicine, 2017, 77(6): 2174-2185.
5. van Gelderen P, Jiang X, Duyn J H. Effects of magnetization transfer on T1 contrast in human brain white matter[J]. NeuroImage, 2016, 128: 85-95.
6. McConnell H M. Reaction rates by nuclear magnetic resonance[J]. The Journal of chemical physics, 1958, 28(3): 430-431.
7. Henkelman R M, Huang X, Xiang Q S, et al. Quantitative interpretation of magnetization transfer[J]. Magnetic resonance in medicine, 1993, 29(6): 759-766.
8. Bluml S, Schad LR, Boris S, Lorenz WJ. Spin-lattice relaxation time measurement by means of a TurboFLASH technique. Magn Reson Med 1993;30:289 –295.
9. Wilhelm M J, Ong H H, Wehrli S L, et al. Direct magnetic resonance detection of myelin and prospects for quantitative imaging of myelin density[J]. Proceedings of the National Academy of Sciences, 2012, 109(24): 9605-9610.
10. Chen Y, Liu S, Wang Y, et al. STrategically Acquired Gradient Echo (STAGE) imaging, part I: Creating enhanced T1 contrast and standardized susceptibility weighted imaging and quantitative susceptibility mapping[J]. Magnetic resonance imaging, 2018, 46: 130-139.
11. Zhu, D., et al. (2022). "Ultrafast B1 mapping with RF-prepared 3D FLASH acquisition: Correcting the bias due to T1 -induced k-space filtering effect." Magn Reson Med 88(2): 757-769.
12. Helms G, Dathe H, Dechent P. Quantitative FLASH MRI at 3T using a rational approximation of the Ernst equation[J]. Magnetic Resonance in Medicine: An Official Journal of the International Society for Magnetic Resonance in Medicine, 2008, 59(3): 667-672.
Figures