3436
Demonstration of multi-pool quantitative CEST MRI with quasi-steady-state reconstruction – Insight into T1-independent CEST quantification
Lauren Gao1 and Phillip Sun1
1Emory University, Atlanta, GA, United States
1Emory University, Atlanta, GA, United States
Synopsis
Keywords: Data Analysis, CEST & MT
CEST quantification is challenging because the measurement depends on the scan protocols. Also, T1 normalization is not straightforward under non-equilibrium conditions. Using multi-pool simulations and phantom experiments, our study evaluated quasi-steady-state(QUASS) algorithm-boosted CEST quantification. The 3-pool CEST simulation showed significant T1 dependencies due to complex interactions among Ts, TR, and T1. Such dependencies were corrected with QUASS reconstruction. In addition, a multi-T1 phantom was used to evaluate the quantification. Whereas the apparent CEST MRI showed significant dependence on Ts, TR, and T1, accurate CEST quantification was demonstrated with the spinlock-model-based fitting of QUASS CEST MRI.Introduction
CEST MRI is a sensitive means for detecting dilute labile protons and their exchange properties (1). It has increasingly been utilized in applications, including imaging acute stroke and tumors (2-5). However, T1 normalization is not straightforward when the assumption of long saturation and repetition times are not met because of the complex signal dependence on scan parameters (6). Because T1 change is common under pathological conditions such as acute ischemia and tumor, in vivo CEST-weighted contrast often reflects mixed contributions from multiple origins (7,8). Therefore, it is necessary to address the limitation of semiquantitative CEST analysis to further develop in vivo CEST MRI. Our study aimed to evaluate the accuracy of CEST quantification under practical experimental conditions. The recently developed quasi-steady-state (QUASS) algorithm reconstructs the equilibrium CEST scans from the CEST measurements based on the protocol parameters and parametric T1 map(9,10). Our study here evaluates the accuracy of QUASS CEST quantification in multi-pool CEST systems.Methods
We simulated a representative 3-pool CEST effect with Bloch-McConnell equations. For the amide (3.5 ppm) and guanidyl (2 ppm) groups, we assumed their labile proton concentration and exchange rates were 1:1500 and 100 s-1, and 1:1000 and 50-1, respectively. We varied the bulk water T1 from 1 to 2 s, with intervals of 0.1 s, with a representative T2 of 50 ms. Z spectra were simulated, under serially and independently varied Ts and Td, from 1.5 to 5 s, with intervals of 0.5 s. We prepared a multi-vial phantom with 300 mM Nicotinamide (NAM) and 20 mM creatine (Cr) at pH of 6.86. We doped the sample with manganese chloride from 0 to 50 µM, with increments of 10 µM. MRI scans were performed on a 7 Tesla scanner using a CEST EPI sequence. We obtained Z-spectrum from -1 to 4 ppm with intervals of 0.05 ppm. We collected the data using five sets of Ts/TR: 1.5 s/ 4 s, 2 s /5 s, 2.5 / 6 s, 3 s/ 7.5 s, and 4 s/10 s (2 averages, B1= 1 µT). In addition, T1-weighted images were acquired with seven inversion delays from 0.1 s to 5 s.Results
Figure 1a shows 3D plots of the amide and guanidyl CEST effects as functions of Ts and T1. To better illustrate the CEST effect, the amide (Figure 1b) and guanidyl (Figure 1c) signals were plotted separately against T1 for the illustrative condition of equal Ts and Td to avoid crowding the figure. It shows nonlinear and significant T1 dependence. In comparison, the QUASS CEST MRI was solved as functions of Ts and Td, which had little variation against such scan parameters (Figure 1d). The amide (Figure 1e) and guanidyl (Figure 1f) signals determined from QUASS reconstruction were plotted separately against T1 for Ts and Td, which overlapped well with little T1 dependence.The apparent- and QUASS-Z spectra showed three labile groups (two amide groups at 3.3 and 2.5 ppm and a guanidyl group at 1.9 ppm). In all vials, the spinlock model-based solution showed satisfactory fittings for apparent Z-spectral (Figure 2) and QUASS Z-spectral (Figure 3). We compared the NAM amide@ 3.3 (red), NAM amide@2.5 ppm (magenta), and Cr guanidyl @1.9 ppm (blue) CEST effects as a function of T1 in Figure 4. The mean and standard deviations for CEST signals at 3.3, 2.5, and 1.9 ppm were 4.42±0.76%, 1.83±0.32%, and 2.93±0.48%, respectively. The corresponding CEST peaks determined from the QUASS analysis were 5.6±0.20%, 2.33±0.10%, and 3.73±0.11%, respectively. In addition, the results determined from the apparent Z-spectra showed large standard deviations and significant correlations with T1. The confidence intervals for the slope were (-1.23, -0.75), (-0.51, -0.26), and (-0.78, -0.56) for 3.5, 2.5, and 1.9 ppm, respectively. In comparison, the solution from the QUASS Z-spectra had no significant correlation with T1 for all three chemical shift offsets.Conclusion
Our study evaluated the accuracy of multi-pool CEST quantification under practical experimental conditions with numerical simulations and phantom experiments. Whereas the apparent CEST effects were subject to a complex T1 dependence, the QUASS reconstruction enabled CEST quantification independent of T1. Combining the spinlock model and QUASS reconstruction is advantageous for accurate multi-pool CEST quantification.Acknowledgements
This study was supported in part by NIH grants R01NS083654, P51OD011132, and Emory Synergy Award.References
1. Ward KM, Aletras AH, Balaban RS. A new class of contrast agents for MRI based on proton chemical exchange dependent saturation transfer (CEST). J Magn Reson 2000;143(1):79-87. 2. Zhou J, Payen JF, Wilson DA, Traystman RJ, van Zijl PC. Using the amide proton signals of intracellular proteins and peptides to detect pH effects in MRI. Nat Med 2003;9(8):1085-1090. 3. Wang E, Wu Y, Cheung JS, Igarashi T, Wu L, Zhang X, Sun PZ. Mapping tissue pH in an experimental model of acute stroke - Determination of graded regional tissue pH changes with non-invasive quantitative amide proton transfer MRI. NeuroImage 2019;191:610-617. 4. Harston GW, Tee YK, Blockley N, Okell TW, Thandeswaran S, Shaya G, Sheerin F, Cellerini M, Payne S, Jezzard P, Chappell M, Kennedy J. Identifying the ischaemic penumbra using pH-weighted magnetic resonance imaging. Brain 2015;138(Pt 1):36-42. 5. Zhou J, Zaiss M, Knutsson L, Sun PZ, Ahn SS, Aime S, Bachert P, Blakeley JO, Cai K, Chappell MA, Chen M, Gochberg DF, Goerke S, Heo H-Y, Jiang S, Jin T, Kim S-G, Laterra J, Paech D, Pagel MD, Park JE, Reddy R, Sakata A, Sartoretti-Schefer S, Sherry AD, Smith SA, Stanisz GJ, Sundgren PC, Togao O, Vandsburger M, Wen Z, Wu Y, Zhang Y, Zhu W, Zu Z, van Zijl PCM. Review and consensus recommendations on clinical APT-weighted imaging approaches at 3T: Application to brain tumors. Magnetic resonance in medicine 2022;88(2):546-574. 6. Zu Z. Towards the complex dependence of MTRasym on T1w in amide proton transfer (APT) imaging. NMR Biomed 2018;31(7):e3934. 7. Xu J, Zaiss M, Zu Z, Li H, Xie J, Gochberg DF, Bachert P, Gore JC. On the origins of chemical exchange saturation transfer (CEST) contrast in tumors at 9.4 T. NMR in biomedicine 2014;27(4):406-416. 8. Zaiss M, Xu J, Goerke S, Khan IS, Singer RJ, Gore JC, Gochberg DF, Bachert P. Inverse Z-spectrum analysis for spillover-, MT-, and T1 -corrected steady-state pulsed CEST-MRI--application to pH-weighted MRI of acute stroke. NMR Biomed 2014;27(3):240-252. 9. Sun PZ. Quasi-steady state chemical exchange saturation transfer (QUASS CEST) analysis-correction of the finite relaxation delay and saturation time for robust CEST measurement. Magn Reson Med 2021;85(6):3281-3289. 10. Wu Y, Liu Z, Yang Q, Zou L, Zhang F, Qian L, Liu X, Zheng H, Luo D, Sun PZ. Fast and equilibrium CEST imaging of brain tumor patients at 3T. NeuroImage: Clinical 2022;33:102890.Figures
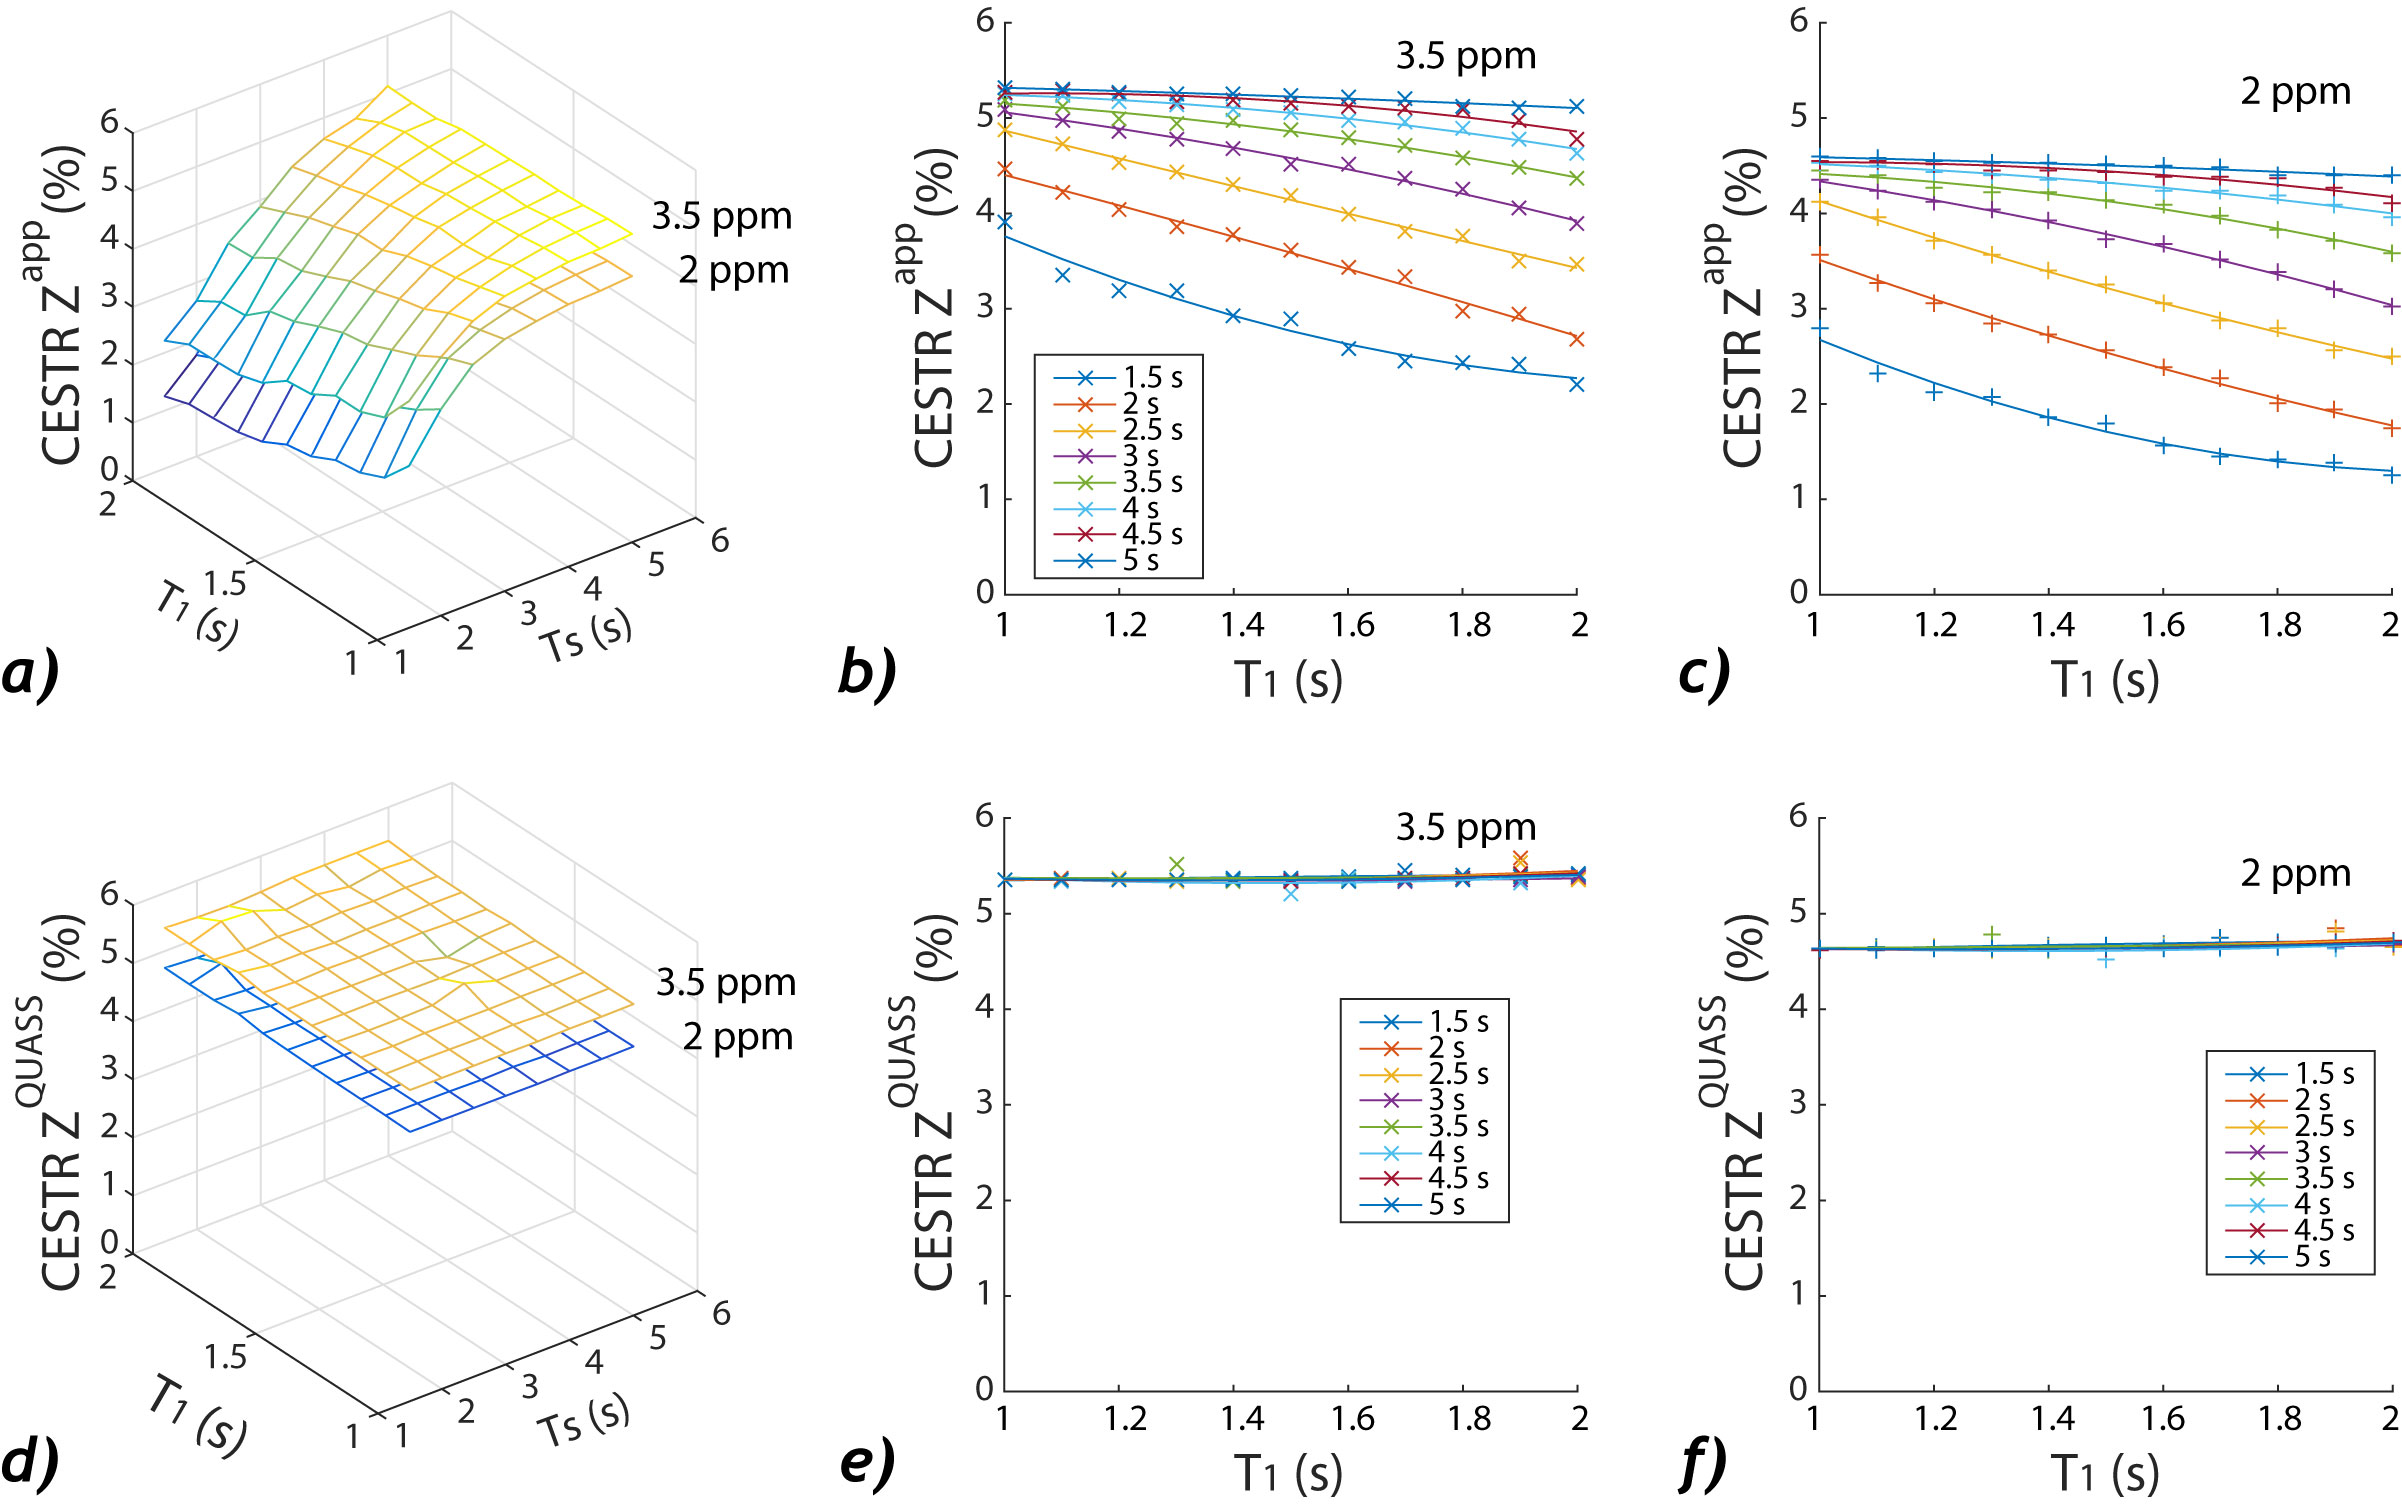
Evaluation of spinlock-model solved CEST effects
as functions of T1 and Ts/Td. a) The amide and guanidyl CEST effects
solved from apparent CEST MRI as functions of T1 and Ts. b) The
amide CEST peak as a function of T1 for each Ts/Td. c) The guanidyl CEST
peak as a function of T1 for each Ts/Td. d) The amide and guanidyl CEST
effects solved from QUASS CEST MRI as functions of T1 and Ts. b) The
amide CEST peak from QUASS reconstruction as a function of T1 for
each Ts/Td. c) The guanidyl CEST peak from QUASS reconstruction as a function
of T1 for each Ts/Td.
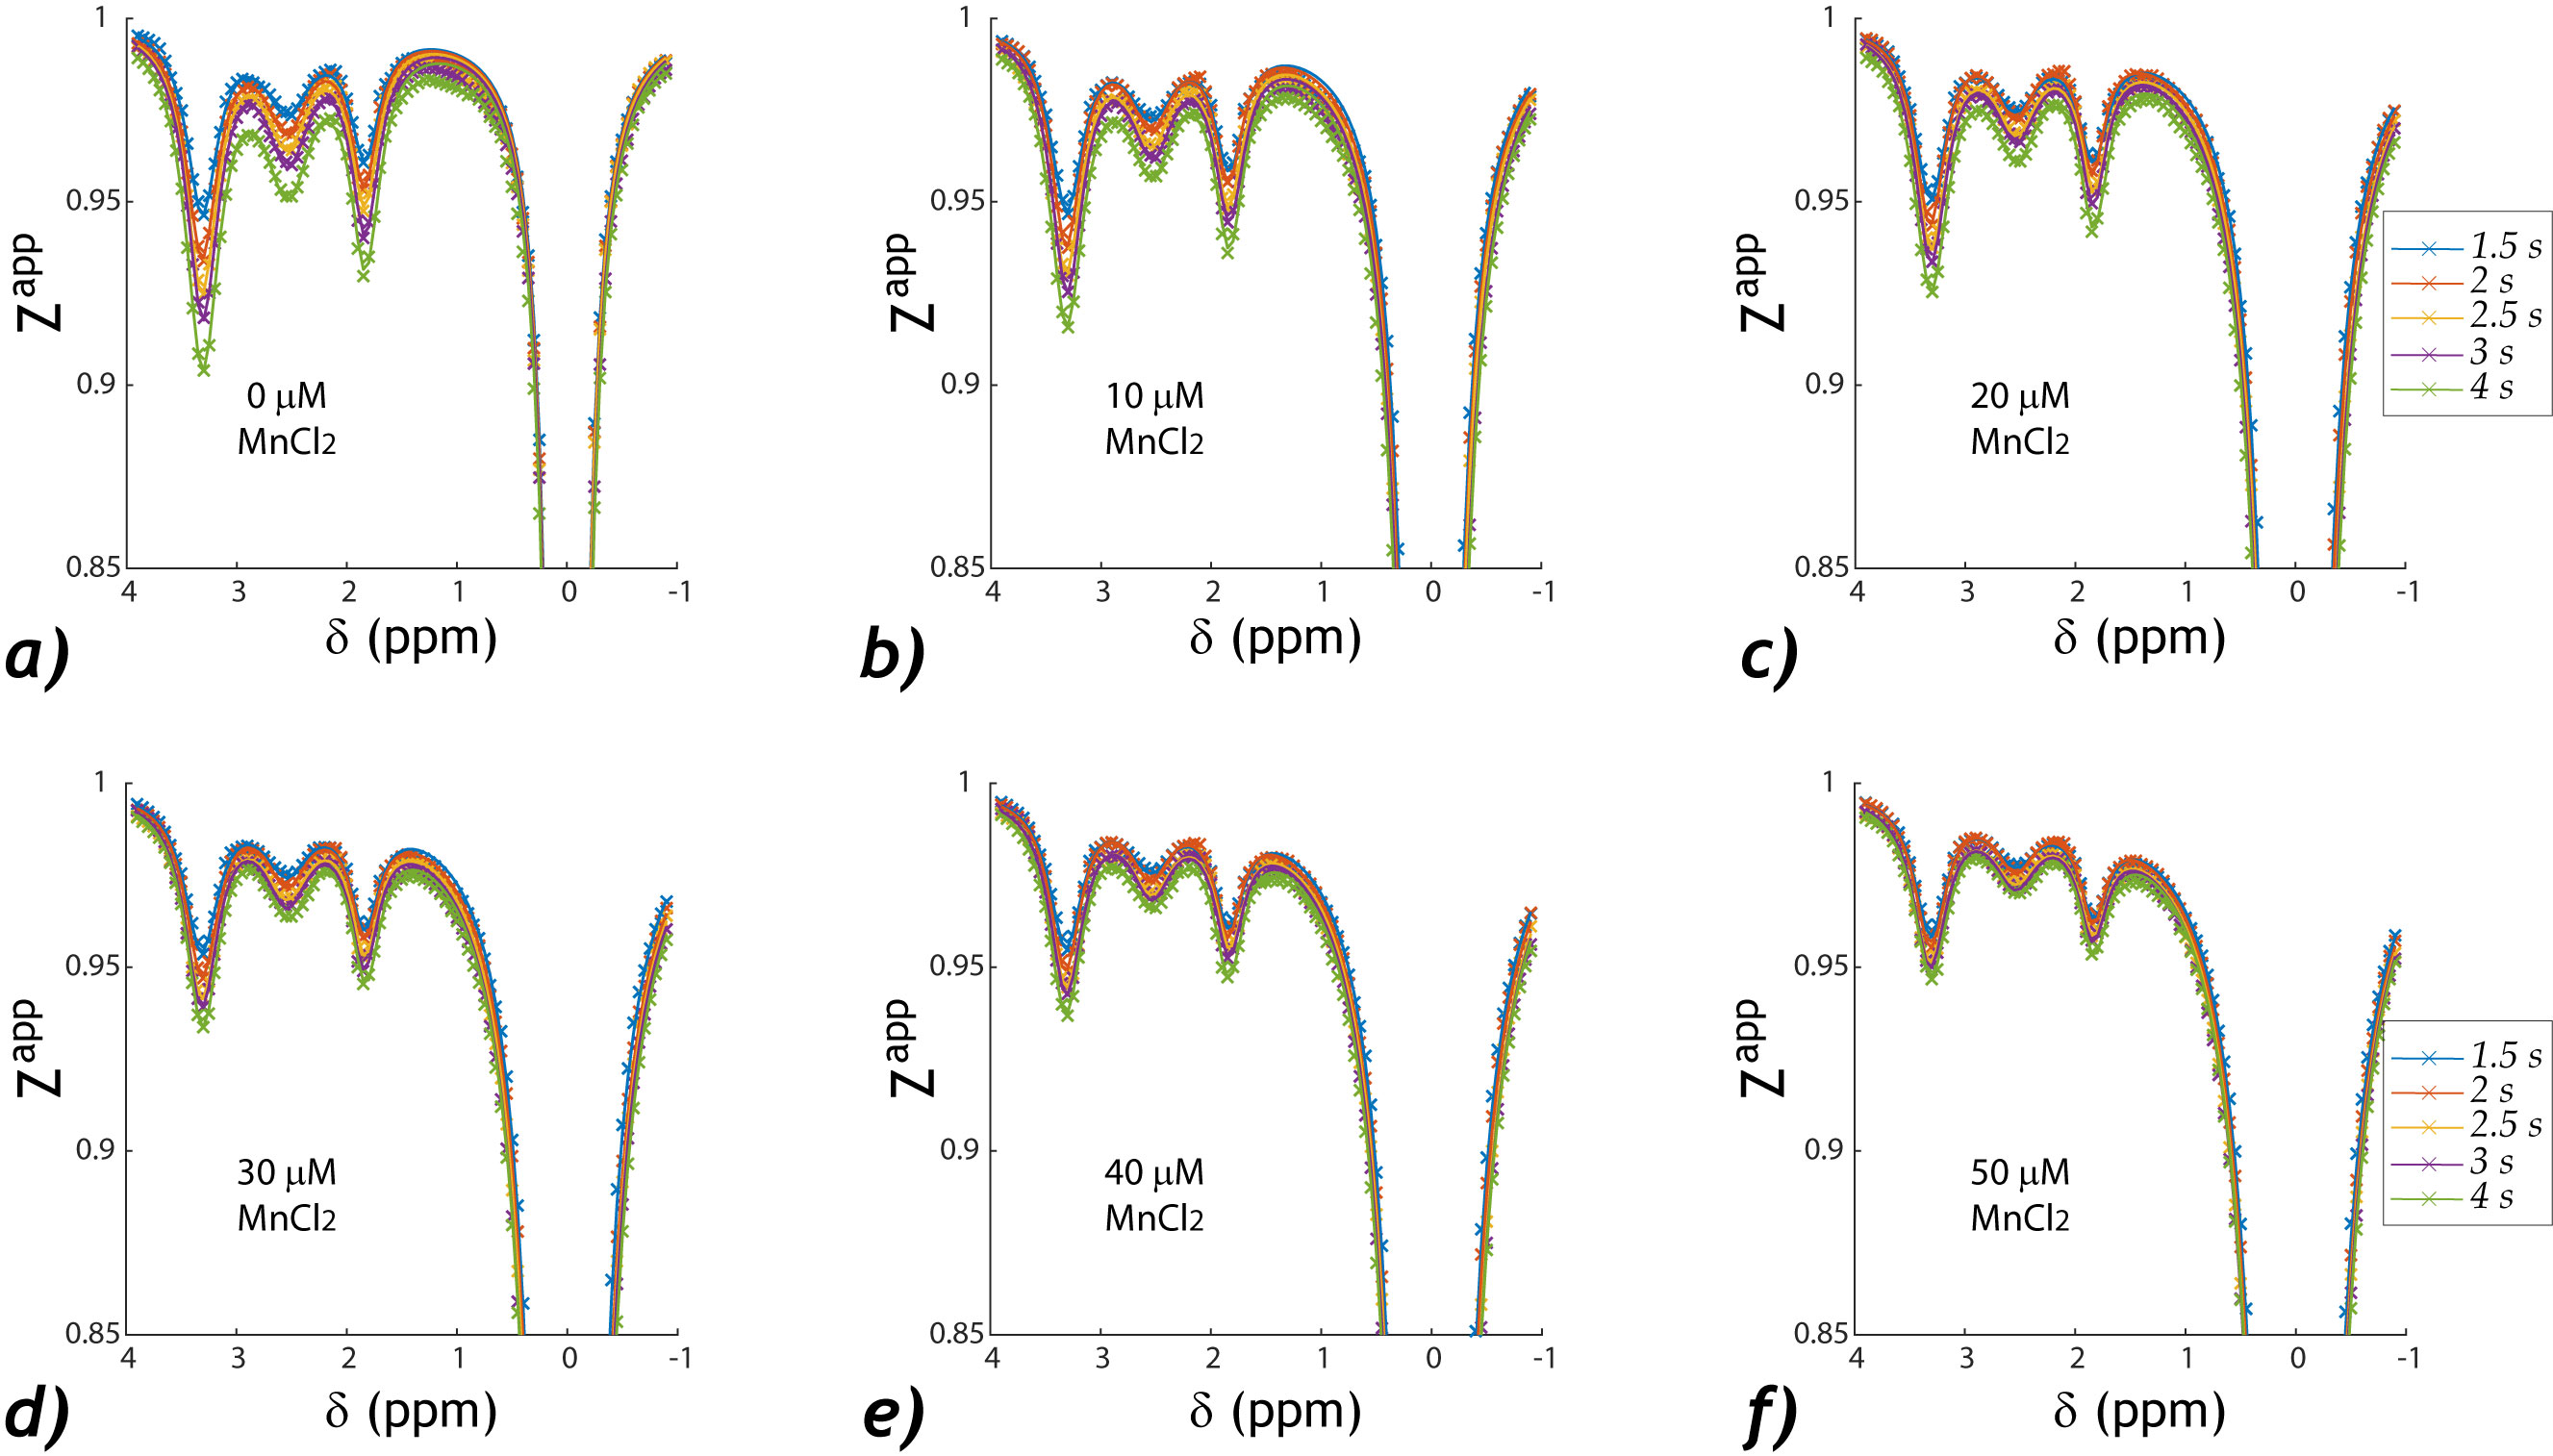
Spinlock-model-based multi-pool fitting of the
apparent CEST Z-spectra, including three labile groups at 3.3 ppm (amide), 2.5
ppm (amide), and 1.9 ppm (guanidyl), for each T1 vial, doped with dilute
manganese chloride at concentrations of 0, 10, 20, 30, 40 and 50 µM.
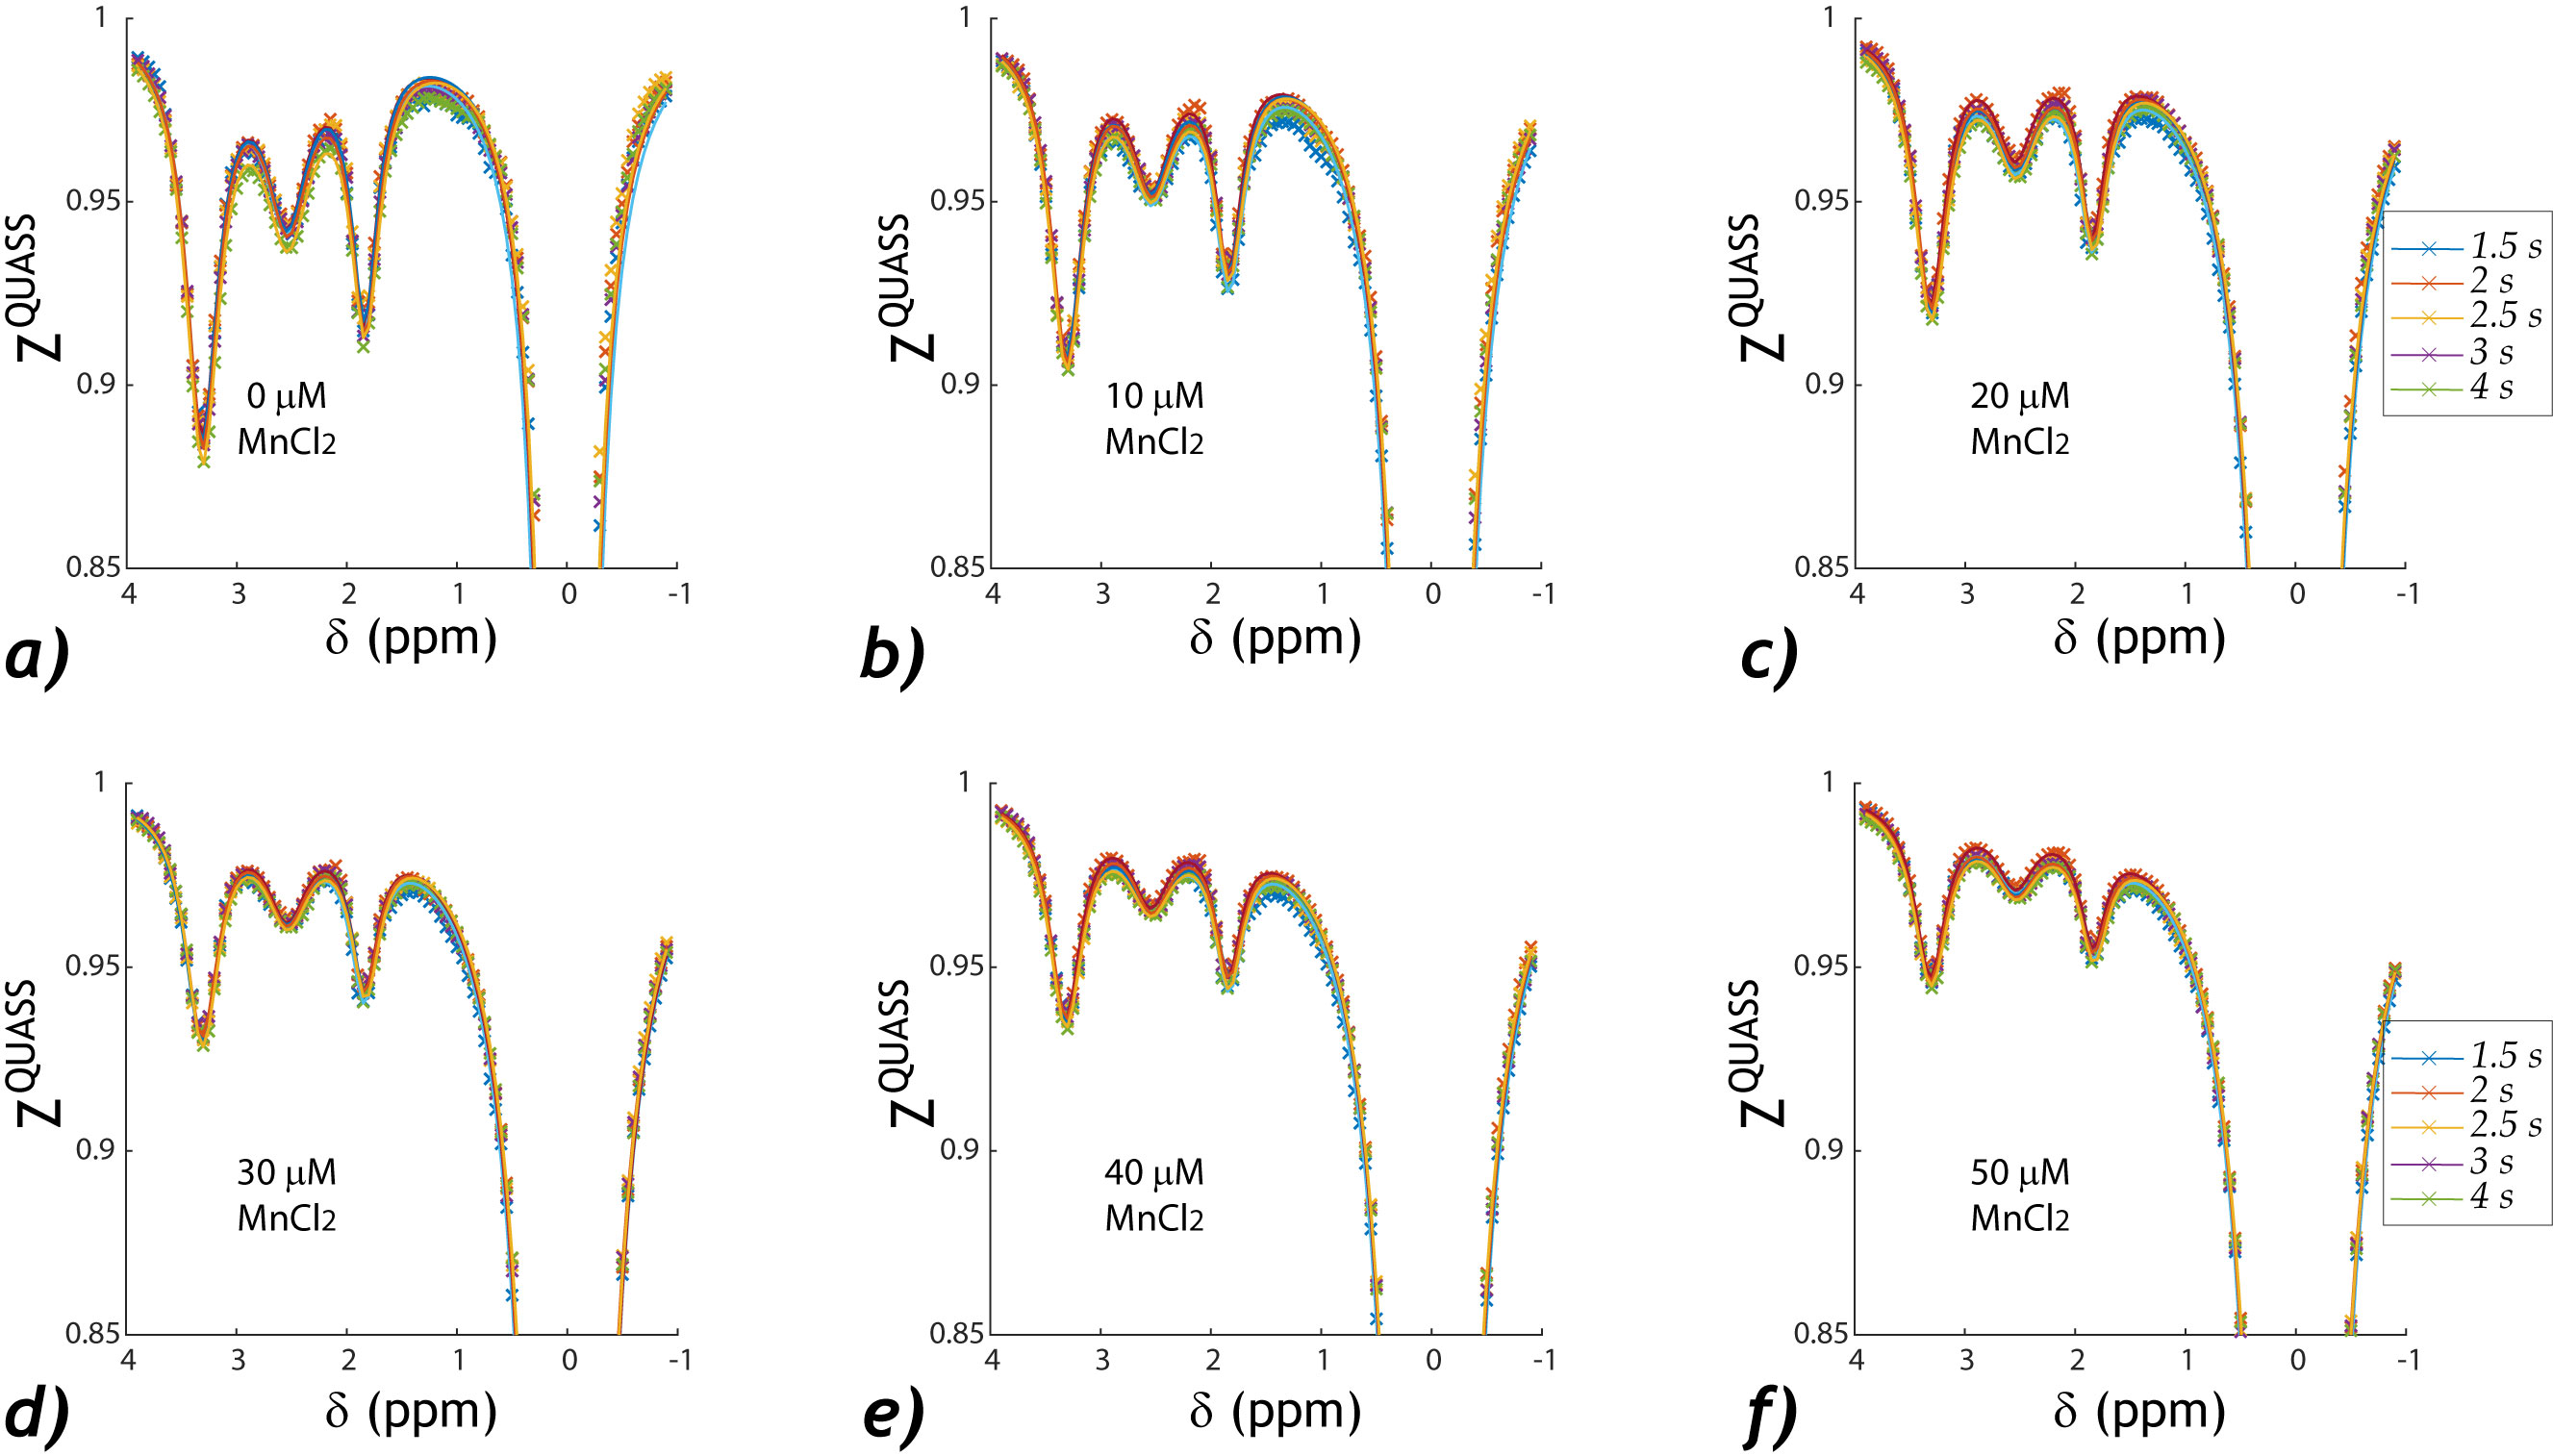
Spinlock-model-based multi-pool fitting of the
QUASS CEST Z-spectra, including three labile groups at 3.3 ppm (amide), 2.5 ppm
(amide), and 1.9 ppm (guanidyl), for each T1 vial, doped with dilute manganese
chloride at concentrations of 0, 10, 20, 30, 40 and 50 µM.
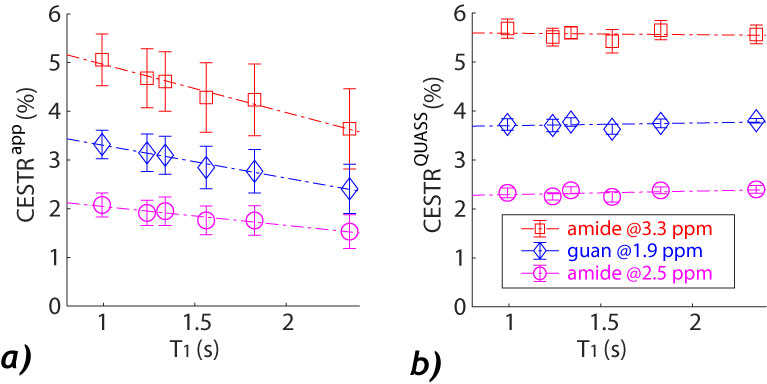
Comparison of CEST peaks determined from the
apparent and QUASS Z-spectra. a) The amide (3.5 ppm), amide (2.5 ppm), and
guanidyl (1.9 ppm) CEST peaks solved from the apparent CEST MRI showed
significant dependence on T1 (P<0.01). b) The amide (3.5 ppm), amide
(2.5 ppm), and guanidyl (1.9 ppm) CEST peaks solved from the QUASS CEST MRI
showed no significant correlation with T1 (P>0.05).
DOI: https://doi.org/10.58530/2023/3436