3435
Improved Bloch fitting and machine learning methods that analyze acidoCEST MRI
Tianzhe Li1,2, Julio Cardenas-Rodriguez3, and Marty David Pagel4
1Cancer Systems Imaging, UT MD Anderson Cancer Center, Houston, TX, United States, 2Medical Physics Program, UT Health, Houston, TX, United States, 3Data Translators LLC, Oro Valley, AZ, United States, 4Cancer Systems Imaging, MD Anderson Cancer Center, Houston, TX, United States
1Cancer Systems Imaging, UT MD Anderson Cancer Center, Houston, TX, United States, 2Medical Physics Program, UT Health, Houston, TX, United States, 3Data Translators LLC, Oro Valley, AZ, United States, 4Cancer Systems Imaging, MD Anderson Cancer Center, Houston, TX, United States
Synopsis
Keywords: Data Analysis, CEST & MT, pH imaging
AcidoCEST MRI can measure the extracellular pH of the tumor microenvironment. We have further refined our “Bloch fitting” method, and shown that this analysis method can accurately and precisely measure pH without additional MRI information, with an accuracy of 0.03 pH units. In addition, we have developed a machine learning method that can classify pH as > 7.0 or < 6.5 pH units (PPV=0.94, NPV=096), and a machine learning regression method that can estimate pH with a mean absolute error of 0.031 pH units.INTRODUCTION
AcidoCEST MRI is used to measure extracellular pH in the tumor microenvironment by evaluating CEST spectra of an exogenous agent that produces two CEST signals, with at least one pH dependent signal.1 The Bloch-McConnell equations modified to include pH as a fitting parameter can be used to analyze CEST MRI, known as “Bloch fitting”.2 However, these equations also fit for T1, T2, B1, and B0, raising questions about whether this multiparametric fitting is the best approach. These equations also fit for concentration, and temperature can also affect chemical exchange rates, raising concerns that concentration and temperature can affect the pH measurement.More recently, machine learning methods have been used to evaluate CEST MRI.3 AcidoCEST MRI provides an intriguing opportunity for machine learning methods, because CEST spectra of an exogenous agent can be difficult to visualize by humans (so that human learning is often reduced to focusing on one saturation frequency) and yet the spectra are rich in information for machine learning. Both classification methods and regression methods can be employed to evaluate acidoCEST spectra.
METHODS and MATERIALS
To refine the analysis of acidoCEST MRI, we acquired 36,000 CEST spectra of iopamidol (Isovue™, Bracco Diagnostics) at 5 concentrations, 5 T1 relaxation times, 5 temperatures, 6 saturation powers, 6 saturation times, and 8 pH values (Figure 1). We also measured T1, T2, B1 and B0 of each sample, and carefully controlled and validated the sample temperature. We used an advanced QUESP method to measure chemical exchange rates of iopamidol over a range of pH, and the Bloch fitting method was recalibrated with these results. Bloch fitting was used to estimate pH using only CEST spectra or by including T1, T2, B1, and/or B0 measurements (16 combinations). We analyzed how the pH estimates from Bloch fitting were potentially dependent on concentration and temperature. Computation time was measured for the analyses with the 16 combinations.The same experimental dataset was split into sets of training data (70%) and testing data (30%) to assess machine learning methods (Figure 2). We trained and validated the Linear Regression Classification (LFC) model and the Random Forest Classification (RFC) model to classify pH as > 7.0 or pH < 6.5. We evaluated the sensitivity, specificity, PPV and NPV for each classification. We also trained and validated a regression approach using a Random Forest Regression (RFR) model and a LASSO model to estimate pH between 6.2 – 7.4. We evaluated the mean absolute error of the pH measurements.
RESULTS
Our Bloch fitting method could accurately and precisely measure pH throughout the range of pH 6.2-7.3, using CEST results without the need for experimental T1, T2, B1, or B0 measurements, resulting in an accuracy of 0.03 pH units relative to a benchtop pH meter(Figure 3). As expected, computation time was longest for analyses that only included CEST results. The most accurate and precise pH estimates were obtained with saturation power of 3 mT and saturation time of 3 sec. The pH estimates were dependent on temperature, and independent of concentration and T1 time. The precision of the measurement was dependent on concentration, as evaluated with Lin’s Concordance Correlation Coefficient (LCCC).These results show that the Bloch fitting method is robust for estimating pH with acidoCEST MRI. Obviating the need for experimental T1, T2, B1, or B0 measurements reduces total acquisition time, although lengthy analysis time is then required for the multiparametric Bloch fitting process. A concern remains that a biological milieu may interact with iopamidol, altering the pH measurement. However, the independence of the pH estimate from the Bloch fitting method on concentration and T1 mitigates this concern.
For the evaluation of machine learning methods, the RFC produced the best classifications at both pH thresholds of > 7.0 and < 6.5 pH unites, with a positive predictive value of 0.96 and negative predictive value of 0.94 for both thresholds (Table 1). The RFR measured pH with a mean absolute error of 0.031 pH units that was consistent throughout the pH range, which performed better than LASSO that showed a mean absolute error of 0.24 pH units that was biased against low and high pH (Figure 3). The most accurate and precise pH estimates were obtained with saturation power of 3 mT and saturation time of 3 sec.
The outstanding pH classifications with RFC machine learning can be used for clinical diagnoses. A pH > 7.0 is an outstanding threshold for differentiating cancer vs. non-cancer lesions. A pH < 6.5 is an excellent threshold for differentiating highly aggressive and metastatic tumors from more benign tumors. The outstanding accuracy and precision of pH estimates from RFR can be used to provide a more quantitative diagnosis of tumor status and treatment effect. Importantly, these machine learning methods are very fast, which addresses a pitfall of the Bloch fitting method.
CONCLUSIONS
This study concludes our development of the Bloch fitting method for acidoCEST MRI. This study demonstrates opportunities to apply machine learning to the clinical translation of acidoCEST MRI.Acknowledgements
Our research is supported by the NIH/NCI through grants R01 CA231513 and P30 CA016672.References
1. Chen LQ, et al. Evaluations of extracellular pH within in vivo tumors using acidoCEST MRI. Magn Reson Med, 2014;72:1408-1417.
2. Jones KM, et al. Respiration gating and Bloch fitting improve pH measurements with acidoCEST MRI in an ovarian orthotopic tumor model. Proc SPIE 2016;9788:978815.
3. Goldenberg JM, et al. Machine learning improves classification of preclinical models of pancreatic cancer with chemical exchange saturation transfer MRI. Magn Reson Med 2019;81:594-601.
Figures
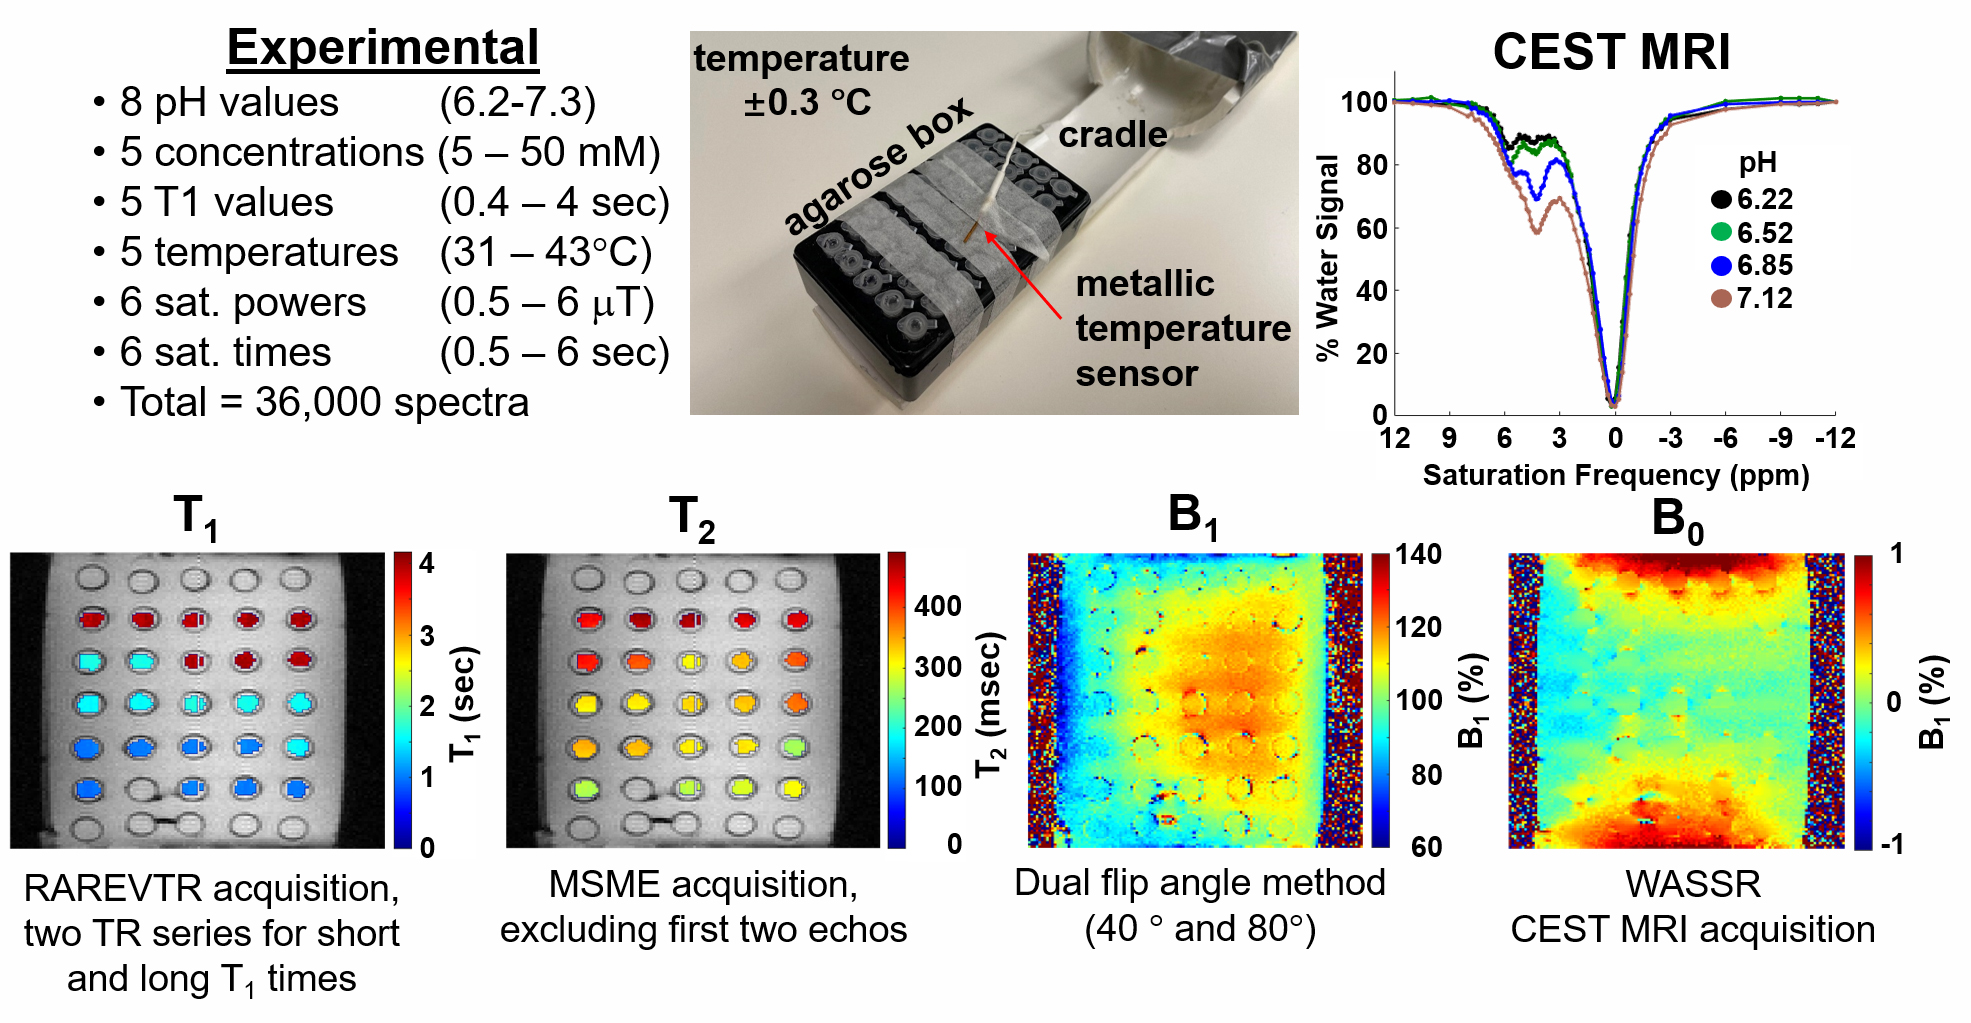
Figure 1. 36,000 experimental CEST spectra were
acquired using iopamidol under a variety of experimental conditions and using a
range of acquisition parameters for the CEST saturation period. In addition, parametric maps of T1, T2, B1,
and B0 were also acquired.
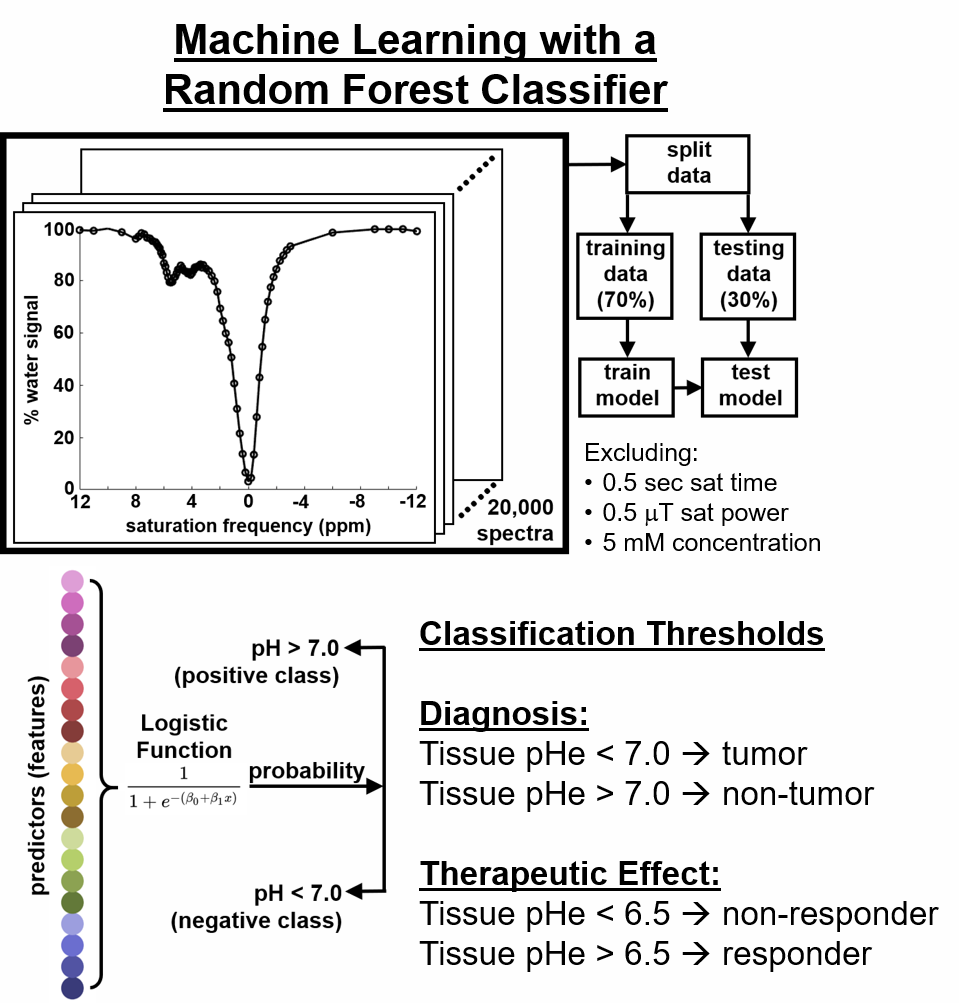
Figure 2. The same experimental dataset was split into
sets of training data (70%) and testing data (30%) to assess machine learning
methods (Figure 2). We trained and validated the Linear Regression
Classification (LFC) model and the Random Forest Classification (RFC) model to
classify pH.
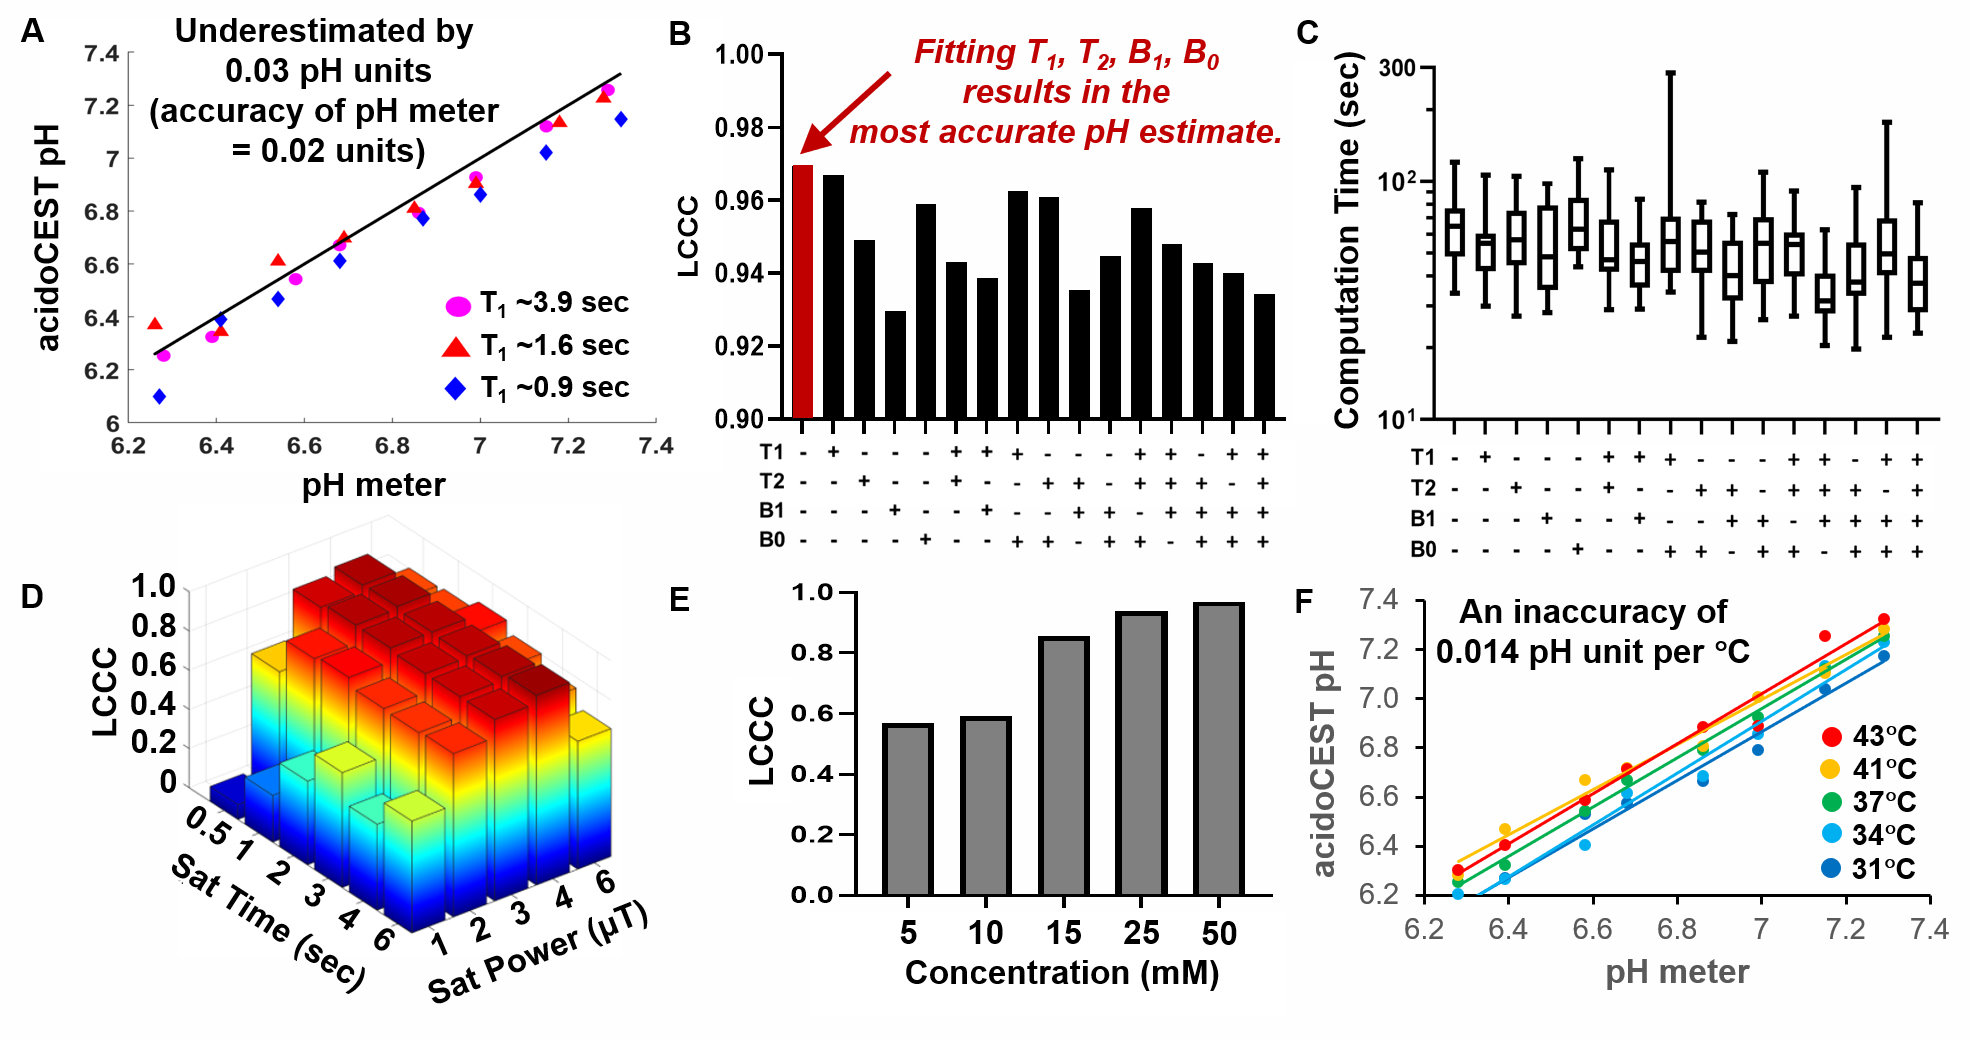
Figure 3. Bloch fitting for acidoCEST MRI. A) Bloch fitting measured pH with an accuracy
of 0.03 pH units throughout the range of 6.2-7.4. B) CEST MRI can precisely measure pH without
additional MRI information. C) The
fitting is faster when experimental T1, T2, B1, and/or B0 are substituted for
fitting these parameters. D) AcidoCEST
MRI is optimally performed at 3 mT saturation power and 3 sec saturation
time. E) The precision of the pH
measurement becomes more precise at higher concentration of agent. F) Temperature causes a systematic error of
0.014 pH units per °C.
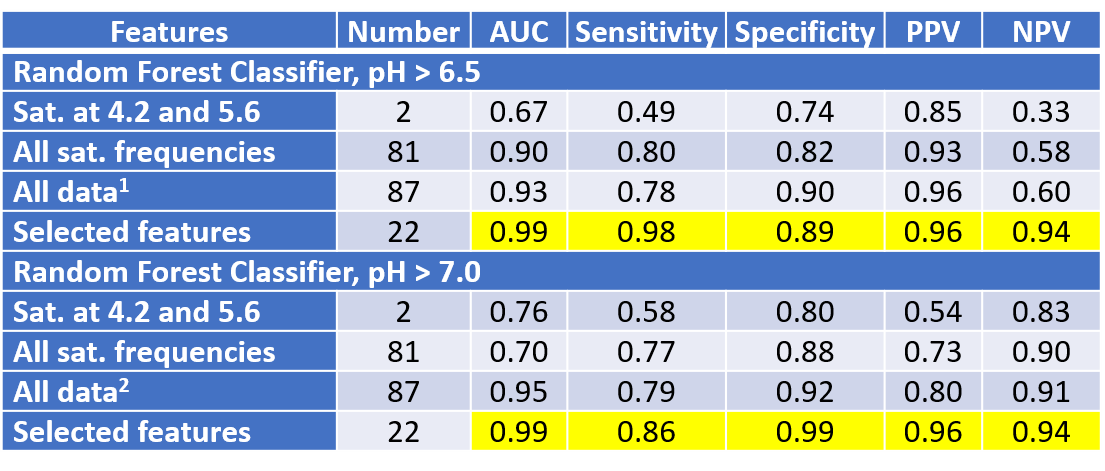
Table 1. The Random Forest Classifier
can classify pH > 7.0 or < 6.5 with an outstanding Positive Predictive
Value (PPV) and Negative Predictive Value (NPV), which are the most relevant
metrics when evaluating individual patients.
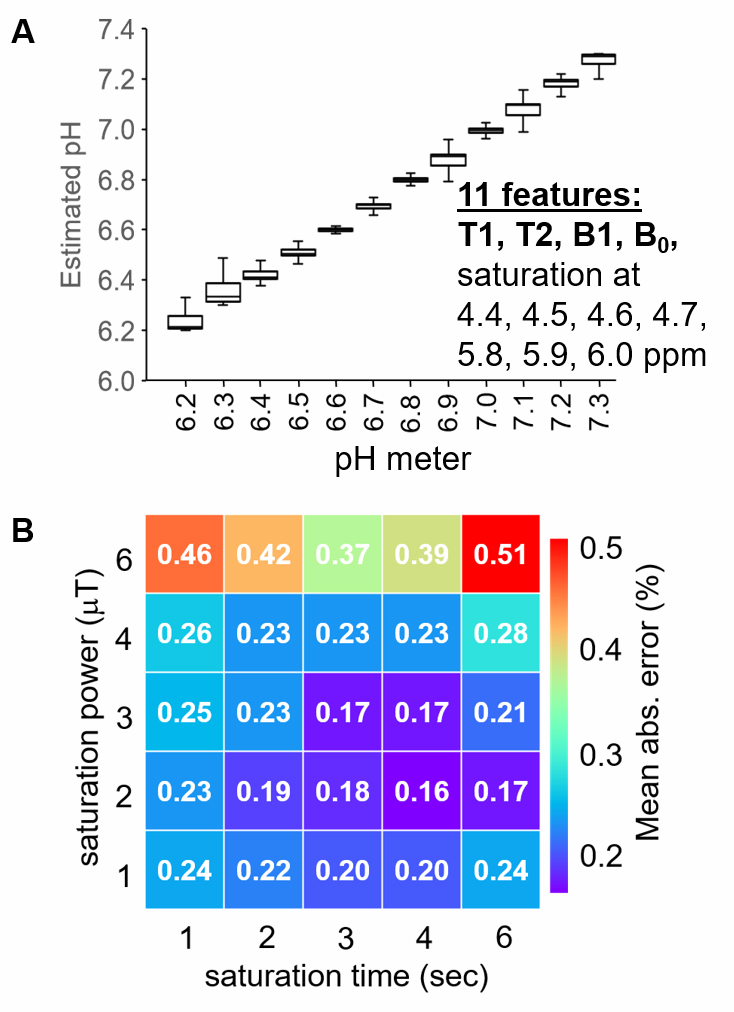
Figure 4. The nonlinear Random Forest Regression method
can estimate pH from acidoCEST MRI results.
A) the linear regression accurately and precisely estimated pH
throughout the range of 6.2-7.3. B) The
best accuracy is obtained with 3 mT saturation power and 3 sec saturation
time.
DOI: https://doi.org/10.58530/2023/3435