3431
Association of Ki-67 With Metabolite and Lipid Levels in High Grade Breast Cancer Patients based on Correlated MR Spectroscopic Imaging and Biopsy1Radiological Sciences, University of California, Los Angeles, Los Angeles, CA, United States, 2Surgery, University of California, Los Angeles, Los Angeles, CA, United States
Synopsis
Keywords: Data Analysis, Breast
Five-dimensional (5D) echo-planar correlated spectroscopic imaging (EP-COSI) combines 2 spectral and 3 spatial dimensions to record two dimensional (2D) correlated spectroscopy (COSY) spectra in multiple regions in multiple slices. In this study, multiple 2D COSY spectra were recorded from breast cancer patients by 5D EP-COSI within practical scan time durations using non-uniform undersampling of one spectral and two spatial dimensions, and compressed sensing-based reconstruction. Different metabolite and lipid ratios were quantified and its association with Ki-67 metric was studied. Findings of this study showed statistically significant association of metabolite and lipid levels with Ki-67 measures in breast cancer patients.Introduction
MR spectroscopy (MRS) is an efficient biochemical tool for non-invasively analyzing metabolite and lipid concentrations in human breast tissues (1-10). Earlier research on breast cancer MRS has focused on recording one dimensional (1D) spectra (1-10) which typically reported changes in choline levels and water to fat ratios in malignant breast tissues (10). Two-dimensional MRS on the other hand is able to resolve peak information along an additional spectral dimension which overcomes the overlap limitation of 1D MRS imaging (MRSI) (11-13). Five-dimensional (5D) echo-planar correlated spectroscopic imaging (EP-COSI) combines 2 spectral and 3 spatial dimensions to record two dimensional (2D) correlated spectroscopy (COSY) spectra in multiple regions in multiple slices (14). In this study, multiple 2D COSY spectra were recorded in breast cancer patients by 5D EP-COSI within practical scan time durations using non-uniform undersampling (NUS) of one spectral and two spatial dimensions, and compressed sensing (CS)-based reconstruction (15-16). Different metabolite and lipid ratios were quantified and its association with Ki-67 metric was studied.Materials and Methods
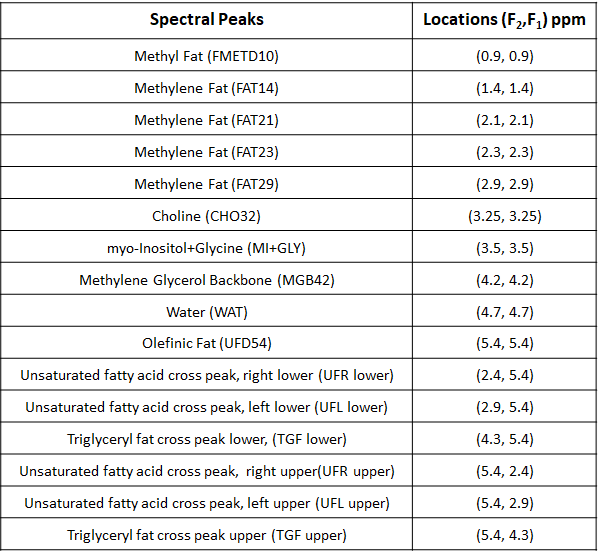
Eleven malignant (grade 2 and 3, mean age 50(range:33-71) years) breast cancer patients were included in this study. The malignant masses of the participants were biopsied and the clinical characteristics including Ki-67 expression levels were obtained. MRSI scans were performed after obtaining consent according to the on-site institutional review board guidelines. All scans were acquired on a Siemens 3T Skyra scanner. A dedicated “receive” 24-channel phase-array breast coil and a body “transmit” coil was used for all patients, who were imaged in the prone (head-first) position. The 5D EP-COSI data with 1.5 mL voxel volume was acquired using FOV = 160×160×120 mm3 and matrix size = 16×16×8. The TR/TE were 1500/35 ms, 64 t1 points were collected with a spectral bandwidth of 1250 Hz along F1. The bipolar echo-planar readout gradient sampled 512 complex t2 points with a spectral width of 1190 Hz long F2. In addition, a non-water suppressed EP-COSI scan with one t1 point was also acquired for eddy current phase correction (17) and the total time for acquisition was 28 minutes and 48 seconds. The data was non-uniformly undersampled in the ky-kz space and t1 dimensions with an acceleration factor of 8, which was then reconstructed using Group Sparsity (GS)-based CS technique (15-16). The proton 2D peaks in the 5D EP-COSI spectrum were quantified using an adaptive peak integration technique that corrects for frequency drifts and confines the integration range for each metabolite on a voxel by voxel basis. Extracted 2D spectrum contained contributions from proton resonances along the diagonal (F1=F2), as well as off-diagonal which are listed in table 1.Results
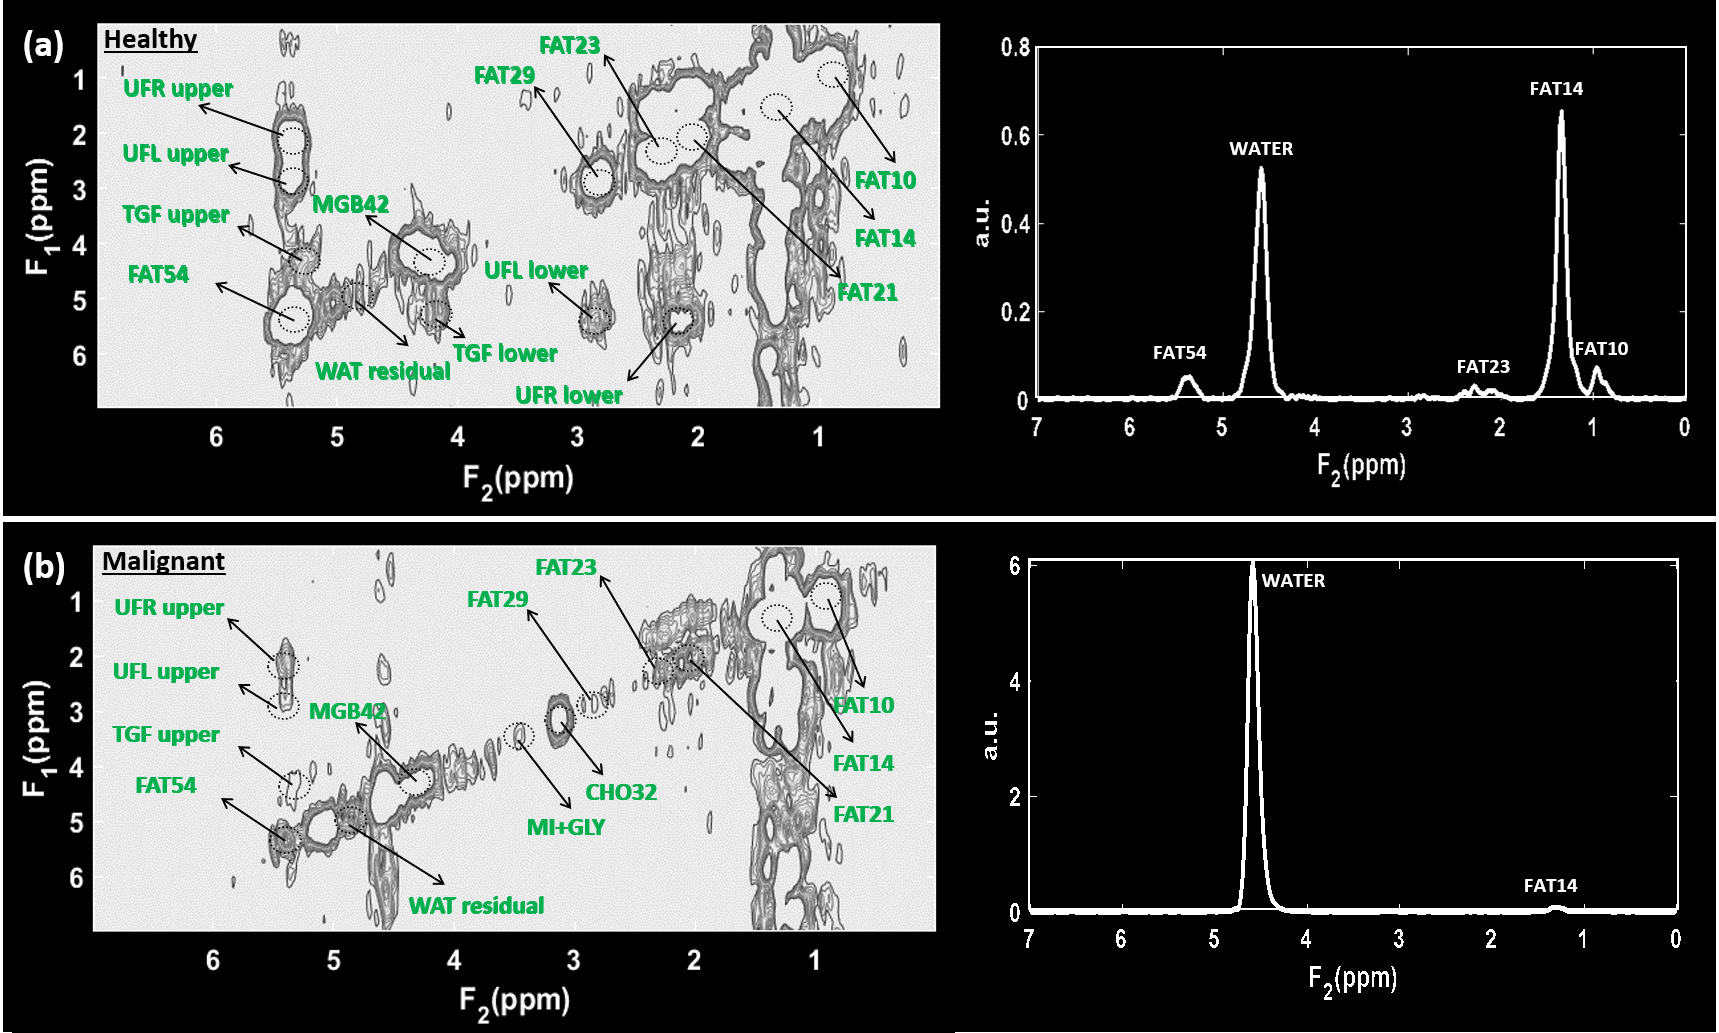
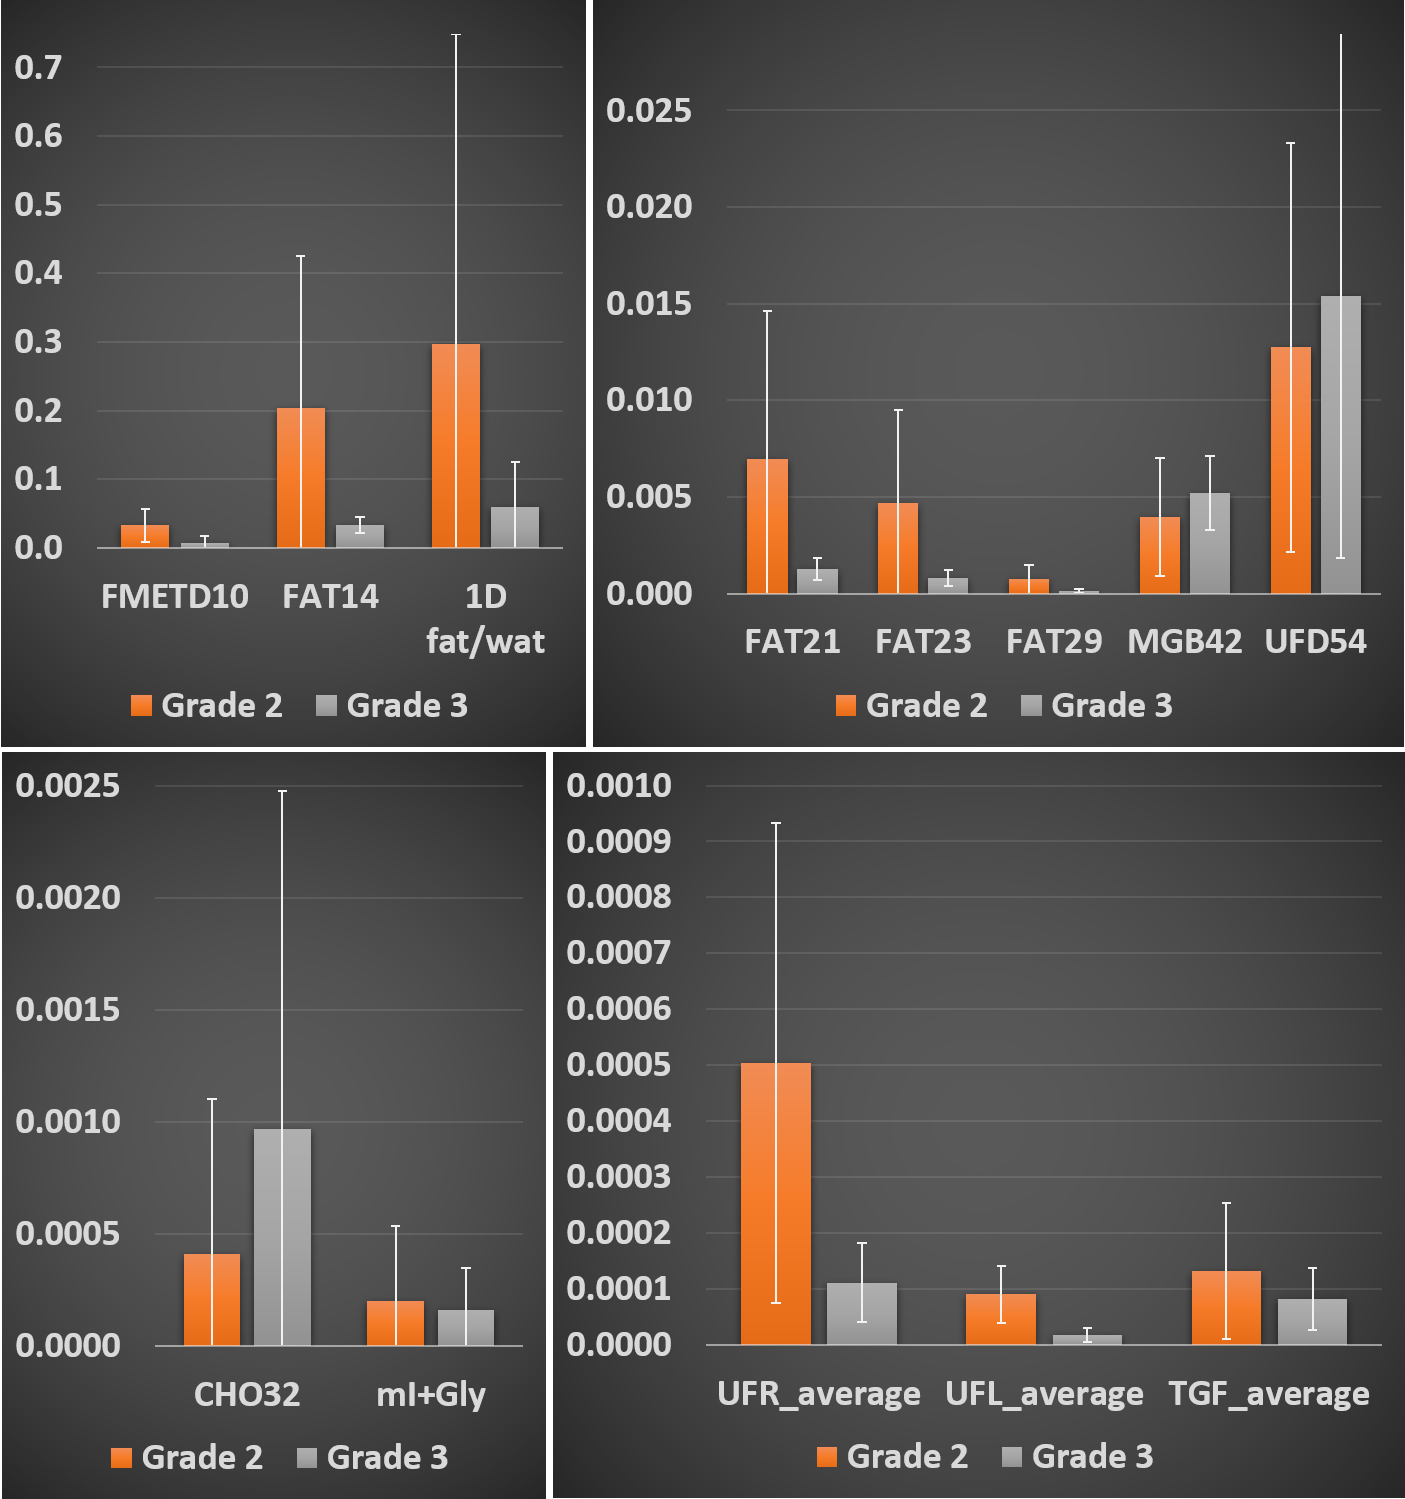
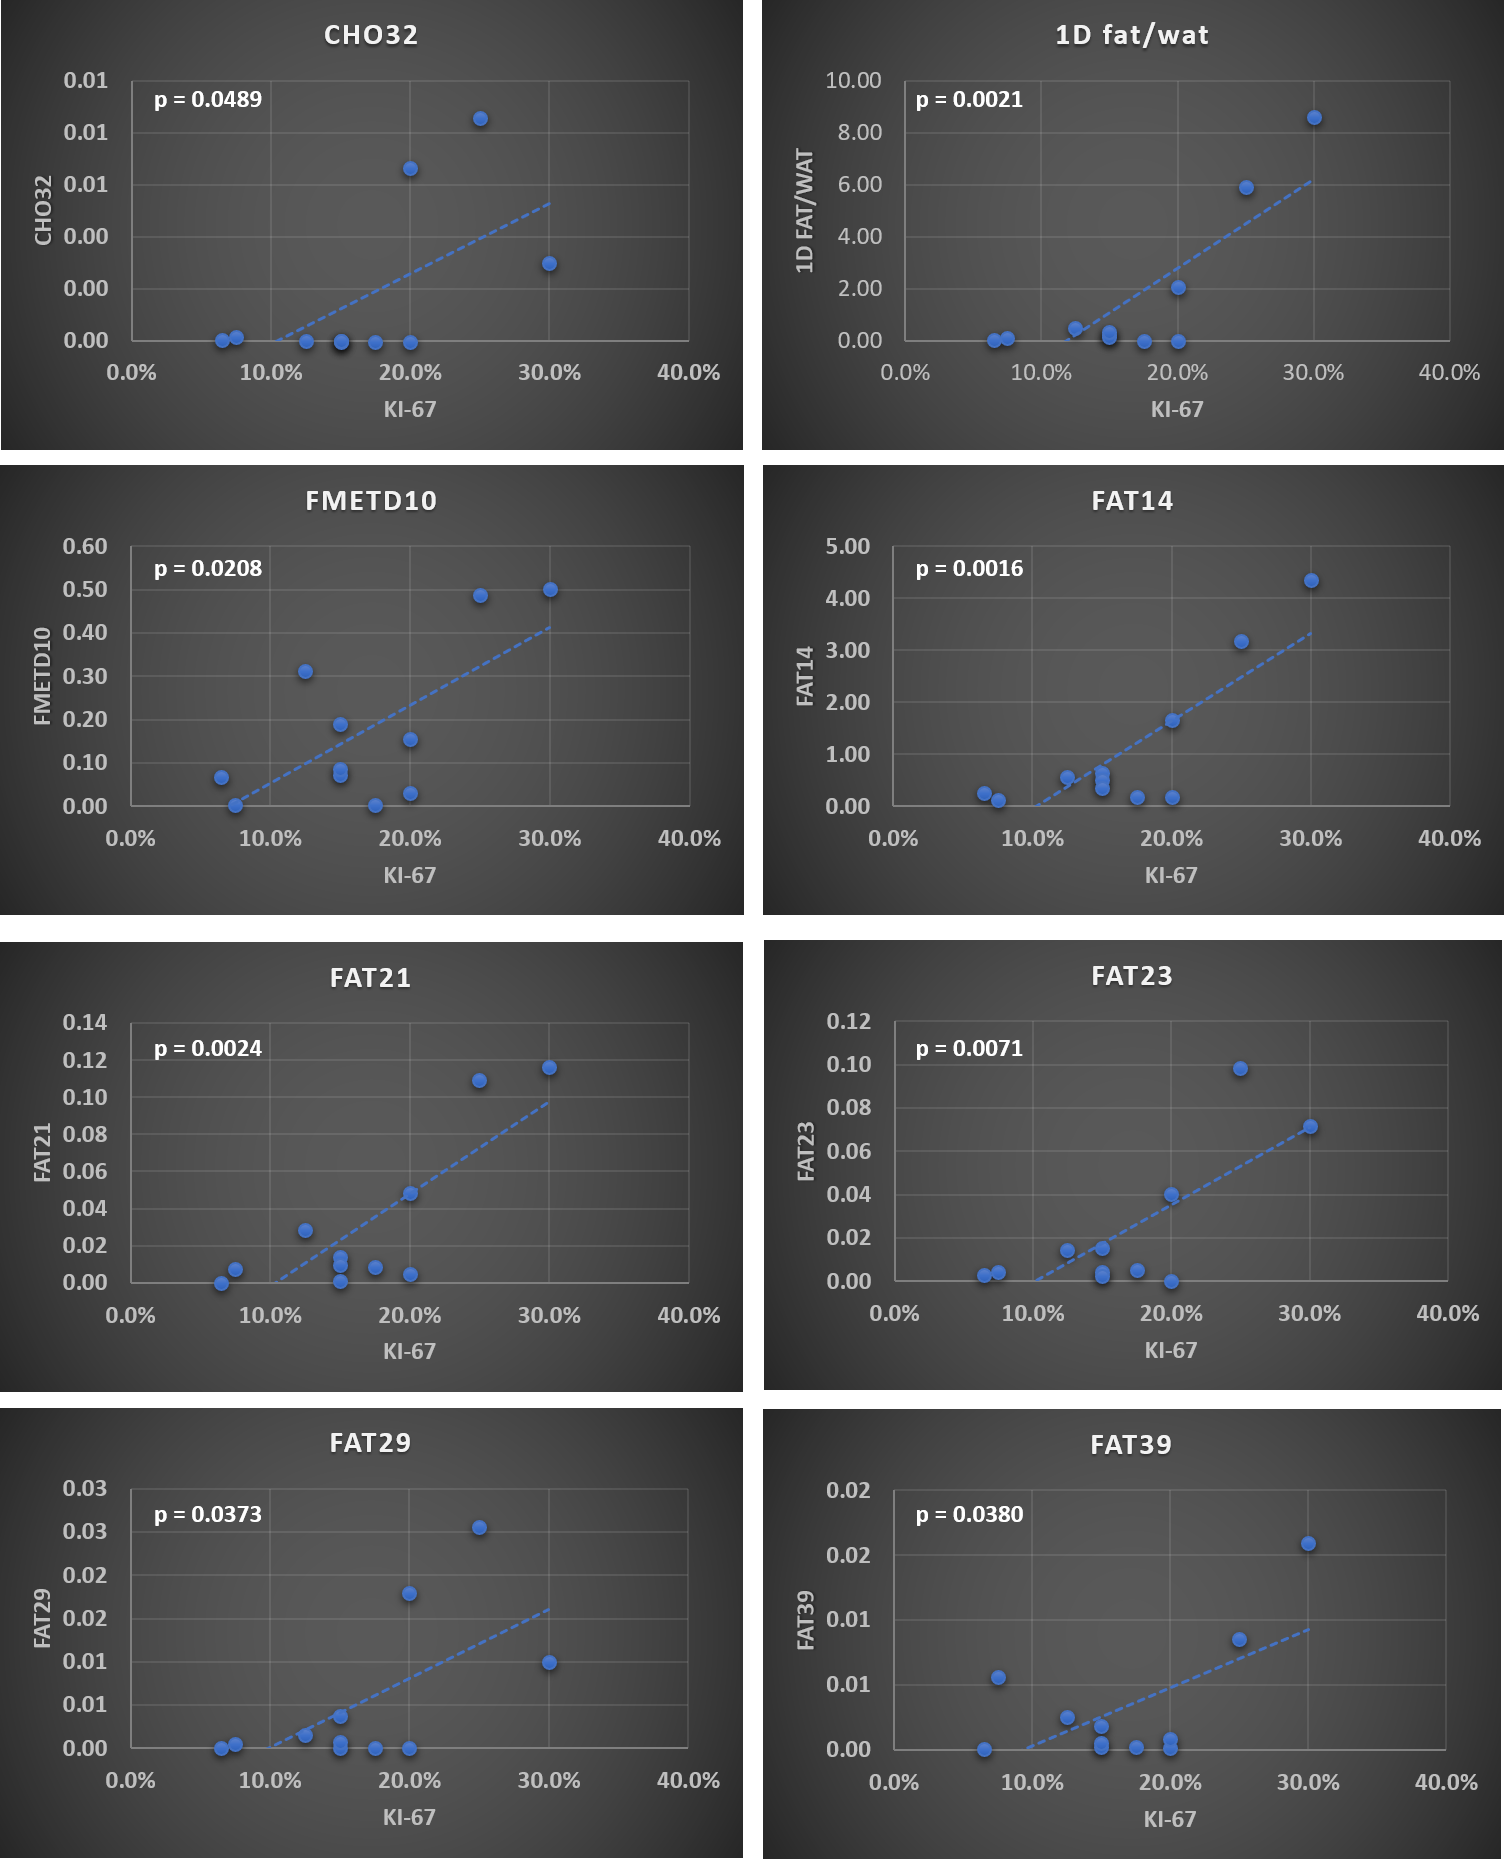
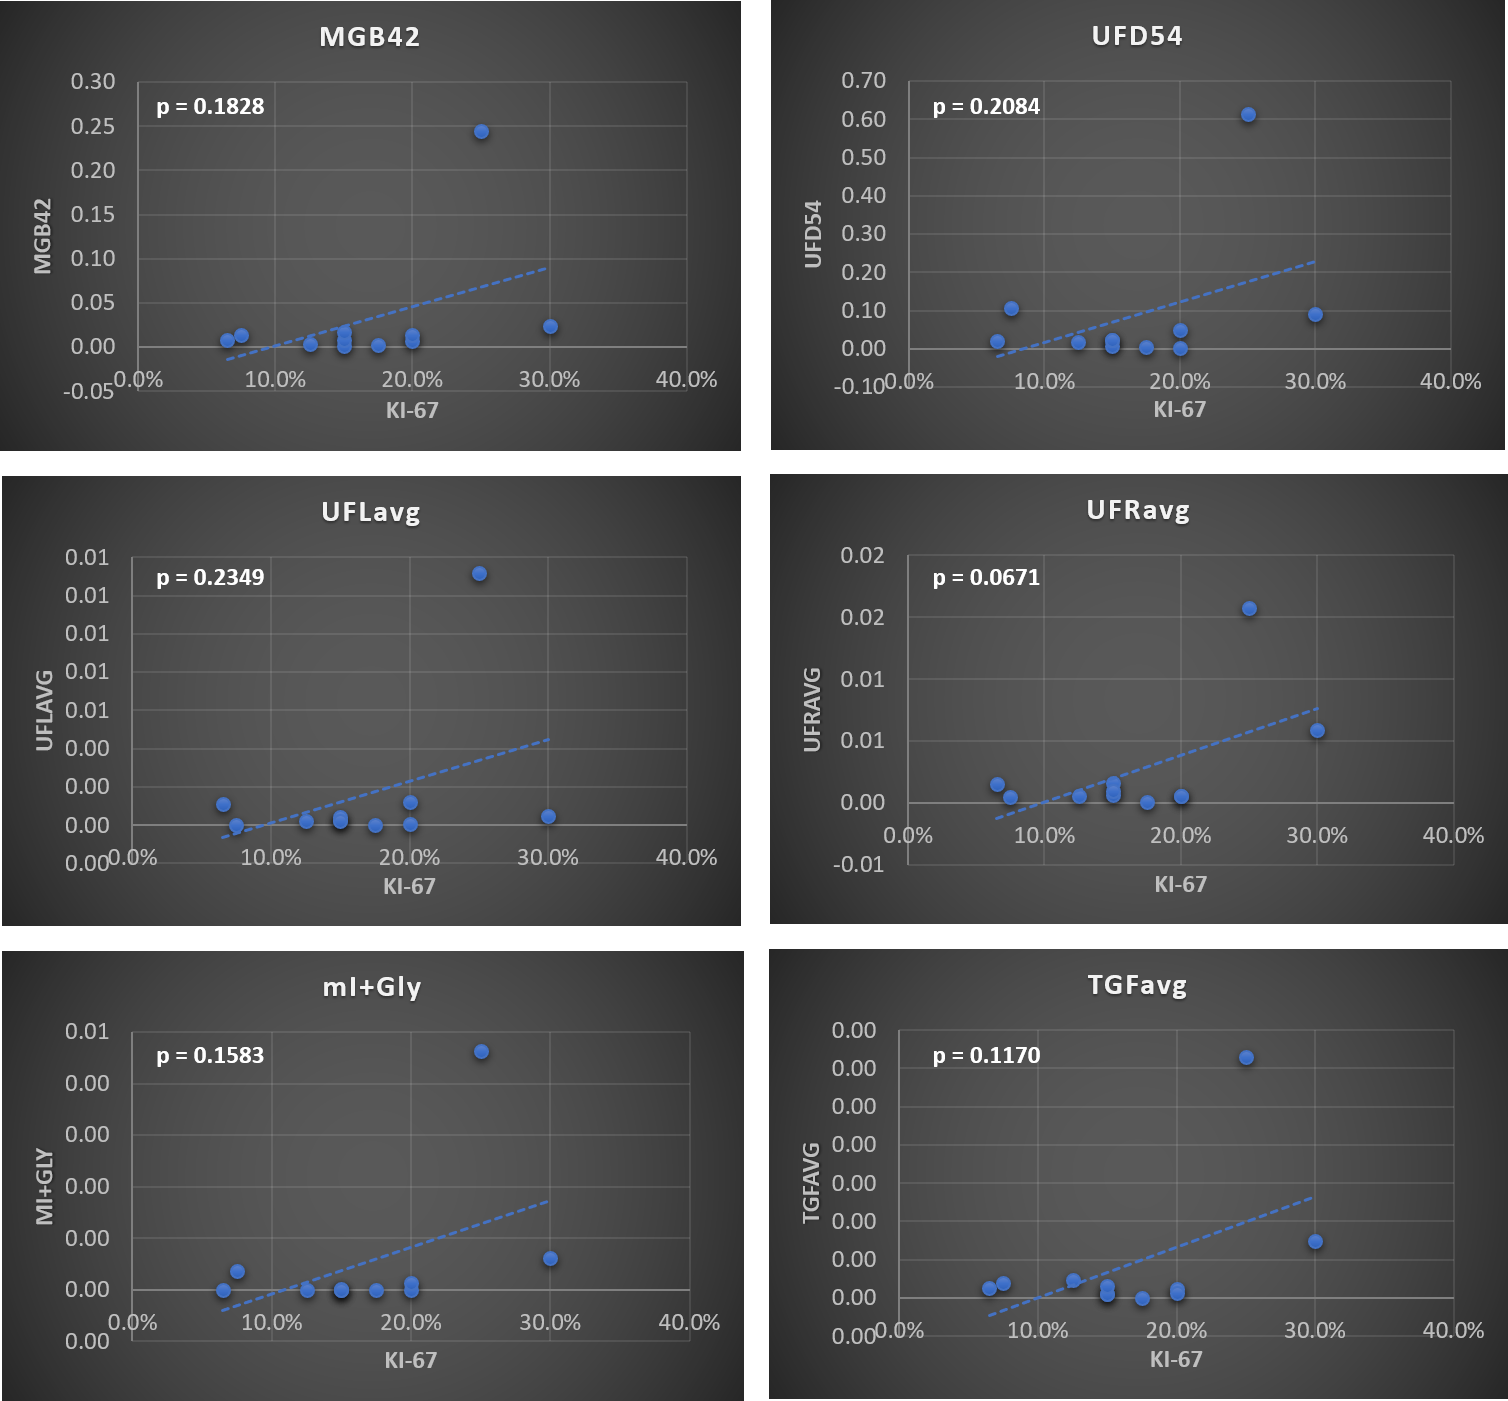
Figure 1 shows representative 2D and 1D spectrum extracted from locations of healthy tissue (Fig. 1(a)) and a malignant tissue (Fig. 1(b)) respectively in a 45-year-old patient (grade 3 invasive ductal carcinoma and ductal carcinoma in situ, estrogen receptor positive, progesterone receptor positive, her2 positive, Ki-67 = 20% and BI-RADS 5, size: 33mm). The arrow indicates different metabolites and lipid peaks identified in the spectra as listed in table 1. These metabolites and lipid ratios with respect to 1D water were computed. The average of upper and lower cross peaks was used for left and right unsaturated fatty acid cross peaks. myo-Inositol (mI) and glycine (Gly) peaks were quantified together since they were separated by only 0.006 ppm at 3T. The results of quantitation along with 1D fat/wat ratios are shown in Fig. 2 as bar graphs. It shows the means (95% CI) of different metabolite and lipid ratios. These ratios were correlated with the Ki-67 expression levels from biopsy and the results are shown in Figs. 3-4. Fig. 3 shows the metabolite and lipid ratios versus Ki-67 values with significant (p<0.5) correlation while Fig. 4 shows the results were the correlation was not statistically significant. The corresponding significance level is shown in the insert of each plot.Discussion
In this work, prospectively undersampled 5D EP-COSI data were reconstructed using GS-CS and 2D COSY spectra from multiple locations in malignant breast masses were analyzed and correlated with Ki-67 values. Variations in water and fat resonances are commonly observed in malignant tissues and have been reported to be useful in identifying malignancy (10) in 1D spectroscopy. The spectral dispersion along two dimensions in the 5D EP-COSI on the other hand helps to distinguish and quantify additional metabolite and lipid markers such as Cho, mI+Gly, left and right unsaturated fatty acid cross peak. Our results show that these metabolite and lipid ratios show moderate to strong correlation with the Ki-67 measures from biopsy. We expect more statistical significance with a larger cohort of patients, and further lead to developing learning based techniques to classify cancer grades based on metabolite and lipid ratios from 2D spectra and reduce the need for breast biopsies.Conclusion
Findings of this study showed statistically significant association of metabolite and lipid levels with Ki-67 measures in breast cancer patients. The high correlation of Ki-67 with additional metabolite and lipid ratios from 5D EP-COSI shows its potential in becoming reliable biomarkers which may result in reduced breast biopsies. However, further validation using a larger cohort of breast cancer patients is needed.Acknowledgements
A grant support from the CDMRP Breast Cancer Research Program (# W81XWH-16-1-0524), scientific support of Drs Brian Burns, Neil Wilson, Rajakumar Nagarajan and Zohaib Iqbal, and Ms. Victoria Rueda with the recruitment of study subjects are gratefully acknowledged.References
1. Gribbestad IS, Sitter B, Lundgren S, Krane J, Axelson D. Metabolite composition in breast tumors examined by proton nuclear magnetic resonance spectroscopy. Anticancer Res 1999; 19: 1737-1746.
2. Aboagye EO, Bhujwalla ZM. Malignant transformation alters epithelial cells. Cancer Res 1999; 59(1): 80-84.
3. Jagannathan JR, Seenu V, Kumar M. Potential of in vivo proton spectroscopy in the assessment of breast lesions without the use of contrast agent. Radiology 2002;223:281-282.
4. Dorius MD, Pinappel RM, Jansen-van der Weide MC, Kappert P, Oudkerk M, Sijens PE. Determination of choline concentration in breast lesions: quantitative multivoxel proton MR spectroscopy as a promising noninvasive assessment tool to exclude benign lesions. Radiology 2011;259:695-703.
5. Bolan PJ, Kim E, Herman BA, et al. MR spectroscopy of breast cancer for assessing early treatment response: Results from the ACRIN 6657 MRS trial. J Magn Reson Imaging. 2017 Jul;46(1):290-302.
6. Roebuck JR, Cecil KM, Schnall MD, Lenkinski RE. Human breast lesions: characterization with proton MR spectroscopy. Radiology 1998; 209: 269-275.
7. Sharma U, Mehta A, Seenu V, Jagannathan NR. Biochemical characterization of metastatic lymph nodes of breast cancer patients by in vitro 1H magnetic resonance spectroscopy: a pilot study. Magn Reson Imaging 2004; 22: 697-706.
8. Gribbestad IS, Sitter B, Lundgren S, Krane J, Axelson D. Metabolite composition in breast tumors examined by proton nuclear magnetic resonance spectroscopy. Anticancer Res 1999; 19: 1737-1746.
9. Haukaas TH, Euceda LR, Giskeodegard GF, Bathen TF. Metabolic portraits of breast cancer by HR MAS MR Spectroscopy of intact tissue samples. Metabolites 2017;7:18
10. Thakur SB, Horvat JV, Hancu I, et al. Quantitative in vivo proton MR spectroscopic assessment of lipid metabolism: Value for breast cancer diagnosis and prognosis. J Magn Reson Imaging 2019;50(1):239-49.
11. Thomas MA, Binesh N, Yue K, DeBruhl N. Volume localized two-dimensional correlated magnetic resonance spectroscopy of human breast cancer. J Magn Reson Imaging 2001; 14: 181-186.
12. Thomas MA, Wyckoff N, Yue K, Binesh N, Banakar S, Chung HK, Sayre J, DeBruhl N. Two-Dimensional MR Spectroscopic Characterization of Breast Cancer In vivo. Technol Cancer Res Treat 2005; 4(1): 99-106.
13. Lipnick S, Liu X, Sayre J, Bassett LW, Debruhl N, Thomas MA.. Combined DCE-MRI and single-voxel 2D MRS for differentiation between benign and malignant breast lesions. NMR Biomed 2010;23:922-930.
14. Joy A, Saucedo A, Joines M, Lee-Felker S, Kumar S, Sarma MK, Sayre J, DiNome M, Thomas A. Correlated MR spectroscopic imaging of breast cancer to investigate metabolites and lipids: Acceleration and compressed sensing reconstruction. BJR Open. 2022;(1):20220009.
15. Wilson NE, Burns BL, Iqbal Z, Thomas MA. Correlated spectroscopic imaging of calf muscle in three spatial dimensions using group sparse reconstruction of undersampled single and multichannel data. Magn Reson Med2015;74:1199–208.
16. Burns et al. Group sparse reconstruction of multi-dimensional spectroscopic imaging in human brain in vivo. Algorithms 2014; 7(3): 276-294. Klose U. In vivo proton spectroscopy in presence of eddy currents. Magn Reson Med 1990; 14:26-30.
Figures