3425
Clinical evaluation of k-space correlation informed motion artifact detection in segmented multi-slice MRI1Department of Radiology, Massachusetts General Hospital, Boston, MA, United States, 2Department of Radiology, Harvard Medical School, Boston, MA, United States, 3Computer Science and Artificial Intelligence Laboratory, Massachusetts Institute of Technology, Cambridge, MA, United States, 4Harvard-MIT Health Sciences and Technology, Massachusetts Institute of Technology, Cambridge, MA, United States, 5Data Science Office, Mass General Brigham, Boston, MA, United States
Synopsis
Keywords: Artifacts, Artifacts, Motion artifact, Image Quality, Neuroimaging
Motion artifacts can negatively impact diagnosis, patient experience, and radiology workflow especially when a patient recall is required. Detecting motion artifacts while the patient is still in the scanner could potentially improve workflow and reduce costs by enabling immediate corrective action. We demonstrate in a clinical k-space dataset that using cross-correlation between adjacent phase-encoding lines can detect motion artifacts directly from raw k-space in multi-shot multi-slice scans. We train a split-attention residual network to examine the performance in predicting motion artifact severity. The network is trained on simulated data and tested on real clinical data.Introduction
Motion corruption is one of the most common artifacts in magnetic resonance imaging (MRI) and affects about 15% of brain MR exams [1-2]. Detecting motion artifacts while the patient is still in the scanner could potentially improve workflow, for example by alerting technicians about artifacts, so that corrective action can be taken. We previously proposed an algorithm based on cross-correlation between adjacent phase-encoding lines to detect motion artifacts directly from raw k-space [3]. The present study extends the work by updating the algorithm and validating the approach in the clinical scans.Methods
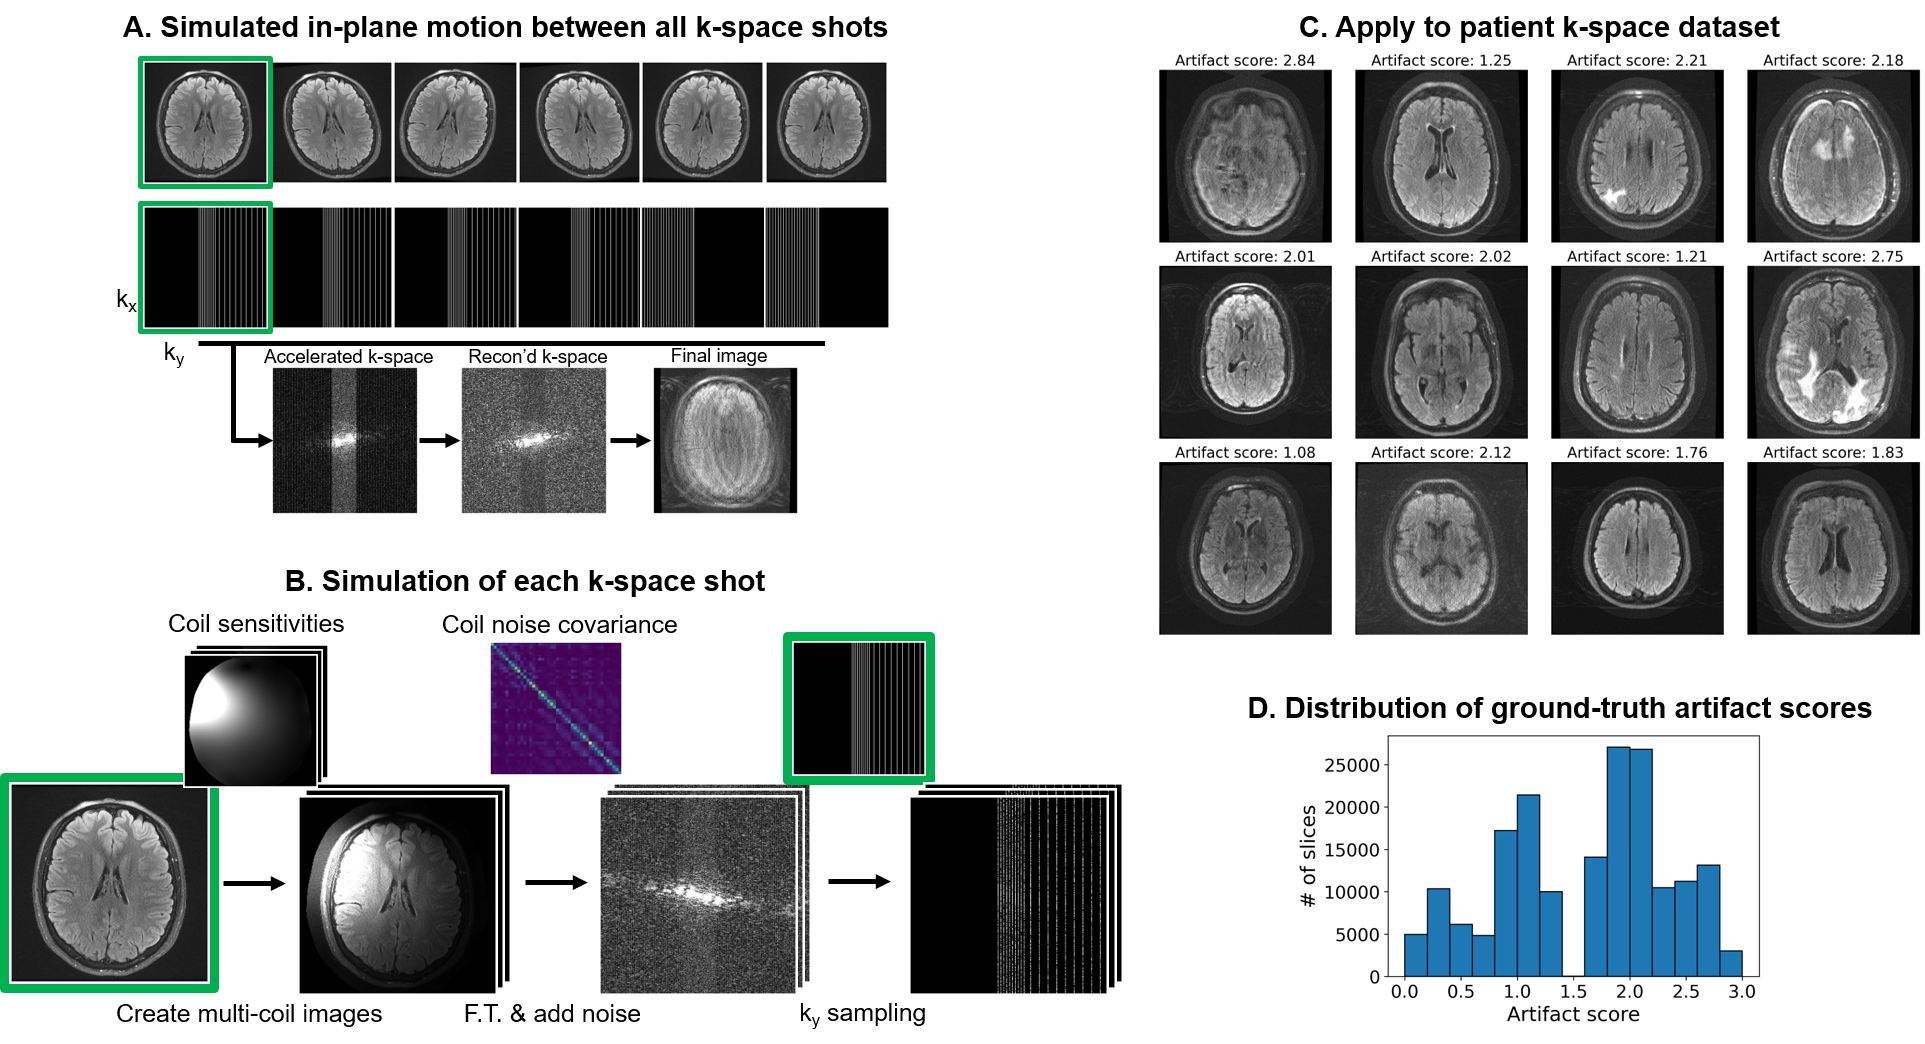
Data collection: We collected raw k-space and DICOM data from clinical (outpatient) brain MRI scans at two of our local clinics and de-identified the metadata under an approved Institutional Review Board protocol. Data was acquired using a 3T GE SIGNA Premier systems and 48-channel head coil. We demonstrate our approach using a 2D FSE multi-slice axial T2 FLAIR sequence: ARC-acceleration factor=3, #shots=6, TR=10000ms, TE=118ms, FOV=260x260mm2, acquisition matrix=[416x300], slice thickness=5mm, slice spacing=1mm. We also acquired multiple scans from one volunteer with different head positions, using the same protocol to simulate motion-corrupted scans.Motion simulation for training data generation: We simulated motion-corrupted k-space data from 208 outpatient scans as shown in Fig. 1. First, the 2D motion simulator (“2D-sim”) applied in-plane translations and rotations to image slices to simulate motion between different shots. Then, the k-space data for each shot was generated by incorporating coil sensitivity profiles estimated using ESPIRiT [4] and measured coil noise covariance (Figure 1A-B). A volunteer was scanned in 5 different head positions to generate a second realistic training dataset. We “mixed” acquired k-space segments from multiple scans of the same subject in different positions (“mix-sim”), thereby simulating data as if the subject moved between positions during a scan. Datasets: Each dataset contains k-space and motion artifact score (derived from DICOMs). The training dataset comprised 154,375 2D-sim data generated using scans of 208 patients (Figure 1C-D), the fine-tuning dataset comprised 15,625 mix-sim data generated using 5 scans of 1 volunteer, and the testing dataset consisted of 105 real data from 7 patients and 224 real data from 5 volunteers.
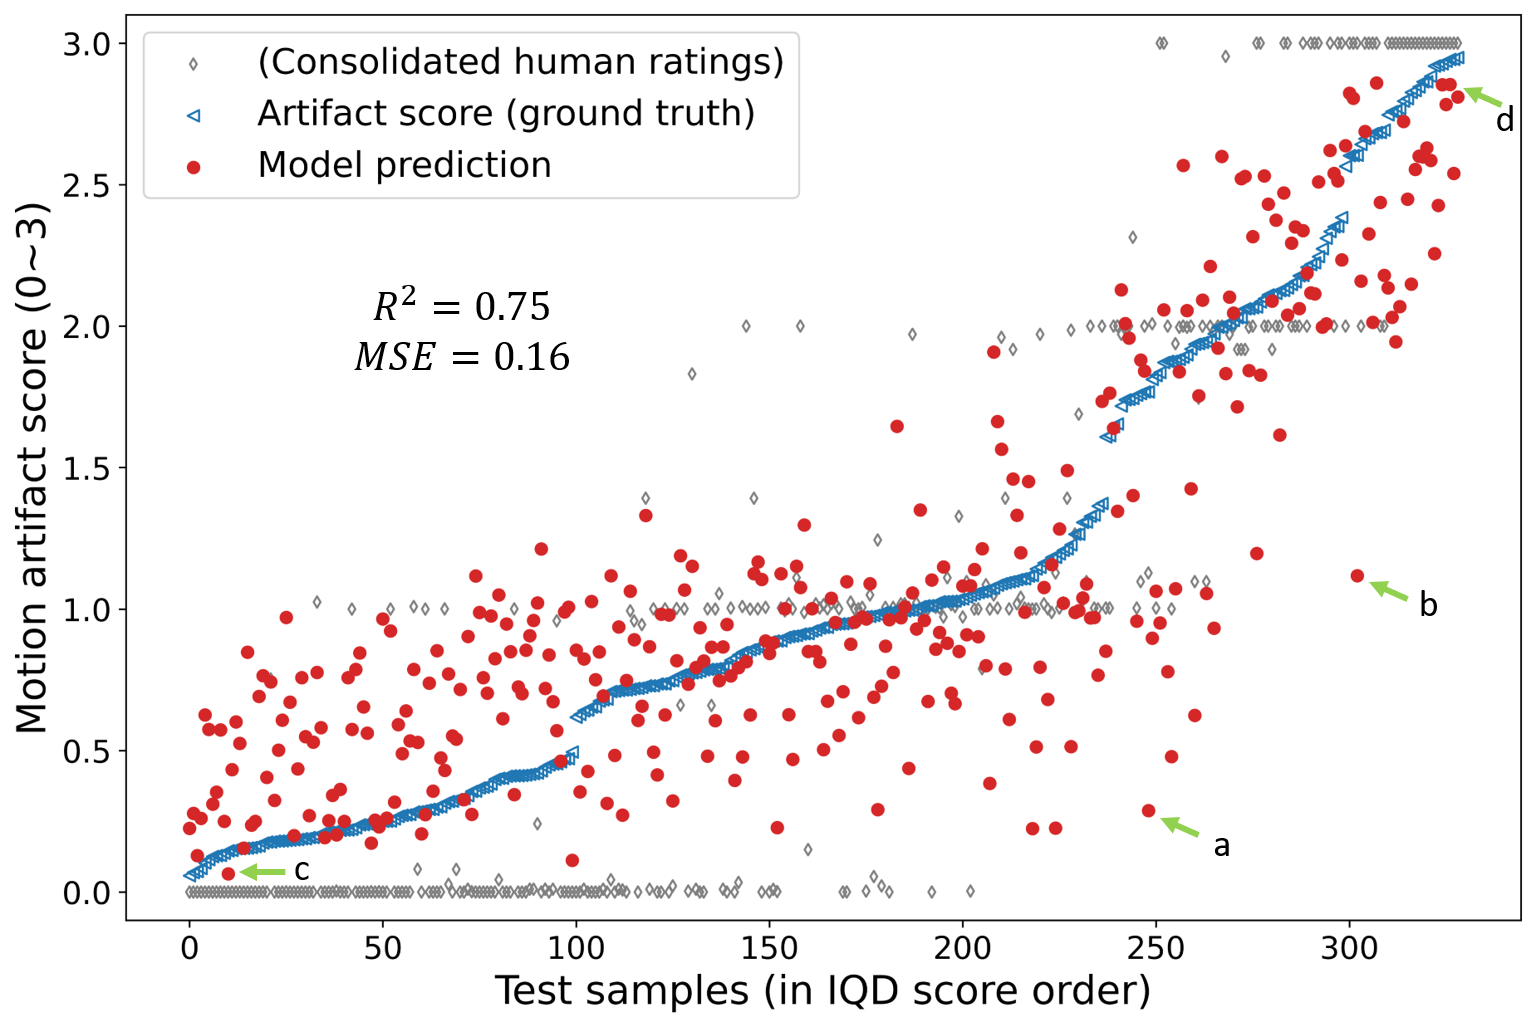
Motion artifact annotation: A total of 170,105 samples were prepared with the procedure shown in Figure 1, each corresponding to an anatomical slice. In this work, we used the Image Quality Dashboard (IQD) tool [5] to quantify artifact severity and use as ground truth in the large number of generated DICOMs. For reference, 2 neuroradiologists and 2 student raters assigned a class label (no:0, mild:1, moderate:2, severe motion:3) for each slice on the testing dataset. Ratings consolidated with an extension of the STAPLE algorithm [6-7] is shown in Figure 4.
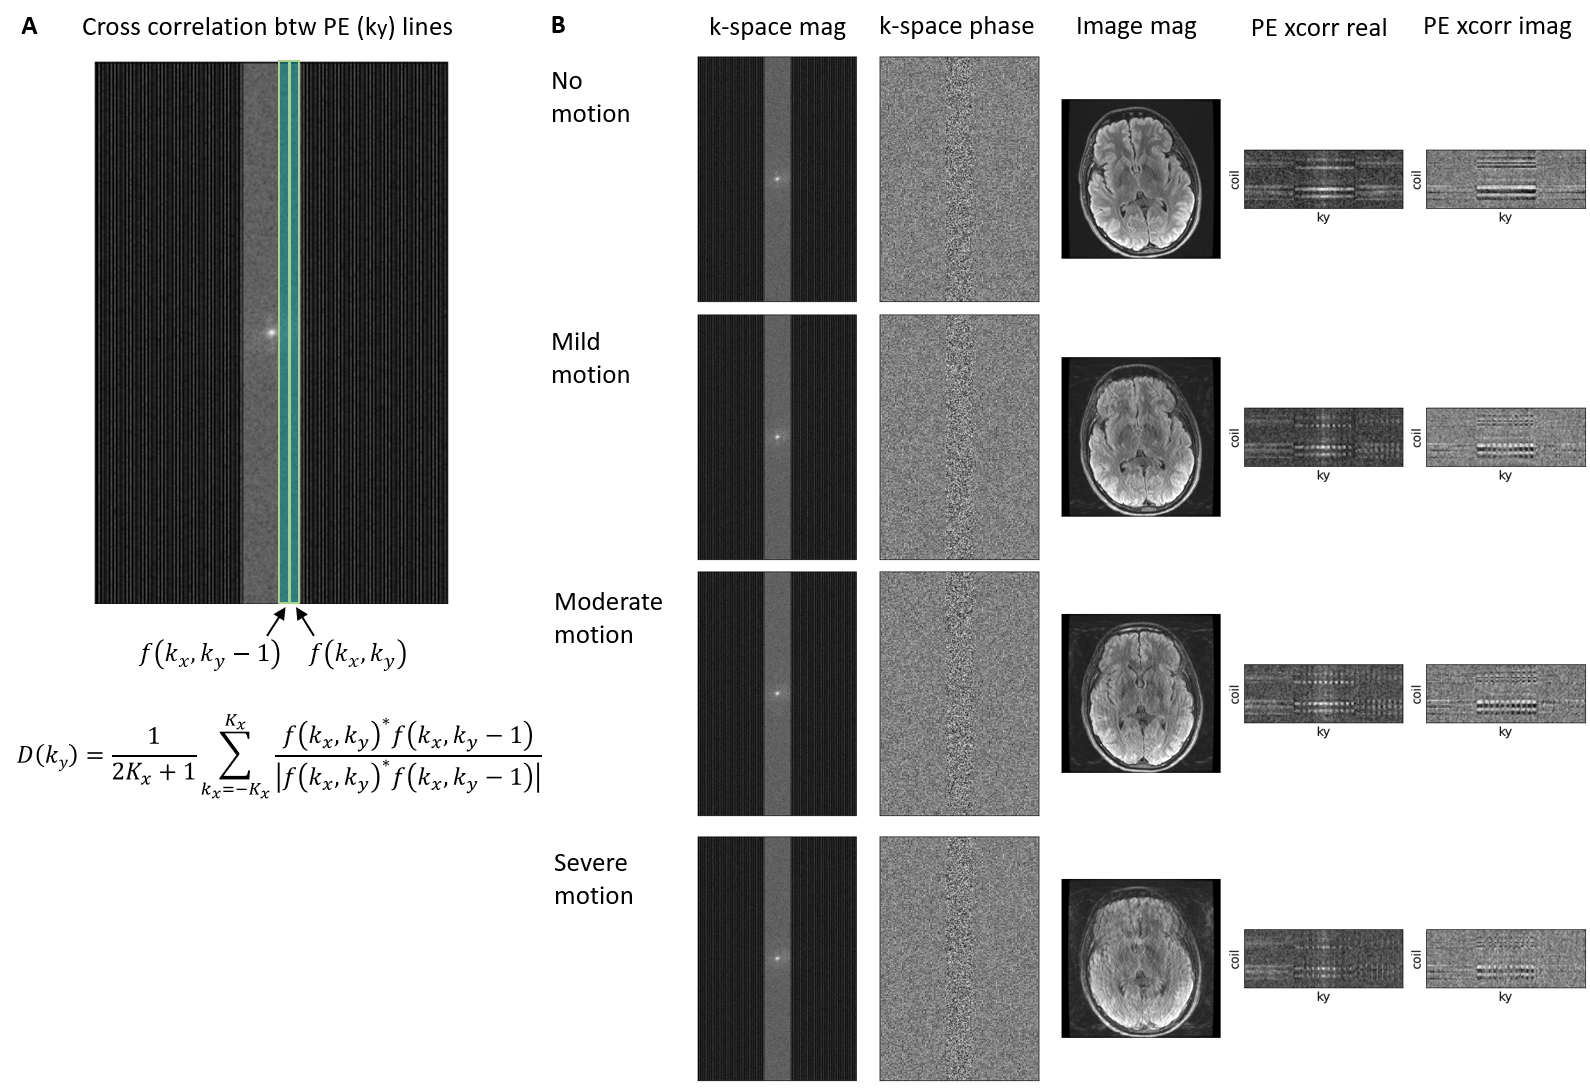
Phase encoding (PE) cross-correlation: We used PE cross-correlation (“PE xcorr”) to extract motion-related features and reduce the data dimensions. The underlying idea is to detect inconsistencies in k-space caused by motion. With the hypothesis that data in the neighboring $$$k_y$$$ phase encoding (PE) lines are similar unless motion occurs [8], we calculated the normalized cross-correlation between adjacent $$$k_y$$$ lines:
$$D(k_y)=\frac{1}{2K_x+1}\sum_{k_x=-K_x}^{K_x}\frac{f(k_x,k_y)^*f(k_x,k_y-1)}{|f(k_x,k_y)^*f(k_x,k_y-1)|},$$
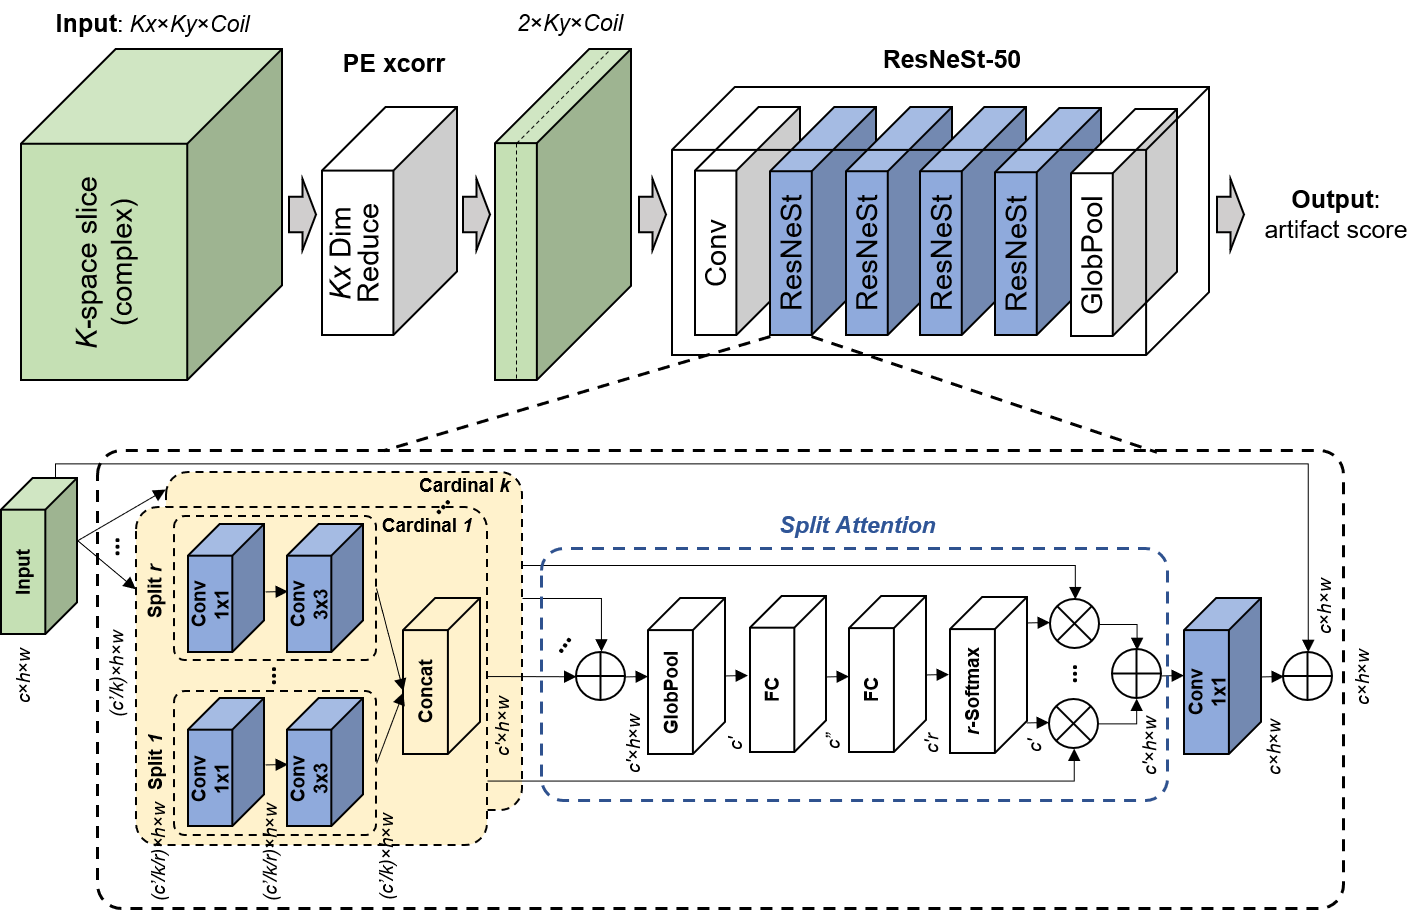
where $$$f(k_x, k_y)$$$ is 2D k-space and * is the complex conjugate (Figure 2A). We used the magnitude and phase of the PE xcorr for all available k-space lines from 44 coil channels out of 48 (4 neck channels discarded). This process eliminated the $$$k_x$$$ dimension, reducing the data dimension from 4 to 3 for each sample (e.g., 2×120x44). Examples are shown in Figure 2B.
Network training: A ResNeSt-50 split-attention network was trained from scratch to predict motion artifact severity from PE xcorr (Figure 3). This multi-path network applies channel-wise attention on different network branches to effectively capture cross-feature interactions and learn diverse representations. The architecture was modified to have two input channels (real/imaginary) and the last fully connected layer to output a single continuous number. Parameters such as kernel size, padding, and stride were modified to account for the smaller input shape. Mean squared error loss and Adam optimizer were used. The learning rate started at 0.0001 and decayed exponentially. Only the synthetic data were used for training (2D-sim) and finetuning (mix-sim) the network.
Testing: The performance of the trained model was evaluated on the testing dataset, comprising 105 real patient data and 224 real volunteer data, to examine the capability of out-of-distribution detection.
Results
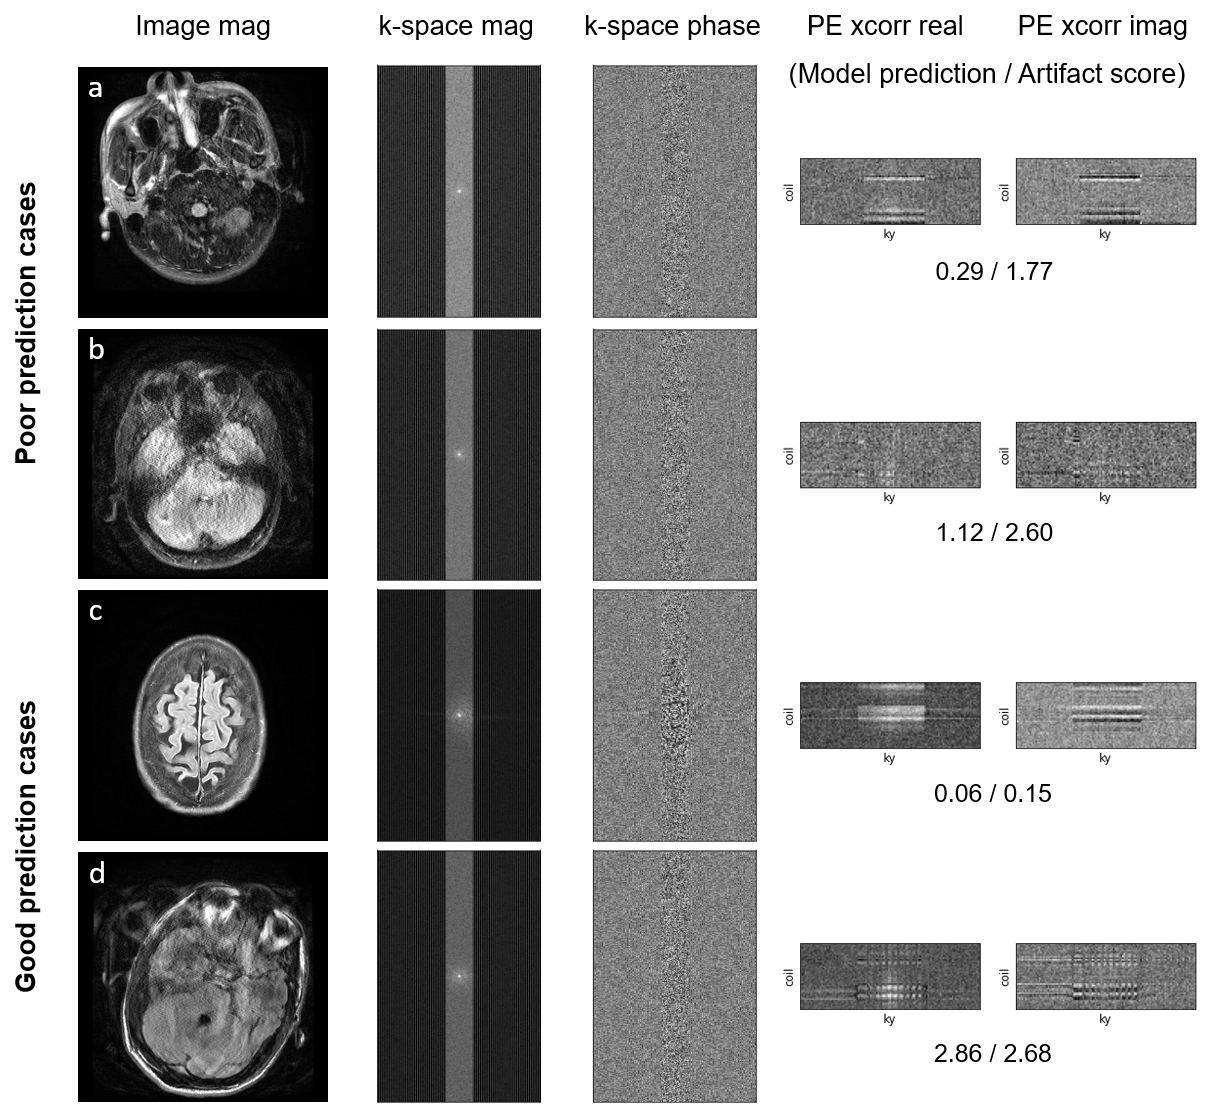
We observe that data with greater motion show signal discontinuity (spikes) across PE lines (Fig. 2B). The test set showed MSE of 0.16 and $$$R^2$$$ of 0.75 (Fig. 4). Performance analysis of specific cases is shown in Figure 5.Discussion
The proposed procedure shows competitive performance to detect motion artifacts in k-space of multi-shot multi-slice scans. The method is particularly sensitive to images with severe motion artifacts. Low SNR of PE xcorr and little-to-no brain tissue appear to be associated with poor prediction. The performance could be improved with more diverse training data [9]. Future studies will validate the model on various head coils, contrasts, and k-space sampling/dimension. Also, pairwise comparison could be used to rate artifact level for improved interrater reliability [10].Conclusion
The proposed methods for motion artifact detection in MRI could help improve image quality, reduce patient recall, and enhance radiology workflow.Acknowledgements
The authors appreciate valuable input and feedback from Eugene Milshteyn, Arnaud Guidon, Dan Rettmann, Suchandrima Banerjee, and Anja Brau from GE Healthcare. We are grateful for support for this research which was provided by GE Healthcare and the National Institutes of Health (U01MH117023, K99 HD101553, R01 MH123195, R01EB023281, R01EB006758, R21EB018907, R01EB019956, P41EB030006, R56AG064027, R01AG008122, R01AG016495, 1RF1MH123195, R01MH123195, R01MH121885, R01NS052585, R21NS072652, R01NS070963, R01NS083534, U01NS086625, U24NS10059103, R01NS105820, 1S10RR023401, 1S10RR019307, 1S10RR023043, 5U01-MH093765).References
1. Andre JB, Bresnahan BW, Mossa-Basha M, et al. Toward quantifying the prevalence, severity, and cost associated with patient motion during clinical MR examinations. Journal of the American College of Radiology. 2015;12(7):689-95.
2. Gedamu EL, Gedamu A. Subject movement during multislice interleaved MR acquisitions: prevalence and potential effect on MRI‐derived brain pathology measurements and multicenter clinical trials of therapeutics for multiple sclerosis. Journal of magnetic resonance imaging. 2012;36(2):332-43. 3. Jang I, Frost RS, Hoffmann M, et al. Automated MRI k-space Motion Artifact Detection in Segmented Multi-Slice Sequences. International Society for Magnetic Resonance in Medicine. 2022;5015.
4. Uecker M, Lai P, Murphy MJ, et al. ESPIRiT—an eigenvalue approach to autocalibrating parallel MRI: where SENSE meets GRAPPA. Magnetic resonance in medicine. 2014;71(3):990-1001.
5. Bizzo CB, Wu D, Wright B, et al. Machine learning model for motion detection and quantification on brain MR: A multicenter testing study. Radiological Society of North America 2021.
6. Warfield SK, Zou KH, Wells WM. Simultaneous truth and performance level estimation (STAPLE): an algorithm for the validation of image segmentation. IEEE transactions on medical imaging. 2004 Jul 6;23(7):903-21.
7. Balbastre Y, Frost R, Morparia K, Carrington RL, et al. Consolidation of expert ratings of motion artifacts using hierarchical label fusion. Submitted to ISMRM 2023
8. Mendes J & Parker DL. Intrinsic detection of motion in segmented sequences. Magnetic resonance in medicine. 2011;65(4):1084-9.
9. Hoffmann M, Billot B, Greve DN, et al. SynthMorph: learning contrast-invariant registration without acquired images. IEEE transactions on medical imaging. 2021 Sep 29;41(3):543-58.
10. Jang I, Danley G, Chang K, Kalpathy-Cramer J. Decreasing Annotation Burden of Pairwise Comparisons with Human-in-the-Loop Sorting: Application in Medical Image Artifact Rating. arXiv preprint arXiv:2202.04823. 2022 Feb 10.
Figures