3424
Predicting MR Image Quality from Breathing Patterns1Electrical Engineering, Stanford University, Stanford, CA, United States
Synopsis
Keywords: Artifacts, Motion Correction, abdomen, respiration
Motion, particularly from breathing, compromises the quality of magnetic resonance images. In this work, we hypothesize that detected breathing patterns can be utilized to predict whether adequate MR image quality will be obtained. With a K-means clustering algorithm, 9 in 10 forty-second breathing waveforms were correctly predicted as either resulting in a high or low image quality image; this finding can save time from unnecessary scans. Other models achieved similar results as K-means clusterings.
Introduction
Respiratory motion compromises images. Non-Cartesian scanning [1] and intrinsic navigation [2] somewhat mitigate this problem. Little work has focused on predicting image quality, mostly on voluntary head movement [3].Prior work characterized respiration for sedation monitoring [4] or radiotherapy tailoring [5, 6], and influencing respiratory motion [7]. [8] characterized breathing pattern and restricted data acquisition to portions of the respiratory cycle. However, limited work has explored modern machine learning methods to characterize breathing patterns [9].
We hypothesize that detected breathing patterns can be utilized to predict image quality; the predictions then trigger decisions to repeat scans, coach patients, choose alternative sequences, or omit scans to save time.
Methods
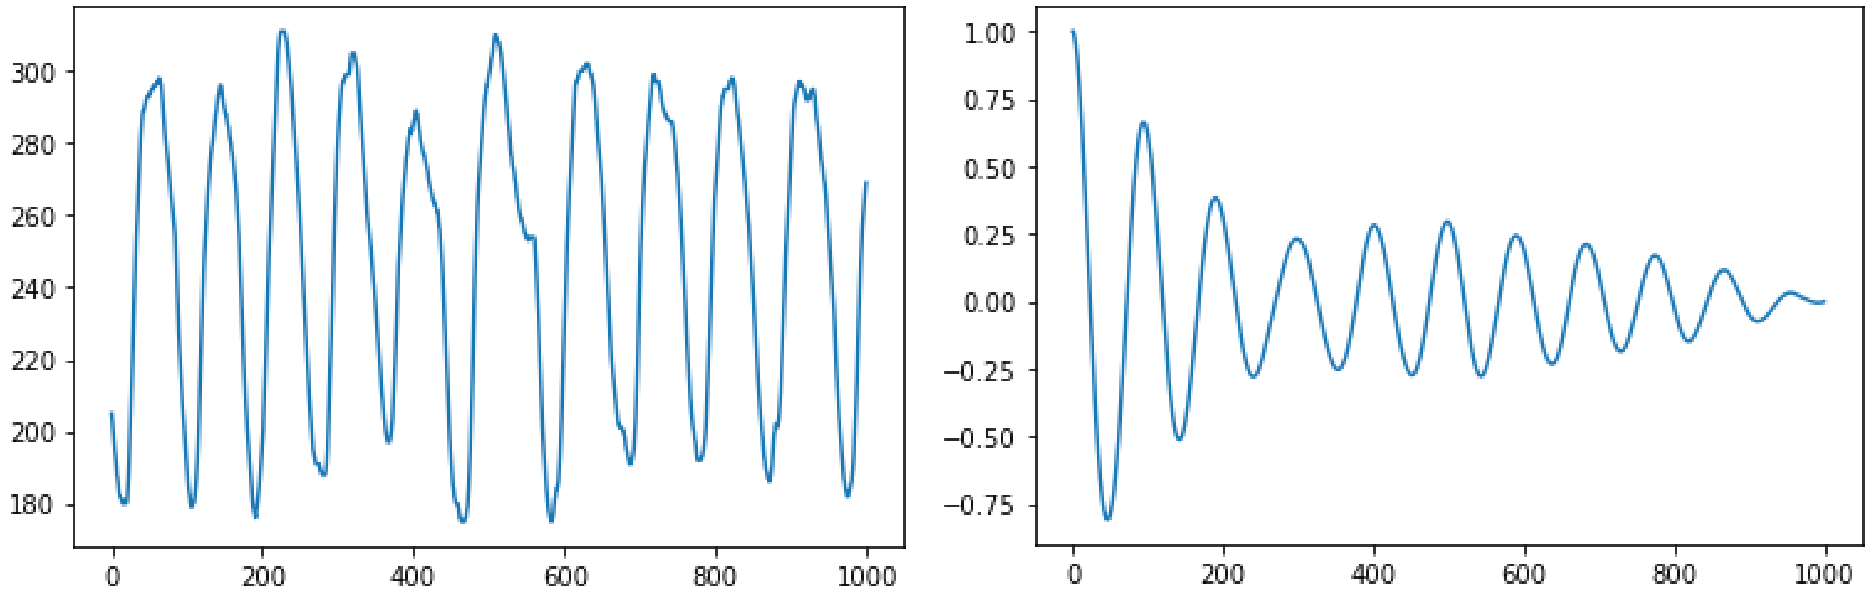
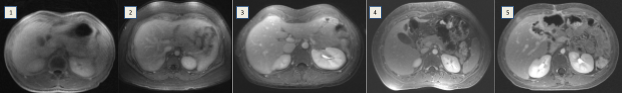
Post-contrast motion-robust cones fat-suppressed SPGR with golden angle ordering [10] abdominal scans over an eighteen-month period were retrospectively identified with IRB approval and waived consent. Slice thickness and field-of-view were adjusted to patient size. 125 kHz bandwidth and 15° flip angle were utilized. Image reconstruction consisted of gridding and Fourier transform.Corresponding breathing waveforms with 40 ms sampling rate from respiratory bellows were curated (Fig. 1, left). For a 61 waveform subset, a board-certified radiologist scored resulting image quality (Fig. 2), with scores of 4/5 deemed diagnostically adequate. The remaining 675 waveforms were unlabeled.
To sample the unlabeled set of respiratory waveforms, ten segments of equal length were randomly extracted from each respiratory waveform. To sample the labeled waveforms, one segment of each waveform was randomly extracted. The total of these extractions compose two groups of waveforms: labeled and unlabeled waveforms. These two groups of labeled and unlabeled respiratory waveforms were resampled at varying segment lengths in different trials. Thus, there was a labeled and unlabeled pair of groups of waveforms for each segment length.
K-means clustering was performed on the raw unlabeled waveform group (k=2-16). Clustering was performed twice: (i) with raw unlabeled waveforms, and (ii) on the autocorrelation of the waveforms (Fig. 1, right). With the exception of a singular datapoint withheld for testing, the assigned cluster of the remaining labeled data points were tabulated; the majority label determined the overall cluster label (low quality or high quality). The resulting labeled cluster model was then used to predict the image quality of the withheld data point. This process was repeated for each labeled datapoint being withheld, enabling calculation of specificity, sensitivity, and accuracy. Clustering was also performed on the unlabeled waveform group but autocorrelation (Fig. 1, right) preprocessing was used. Segment length varied from 250-2000 datapoints, with intervals of 250. Best accuracy was taken from the highest performing cluster.
The clustering method was run for 100 trials, except instead of using all 675 unlabeled datapoints in each trial, 300 randomly selected out of the 675 waveforms were used instead to prevent overfitting. Error bars are the standard deviation for that given number of clusters. The distribution of these hundred trials shows the hundred trials.
An RBF kernel support vector classifier was trained on 60% of the labeled waveforms, saving 40% for testing. The labeled waveforms were preprocessed via a two-dimensional PCA. A linear kernel was also used, and was trained on all of the labeled waveforms. RBF parameters were varied to determine their effect on accuracy. Precision/recall were calculated from test results. 2,000 trials were conducted for the RBF kernel. SciPy and scikit-learn libraries were used [11].
Results
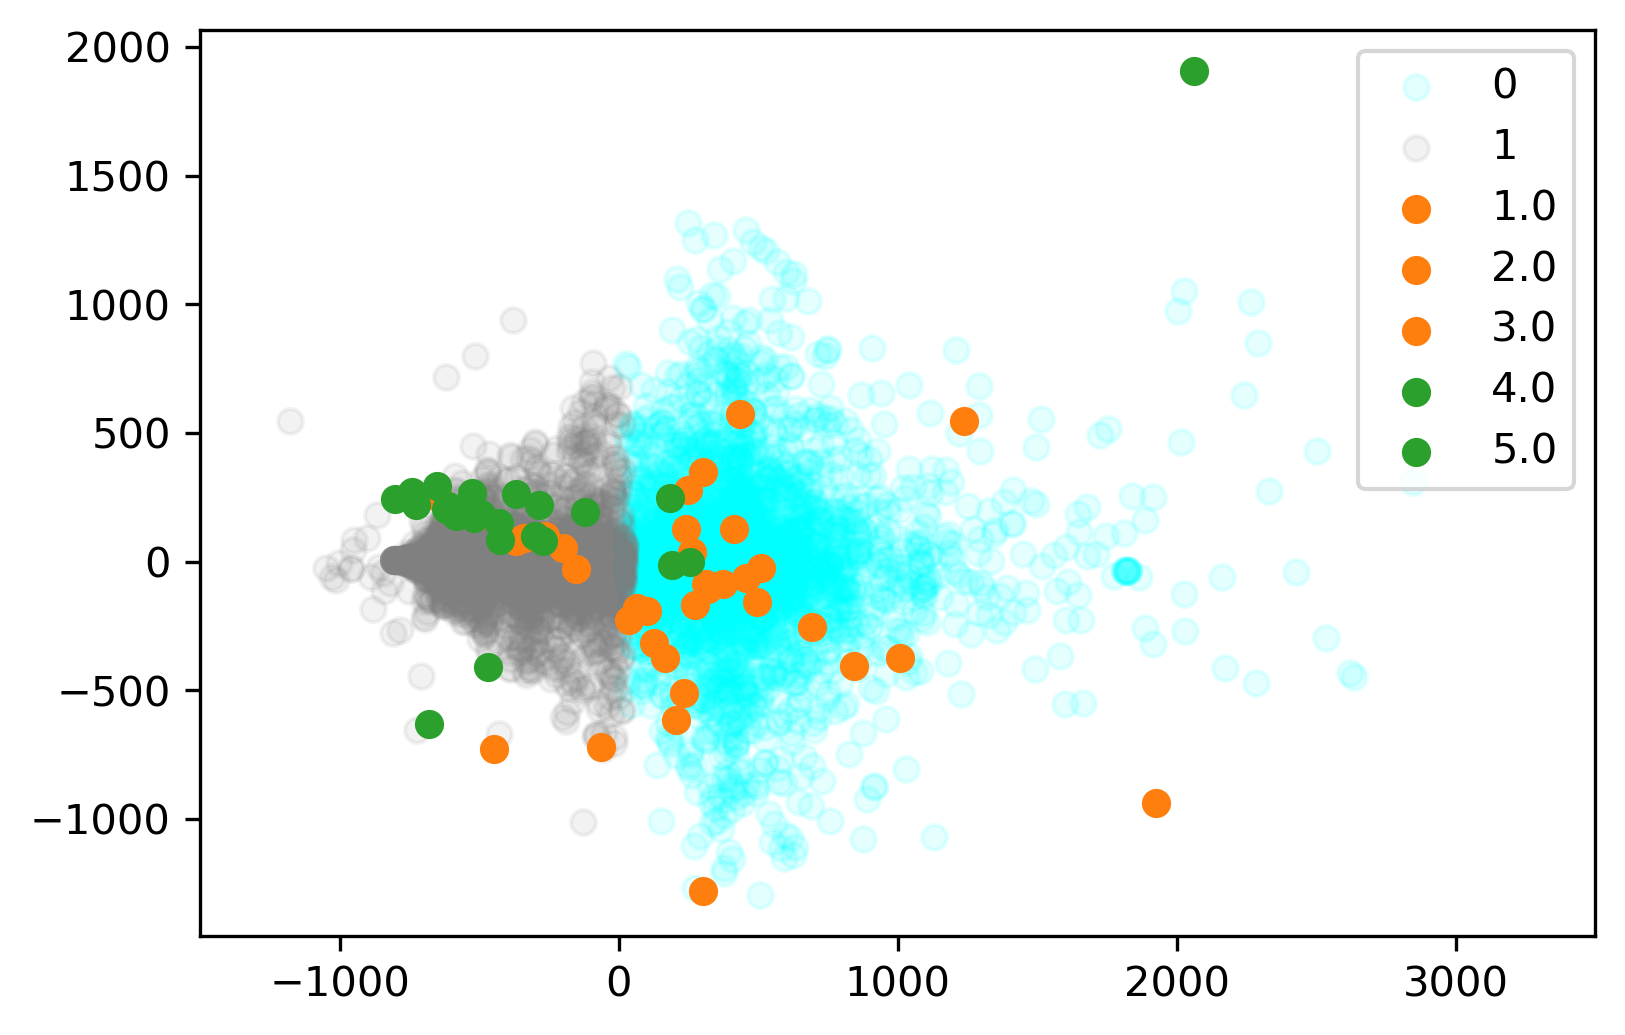
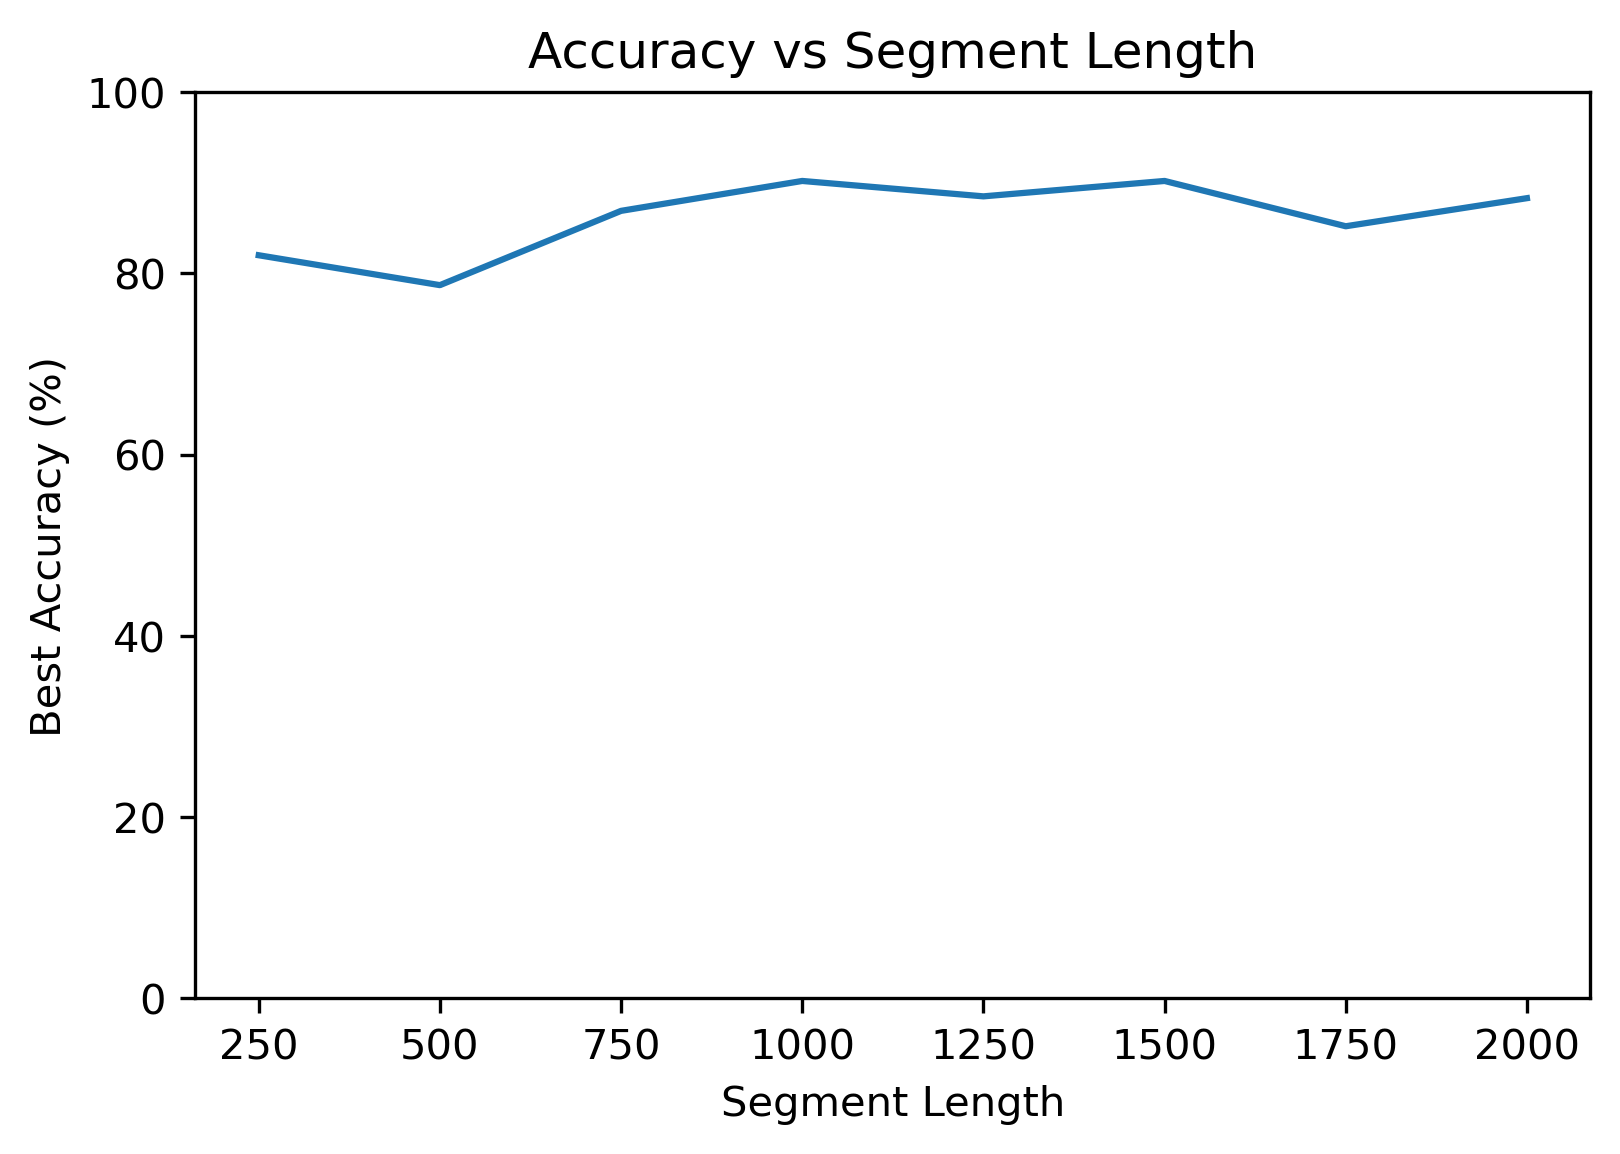
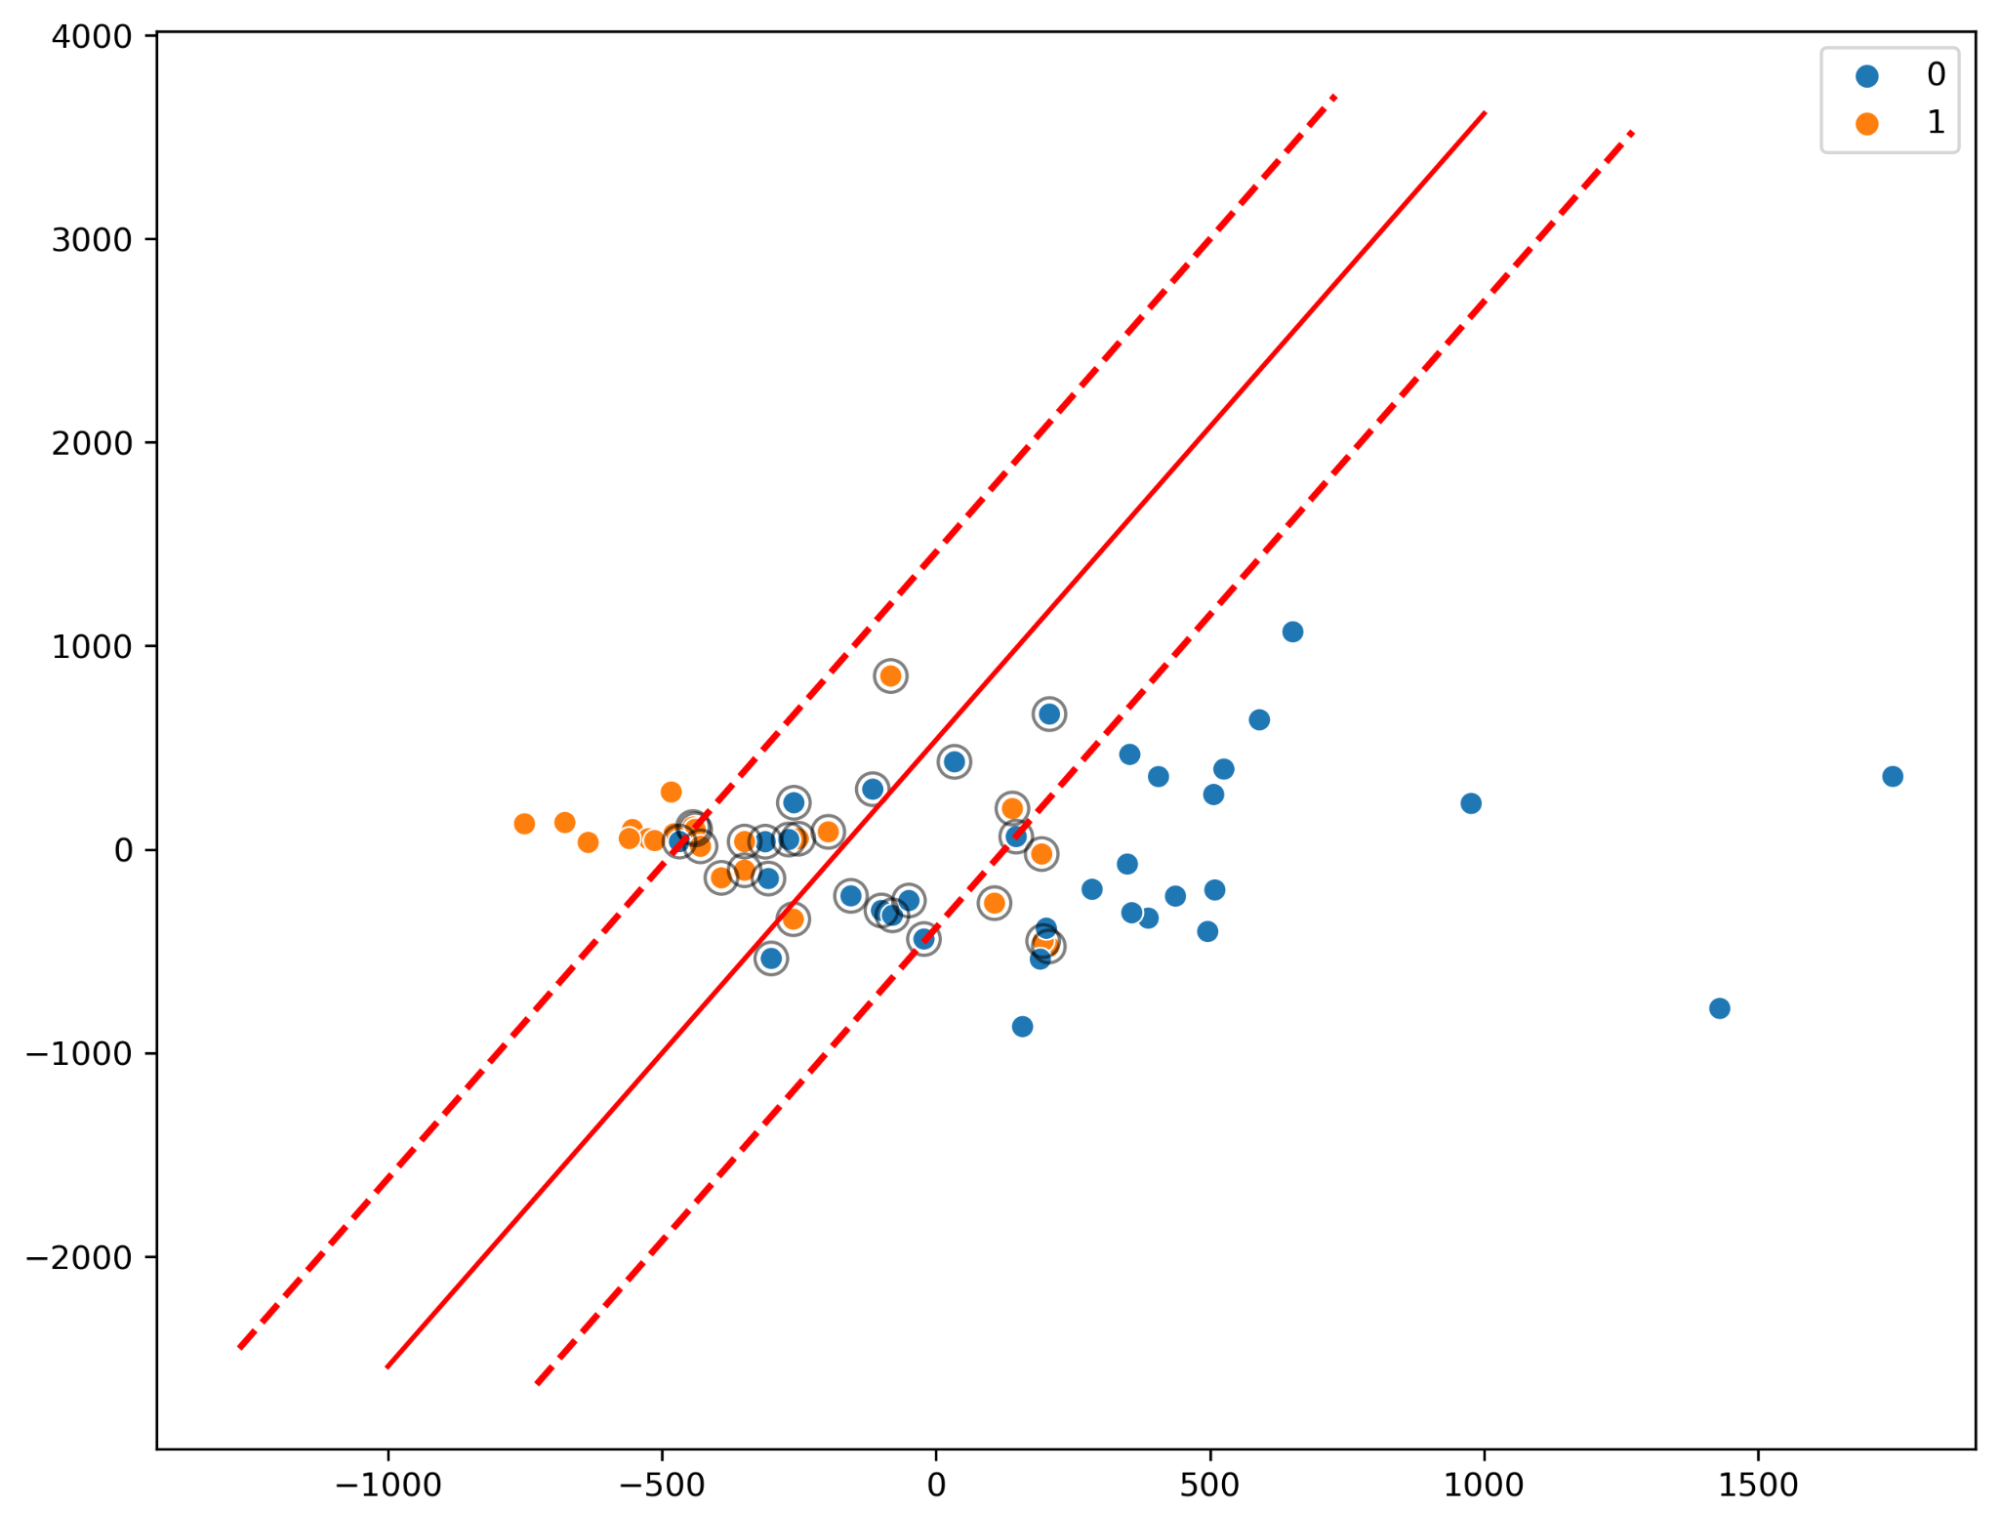
With K-means clustering (Fig. 3), note the separability of the high and low quality labeled waveforms and that the separation of unlabeled data mirrors the separation of high/low quality labeled waveforms, indicating that breathing waveforms corresponding to high/low quality images exhibit differences on average.Prediction accuracy minimally depended on segment length (Fig. 4). 1000-datapoint waveforms achieved approximately 90% accuracy. Beyond 1000 datapoints, accuracy does not improve. As datapoints are separated by 40ms, 40 seconds of breathing waveform sampling suffices.
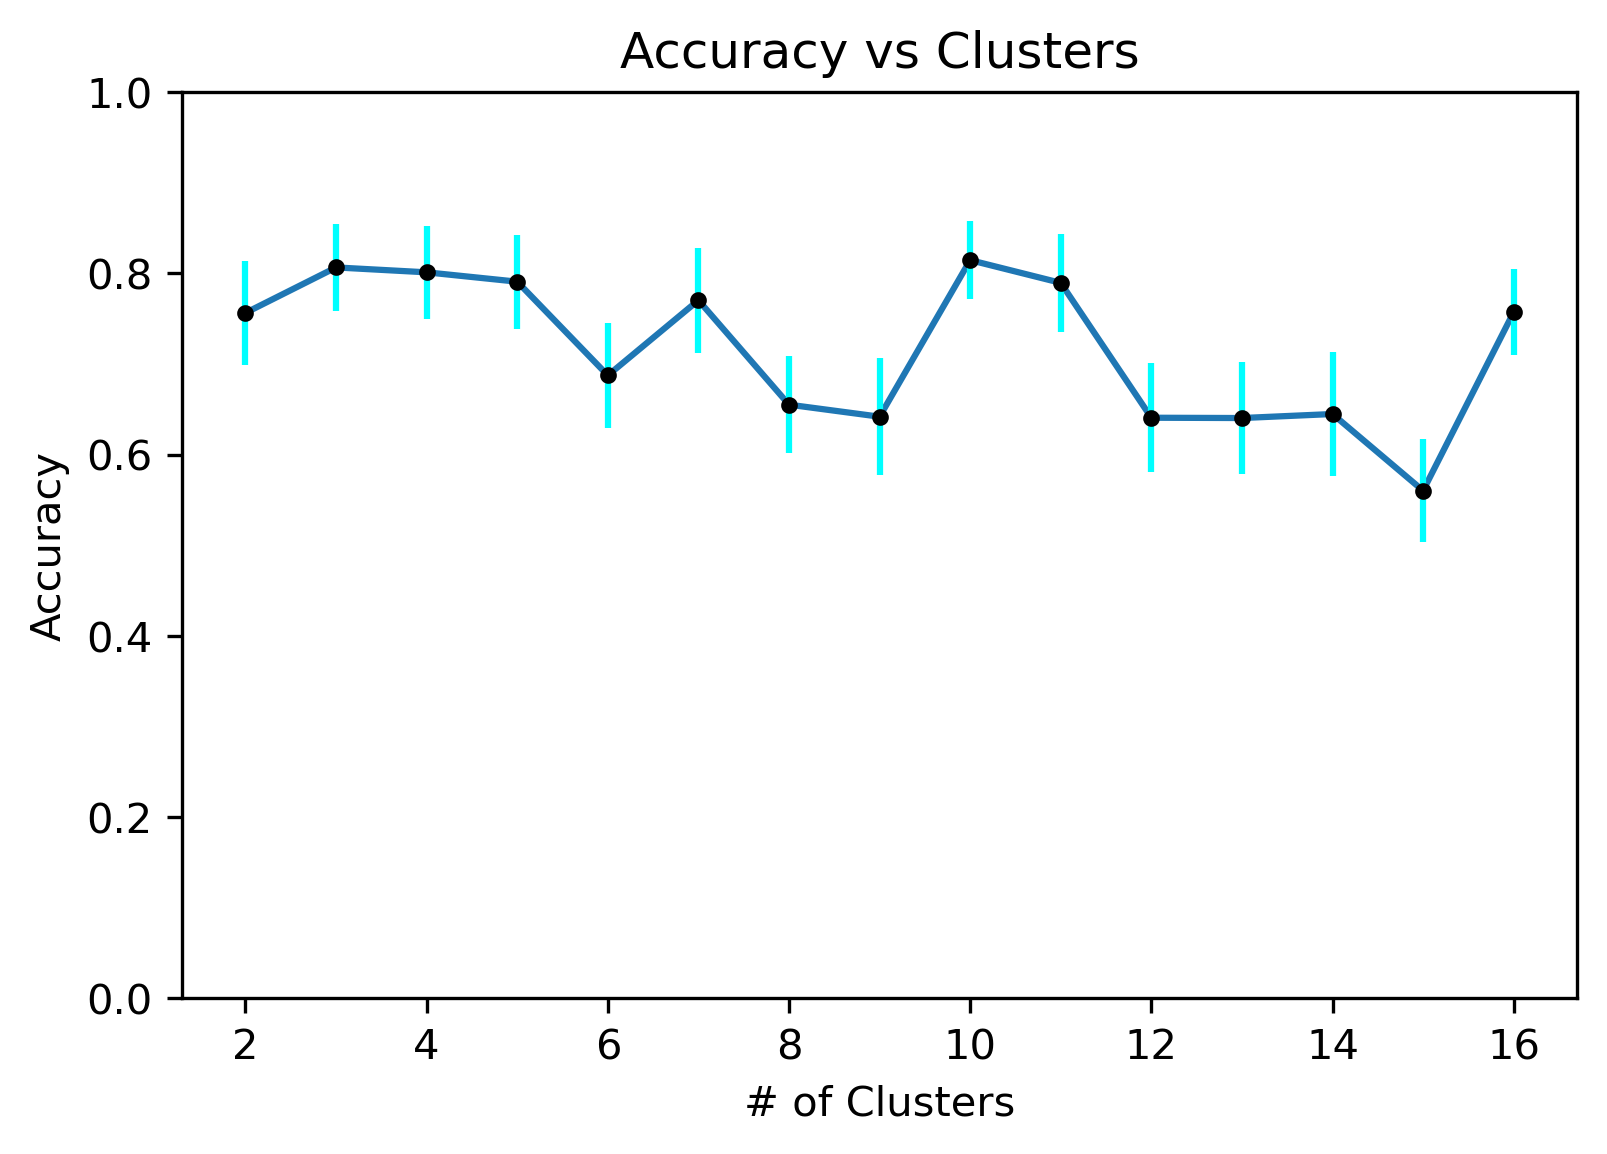
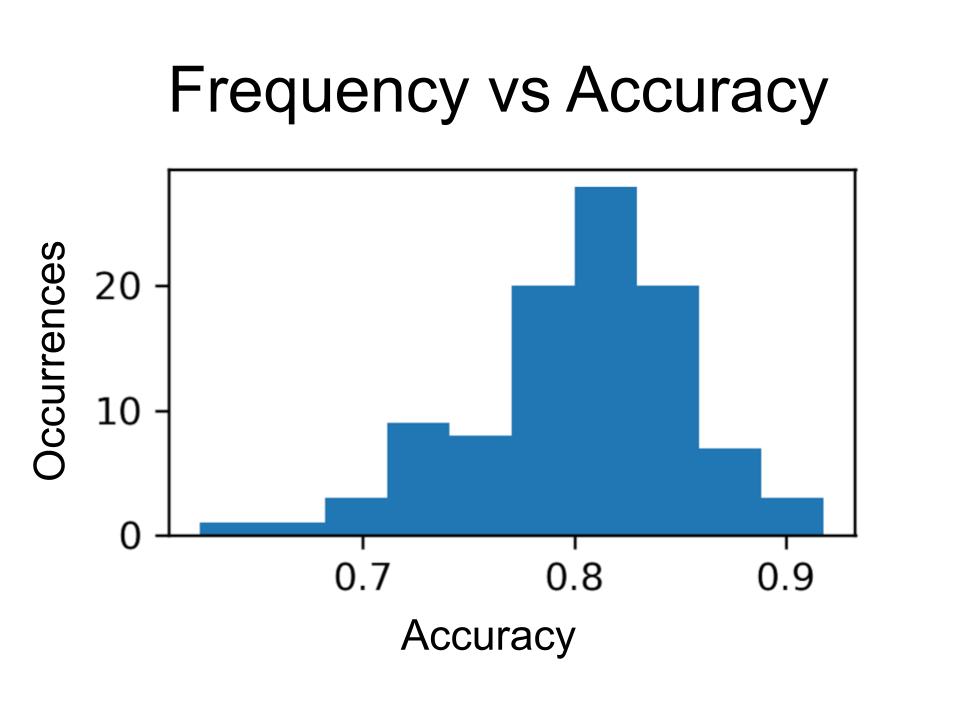
Ten clusters provided optimal accuracy (Fig. 5), though improvement over a simpler three-cluster model was minimal. In this experiment, segment length of 1000 points was used, as it was a relative maximum of the graph in Fig. 4. Model performance is relatively repeatable, with narrow error bars. As a representative example, the four-cluster models’ performance distribution are shown in Fig. 6.
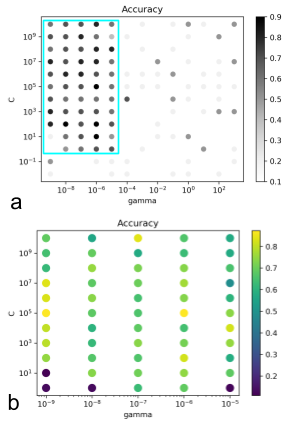
SVM was also qualitatively compared to the clustering algorithm. The unsupervised clustering algorithm was trained on the unlabeled dataset leaving the labeled dataset for testing purposes, whereas the supervised SVM required the labeled data only. Fig. 7 indicates that the SVM with a linear kernel can achieve good classification; equivalent accuracy was obtained compared to a 2-cluster model (Fig. 3). Finally, optimization of the RBF’s (nonlinear kernel) C and gamma values demonstrated that decision boundary with less curvature had higher performance (Fig. 8).
Discussion
Image quality prediction from respiratory pattern is feasible. As only a short respiratory waveform segment is required, scans can be aborted early with 90% accuracy. Since waveforms can be collected prior to scanning, the clustering model enables accurate image quality prediction before scanning.It remains unclear whether a high-performing model tested on the 61 labels will continue to perform equally high in a clinical setting. Future work will focus on other sequences.
Acknowledgements
No acknowledgement found.References
1. Zhang Y, Kashani R, Cao Y, Lawrence TS, Johansson A, Balter JM.. A hierarchical model of abdominal configuration changes extracted from golden angle radial magnetic resonance imaging. Phys Med Biol. 2021 Feb 9;66(4):045018. doi: 10.1088/1361-6560/abd66e. PMID: 33361579
2. Liu L, Johansson A, Cao Y, Lawrence TS, Balter JM. Volumetric prediction of breathing and slow drifting motion in the abdomen using radial MRI and multi-temporal resolution modeling. Phys Med Biol. 2021 Sep 3;66(17):10.1088/1361-6560/ac1f37. doi: 10.1088/1361-6560/ac1f37. PMID: 34412047
3. Wallace TE, Afacan O, Jaimes C, Rispoli J, Pelkola K, Dugan M, Kober T, Warfield SK. Free induction decay navigator motion metrics for prediction of diagnostic image quality in pediatric MRI. Magn Reson Med. 2021 Jun;85(6):3169-3181. doi: 10.1002/mrm.28649. Epub 2021 Jan 6. PMID: 33404086
4. Caldiroli D, Minati L. Early experience with remote pressure sensor respiratory plethysmography monitoring sedation in the MR scanner. Eur J Anaesthesiol. 2007 Sep;24(9):761-9. doi: 10.1017/S0265021507000312. Epub 2007 May 22. PMID: 17517150
5. Cai J, Read PW, Sheng K. The effect of respiratory motion variability and tumor size on the accuracy of average intensity projection from four-dimensional computed tomography: an investigation based on dynamic MRI. Med Phys. 2008 Nov;35(11):4974-81. doi: 10.1118/1.2982245. PMID: 19070231
6. Ostyn M, Weiss E, Rosu-Bubulac M. Respiratory cycle characterization and optimization of amplitude-based gating parameters for prone and supine lung cancer patients. Biomed Phys Eng Express. 2020 Mar 4;6(3):035002. doi: 10.1088/2057-1976/ab779d. PMID: 33438647
7. To DT, Kim JP, Price RG, Chetty IJ, Glide-Hurst CK. Impact of incorporating visual biofeedback in 4D MRI. J Appl Clin Med Phys. 2016 May 8;17(3):128-137. doi: 10.1120/jacmp.v17i3.6017. PMID: 27167270
8. Sinkus R, Börnert P. Motion pattern adapted real-time respiratory gating. Magn Reson Med. 1999 Jan;41(1):148-55. doi: 10.1002/(sici)1522-2594(199901)41:1<148::aid-mrm21>3.0.co;2-g. PMID: 10025623
9. Nallanthighal VS, Mostaani Z, Härmä A, Strik H, Magimai-Doss M. Deep learning architectures for estimating breathing signal and respiratory parameters from speech recordings. Neural Netw. 2021 Sep;141:211-224. doi: 10.1016/j.neunet.2021.03.029. Epub 2021 Apr 5. PMID: 33915446
10. Zucker EJ, Cheng JY, Haldipur A, Carl M, Vasanawala SS. Free-breathing pediatric chest MRI: Performance of self-navigated golden-angle ordered conical ultrashort echo time acquisition J Magn Reson Imaging, 2018 Jan;47(1):200-209. doi: 10.1002/jmri.25776. PMID: 28570032
11. Scikit-learn: Machine Learning in Python, Pedregosa et al., JMLR 12, pp. 2825-2830, 2011.
Figures