3411
Independent Component Analysis for Noise Removal in MR Fingerprinting1Centre for Medical Image Computing, Department of Medical Physics and Biomedical Engineering, University College London, London, United Kingdom, 2UCL Queen Square Institute of Neurology, Faculty of Brain Sciences, London, United Kingdom, 3NMR Research Unit, Queen Square MS Centre, Department of Neuroinflammation, London, United Kingdom, 4Department of Brain & Behavioural Sciences, University of Pavia, Pavia, Italy, 5Brain Connectivity Centre Research Department, IRCCS Mondino Foundation, Pavia, Italy, 6NMR Research Unit, Queen Square MS Centre, Department of Neuroinflammation, UCL Queen Square Institute of Neurology, Faculty of Brain Sciences, London, United Kingdom, 7Bioxydyn Limited, Manchester, United Kingdom
Synopsis
Keywords: Artifacts, MR Fingerprinting
We propose the use of independent component analysis for the removal of coherent noise sources prior to matching for magnetic resonance fingerprinting (MRF). We tested this technique for the removal of reconstruction artefacts on images acquired with a spiral k-space acquisition to quantify intravascular T1, extravascular T1, B1+, cerebral blood volume (νb) and inter-vascular water exchange (1/τb). We demonstrate that removal of coherent noise sources in this way can improve the precision of measurements of parameters.Introduction
Magentic Resonance Fingerprinting (MRF) matching is largely insensitive to incoherent noise1; unaccounted coherent components e.g. flow/heartbeat/sampling artefacts, have the potential to greatly disrupt matching success, particularly when attempting to match signals with small variation. If the components of interest could be isolated and the unwanted components removed, MRF matching accuracy and precision could be improved. Independent Component Analysis (ICA) is a technique that allows for the decomposition of a mixed signal into separate underlying components. We propose using temporal ICA to identify noise components in MRF data and to remove them prior to matching. We test our method on voxel-wise quantification of blood volume (νb) and BBB water exchange (by quantifying capillary water residence time, $$$\tau_b$$$), along with intra and extra vascular T1 ($$$T_{1,e},T_{1,b}$$$), as a metric of BBB function, using MRF1.Methods
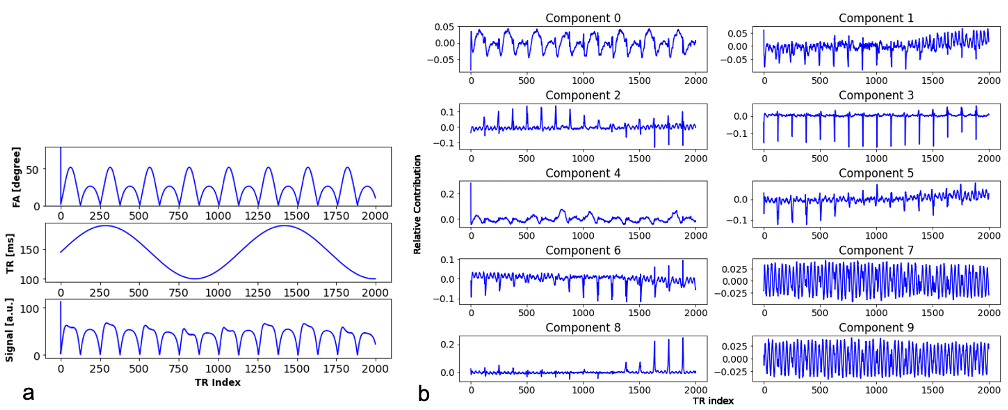
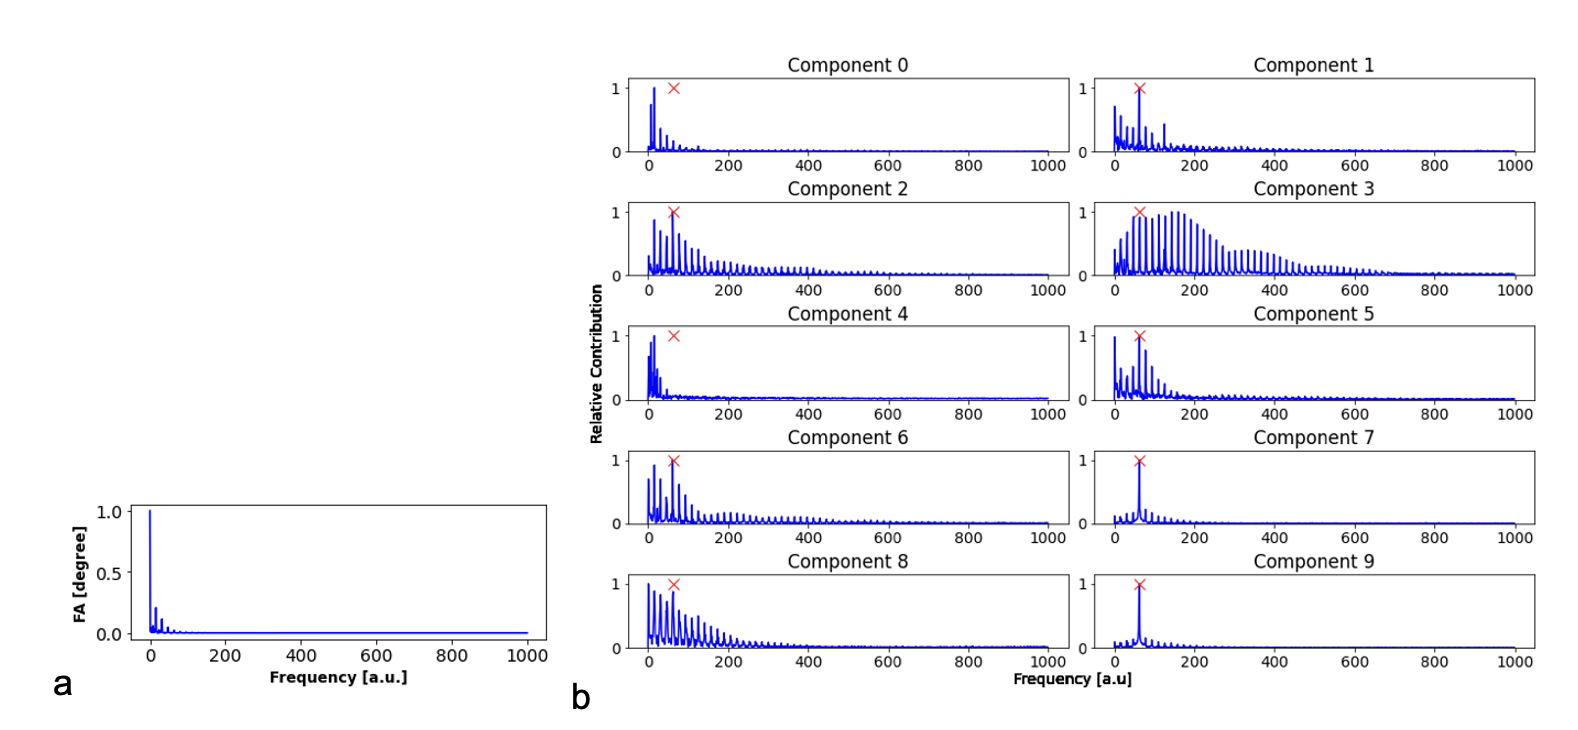
Seven healthy volunteers (23-30 years old, 4 male) were scanned on a 3 T Philips Ingenia system using a T1-fast field echo (T1-FFE) acquisition with an MRF sequence of 2000 $$$TR$$$ periods with a spiral acquisition (quadratic variable spiral density, readout time=8.85ms, FOV=224x244 mm, reconstruction matrix=64x64, gridding using Kaiser-Bessel interpolation kernel). A single axial slice was acquired, then segmented and masked using $$$T_1$$$-w and $$$T_2$$$-w images.2,3,4 Each MRF time-series image was flattened to create a 1-dimensional array of time courses. The flip angle and $$$TR$$$ variation used to generate these signals can be seen in Figure 1a alongside an example simulated time course. Fast ICA6 was performed with 10 components: an example of these extracted components can be seen Figure 1b. Each component was fast-Fourier transformed to provide its pseudo frequency spectrum. The Fourier transforms for the simulated signal and each component can be seen in Figure 2.Reconstruction artefacts associated with spiral sampling can lead to structured noise. As these are a consequence of the spiral acquisition and k-space sampling/regridding, we can isolate the expected frequency of these artefacts. We target components with a spectral peak at this frequency for removal. An additional criterion was added to ensure that no components of interest were removed: using the simulation signals, Figure1a, we can identify the prominent spectral peaks expected within the experimental signals, Figure 2a, and make sure that no components with these peaks are removed. Providing that a matching peak associated with the artefacts and no significant peaks associated with the expected signals are present, the weights of these components can then be nulled, and an inverse ICA transformation performed to reconstruct a ‘noise-free’ image.
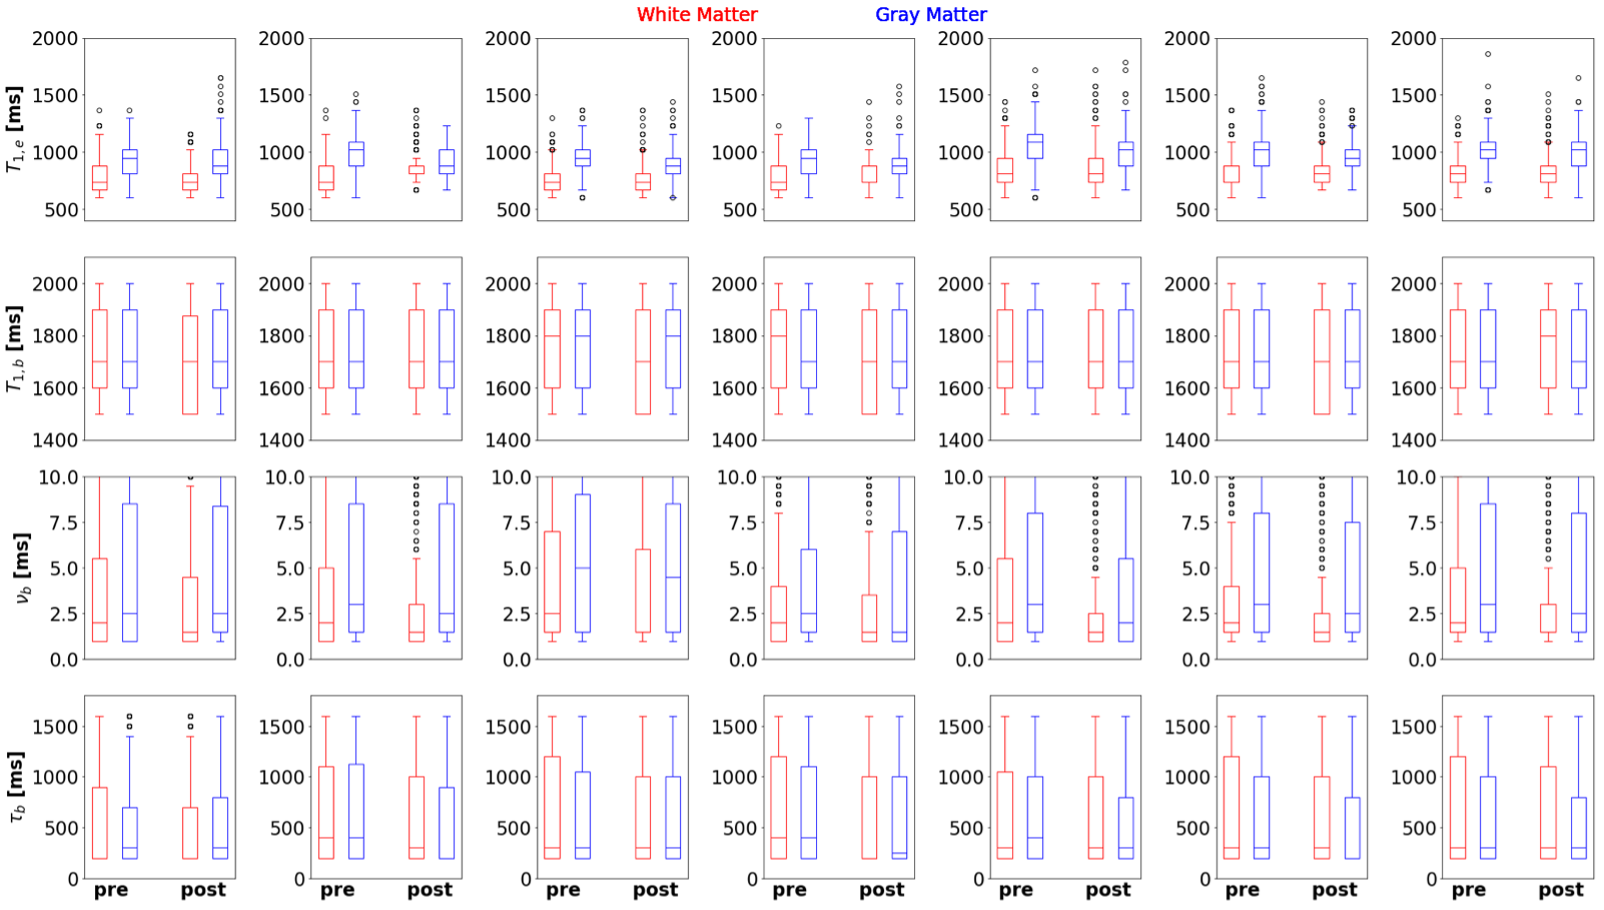
The reconstructed, post-noise removal, images were then matched to a dictionary with a variation of blood volume from 1 to 10% in steps of 0.5%, denoted $$$\nu_b$$$=[1:0.5:10]%, residence time of water in the intra-vascular compartment, $$$\tau_b$$$=[200:100:1600]ms, T1 of the intravascular compartment: $$$T_{1,b}$$$([1500:200:1900]ms), T1 of the extravascular compartment: $$$T_{1,e}$$$([600:70:2000]ms), and $$$B_1^+$$$([0.5:0.05:1.2]). Matching success was quantified through the interquartile range (IQR) of matched values for each parameter for white and grey matter, on the basis that we expect noise to artificially increase the range of observed fit values. Significance in median value and IQR changes were evaluated using Student's t-test. As large voxel sizes lead to partial volume effects, segmentations for white and grey matter were thresholded so that only voxels that contained 90% of the respective tissue were used in the calculation of interquartile range.
Results
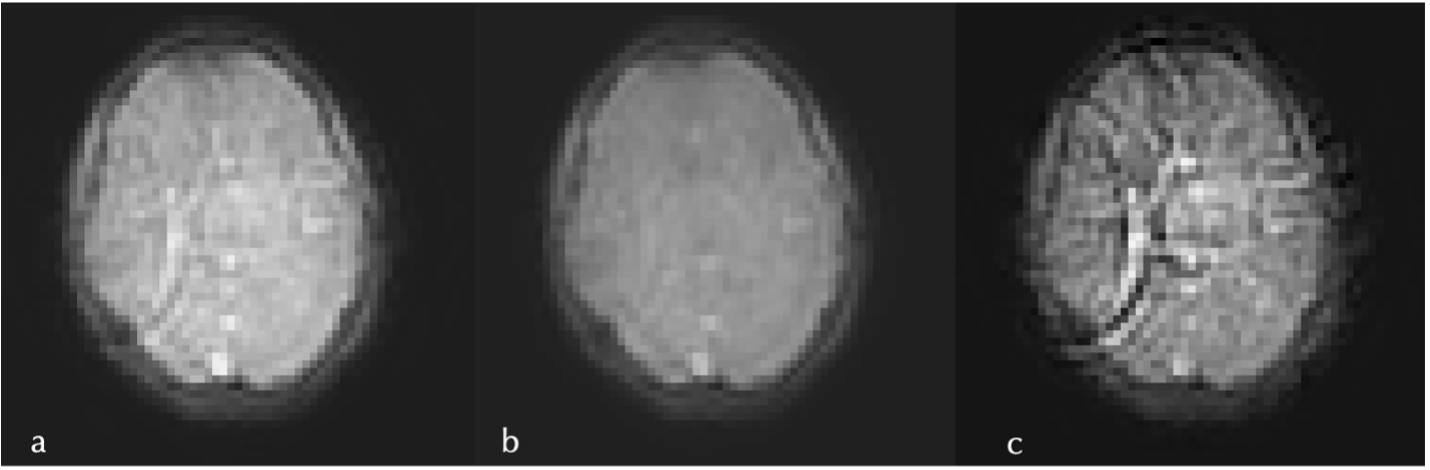
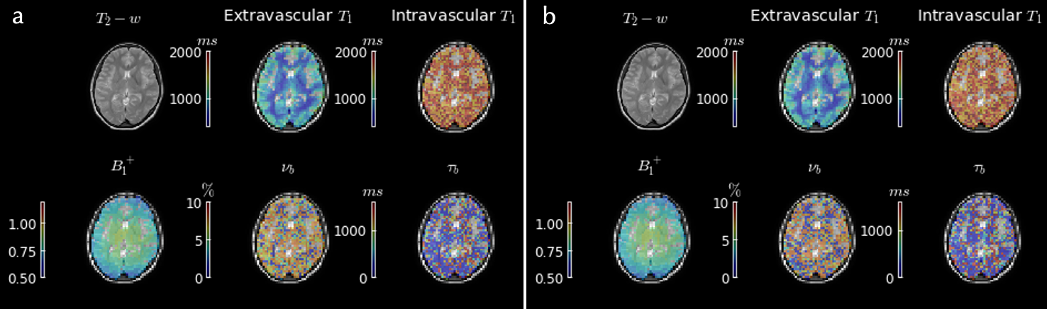
An example pre- and post- noise removal and difference image can be seen in Figure 3, clearly showing substantial removal of reconstruction-related structured noise. A comparison of two sets of quantitative maps from the same scan, with and without noise removal can be seen in Figure 4. Figure 5 shows the improvement in measurement precision post-noise removal. Across the seven subjects the mean reduction in IQR for white/grey matter was 23% for $$$T_{1,e}$$$ (p=0.0294), -7% for $$$T_{1,b}$$$ (p=0.1825), 16% for $$$\nu_b$$$ (p=0.1066) , and 27% for $$$\tau_b$$$ (p=0.0234). There was a reduction in the median values for each parameter of 1% for $$$T_{1,e}$$$ (p=0.6126), 0.4% for $$$T_{1,b}$$$ (p=0.7225), 23% for $$$\nu_b$$$ (p=0.0468) , and 25% for $$$\tau_b$$$ (p<0.0001).Discussion
These results suggest ICA can be useful in the removal of coherent noise components prior to MRF matching. A number of derived parameters show significant reduction in variance due to noise, as indicated by reduction in IQR. A reduction in median value is seen in parameters who's value falls towards the lower end of the dictionary, $$$\nu_b$$$ and $$$\tau_b$$$: artifical inflation of low values in noisy data is a consequence of matching to a dictionary.While this method was used to remove spiral reconstruction artefacts, this technique could also be used to reduce other structured artefacts, such as pulsation or coherent motion artefacts. The main limitation of this technique is in the determination of the number of ICA components: this is currently performed through visual inspection of the components. This makes ensuring the optimal number of components difficult. Correct component number selection is imperative as this could also lead to information of interest being removed.
Conclusion
Our findings suggest that ICA can be applied for the removal of coherent noise in MRF images prior to matching. Caution must be taken when selecting the number of ICA components and criteria for removal.Acknowledgements
This work is supported by the EPSRC-funded UCL Centre for Doctoral Training in Intelligent, Integrated Imaging in Healthcare (i4health) (EP/S021930/1), the Department of Health’s NIHR-funded Biomedical Research Centre at University College London Hospitals and by EPSRC grant EP/S031510/1. The authors wish to thank Dr. David Higgins of Philips Healthcare, Dr Elizabeth Powell, and Julia Markus for their help implementing this work in vivo.References
1. Ma D, Gulani V, Seiberlich N, et al. Magnetic resonance fingerprinting. Nature. 2013;495:187–19
2. Zhang Y, Brady M, Smith SA. Segmentation of Brain MR Images through a Hidden Markov Random Field Model and the Expectation Maximization Algorithm. IEEE Trans Med Imag, 2001;20(1):45-57
3. Jenkinson M, Smith SM. A global optimisation method for robust affine registration of brain images. Medical Image Analysis, 2001;5(2):143-156
4. Jenkinson M, Bannister PR, Brady JM, Smith SM. Improved optimisation for the robust and accurate linear registration and motion correction of brain images. NeuroImage, 2002;17(2):825-841
5. Hyvärinen A, Oja, E. Independent component analysis: algorithms and applications. Neural networks : the official journal of the International Neural Network Society. 2000;13(4-5):411–430
6. Gallagher TA, Nemeth AJ, Hacein-Ray L. An Introduction to the Fourier Transform: Relationship to MRI. American Journal of Roentgenology. 2018; 190(5):1396-406
Figures