3410
Investigating the Impact of Motion and Associated B0 Changes on Oxygenation Sensitive MRI through Realistic Simulations1Institute of Machine Learning in Biomedical Imaging, Helmholtz Center Munich, Munich, Germany, 2TUM School of Computation, Information and Technology; and TUM Institute for Advanced Study, Technical University of Munich, Munich, Germany, 3Lab for Artificial Intelligence in Healthcare and Medicine, Technical University of Munich, Munich, Germany, 4Department of Computing, Imperial College London, London, United Kingdom, 5Department of Neuroradiology, Neuroimaging Center, Technical University of Munich, Munich, Germany, 6Graduate School of Systemic Neurosciences, Ludwig-Maximilians-University, Munich, Germany, 7Department of Diagnostic and Interventional Radiology, School of Medicine, Technical University of Munich, Munich, Germany, 8School of Biomedical Imaging and Imaging Sciences, King’s College London, London, United Kingdom, 9Department of Neuroradiology, School of Medicine, Technical University of Munich, Munich, Germany
Synopsis
Keywords: Artifacts, Oxygenation, Motion Simulation
T2*-weighted gradient echo imaging is strongly impacted by subject head motion, amongst others due to motion-related changes in B0 inhomogeneities. Within the oxygenation-sensitive mqBOLD protocol, motion artifacts in T2*-weighted images lead to errors in derived parameter maps. To quantify these errors, we performed realistic motion simulations incorporating rigid body transformations and motion-related field inhomogeneity changes. Our results demonstrate the importance of including B0 inhomogeneities for realistic motion artifact patterns. Even small amounts of simulated motion resulted in substantial errors in derived T2* and R2’ parameter maps, which highlights the relevance of T2* motion correction within the mqBOLD technique.Introduction
Motion artifacts remain a major challenge for Magnetic Resonance Imaging (MRI). T2*-weighted sequences like gradient echo (GRE) MRI show a high sensitivity towards magnetic field inhomogeneities - especially for larger echo times, and are thus particularly affected by subject motion [1]. When acquired as part of the multi-parametric quantitative BOLD (mqBOLD) protocol [2], motion artifacts in multi-echo T2*-weighted data propagate towards derived parameters, such as the susceptibility related R2’ relaxation rate and finally the oxygen extraction fraction, which can be derived via an analytic model [2]. In this work, we investigate how subject motion affects T2*-weighted GRE data and how these motion induced errors translate into derived quantitative T2* and R2’ parameter maps - as intermediate results within the mqBOLD acquisition. To this end, we carried out simulations, which do not only include rigid body transformations, but also consider B0-inhomogeneities as second-order motion effects.Methods
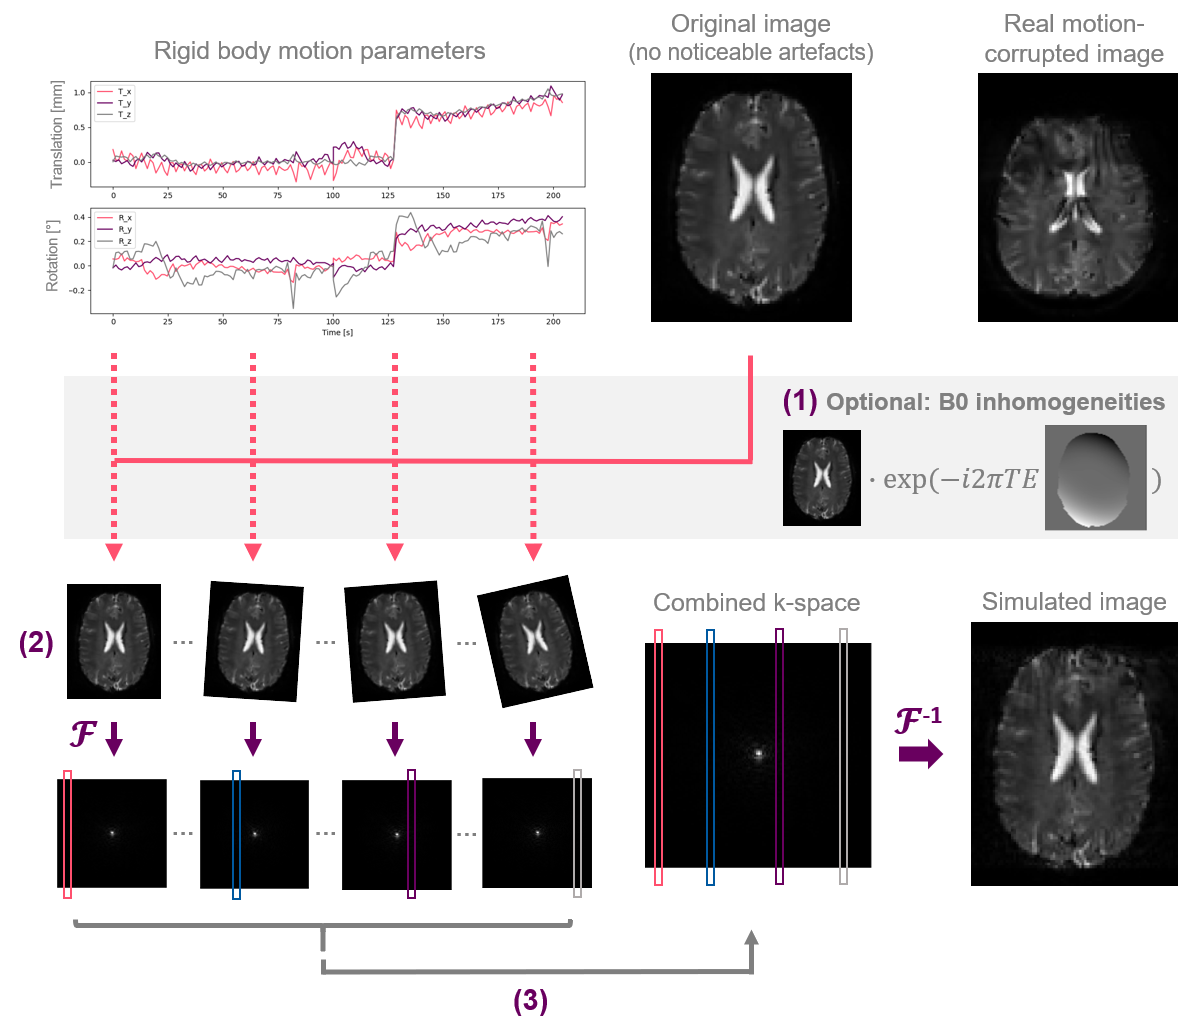
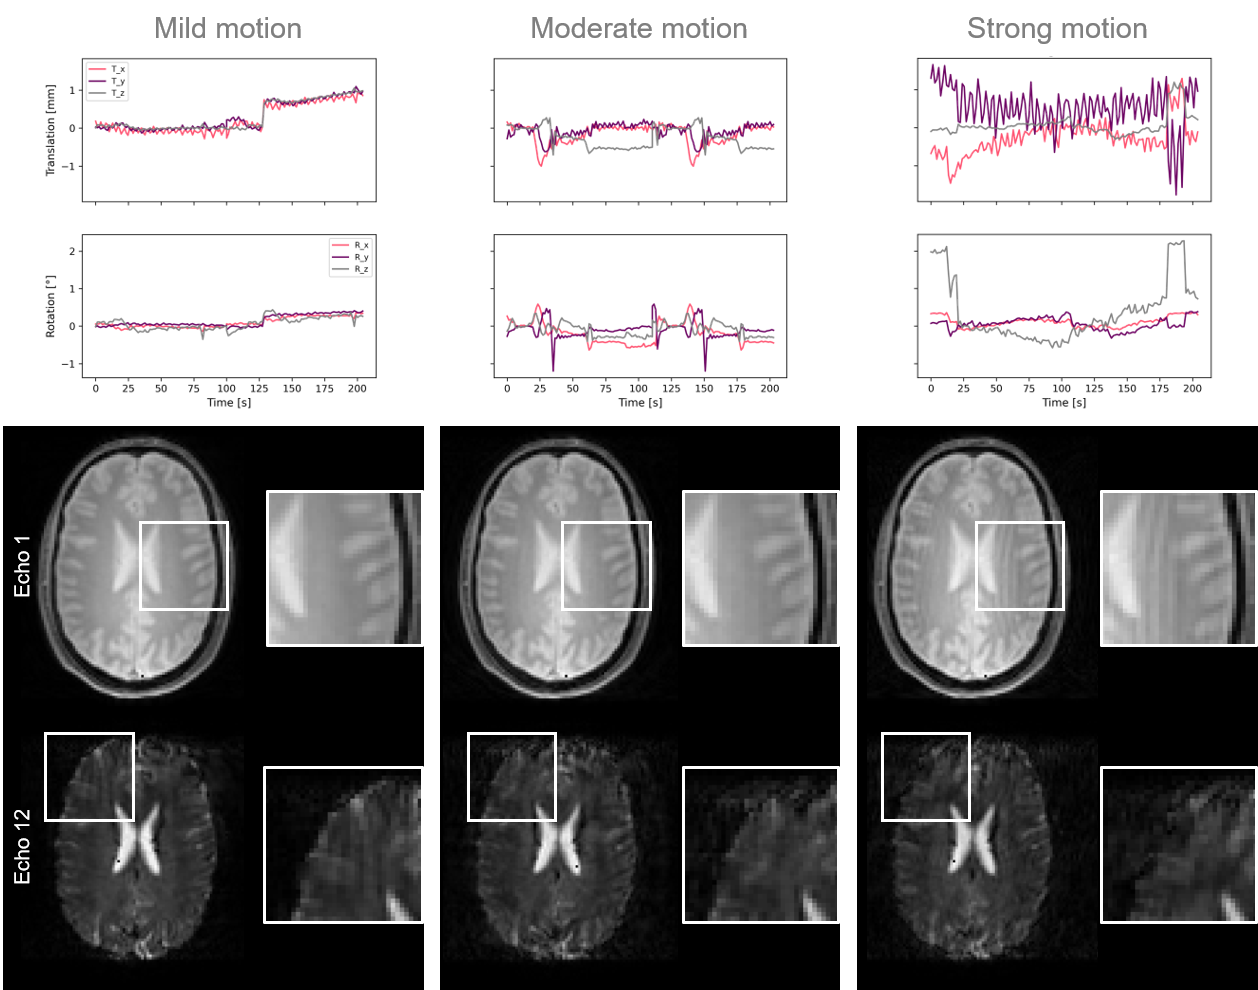
Rigid motion artifacts were simulated based on complex T2*-weighted datasets of 20 young and healthy volunteers (unpublished mqBOLD data from two ongoing studies investigating brain oxygen metabolism), which originally did not show noticeable motion artifacts (multi-slice GRE, 12 echoes, 30-36 slices, TE1/ΔTE = 5/5ms, TR=1910-2291ms, α=30°, voxel size: 2x2x3 mm3). To achieve realistic artifact patterns, motion parameters were extracted from separately acquired functional MRI time series and further augmented by shifting and scaling. These motion curves were categorized into three motion levels, characterized by the average displacement of a 64mm sphere: mild (0 - 0.66mm), moderate (0.66 – 1.33mm) and strong (1.33 – 2mm). For each volunteer and motion level, motion artifacts were simulated using three randomly selected motion profiles. As illustrated in Figure 1, motion was simulated by rigidly transforming the image data and subsequently merging different motion states in k-space. In this process, the actual multi-slice acquisition scheme, i.e. the ordering of phase encoding lines, was considered. Additionally, B0 inhomogeneities were incorporated by multiplying the image with a randomly modified B0 map, with deviations of max. 5Hz. This upper limit was chosen based on a maximum head position-dependent field inhomogeneity perturbation of 10Hz measured at 7T in [3].T2* mapping with magnetic background field correction [4] and calculation of R2’ maps (using additional T2 maps: $$$R2'=\frac{1}{T2*}-\frac{1}{T2}$$$) were performed in MATLAB R2022b and SPM12 with custom programs [5]. Simulations and further image analyses were performed in Python 3.8.12 (code available at: https://github.com/HannahEichhorn/T2starRealisticMotionSimulation). Statistical testing was done using Wilcoxon signed rank tests and False-Discovery Rate (FDR) correction for multiple comparisons.
Results
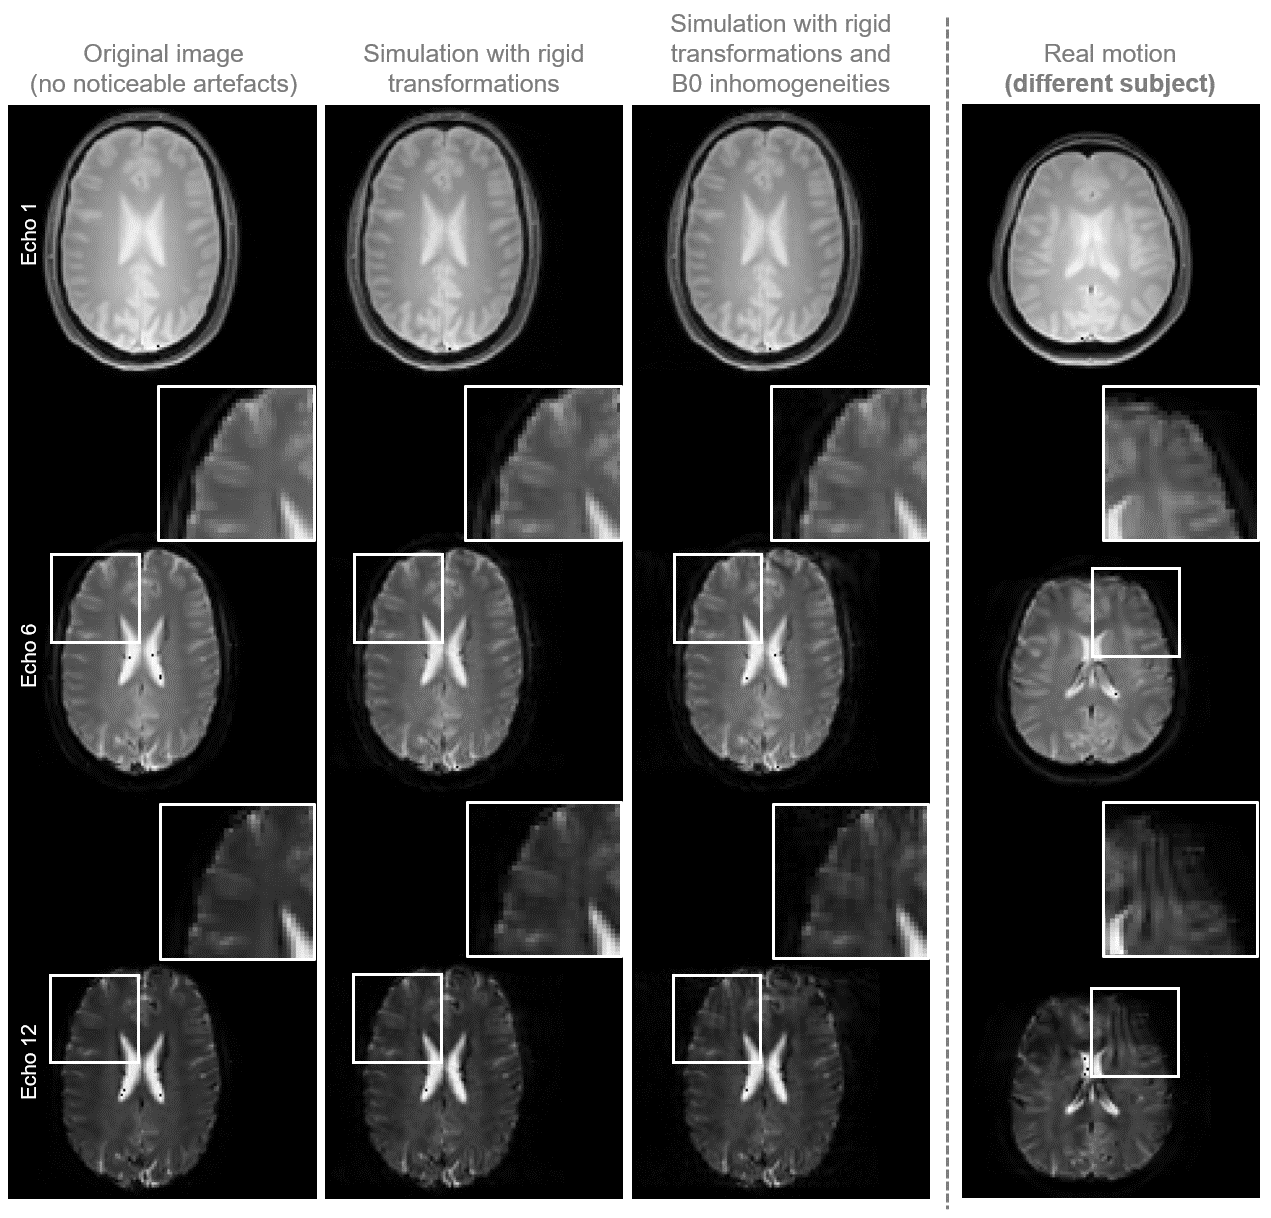
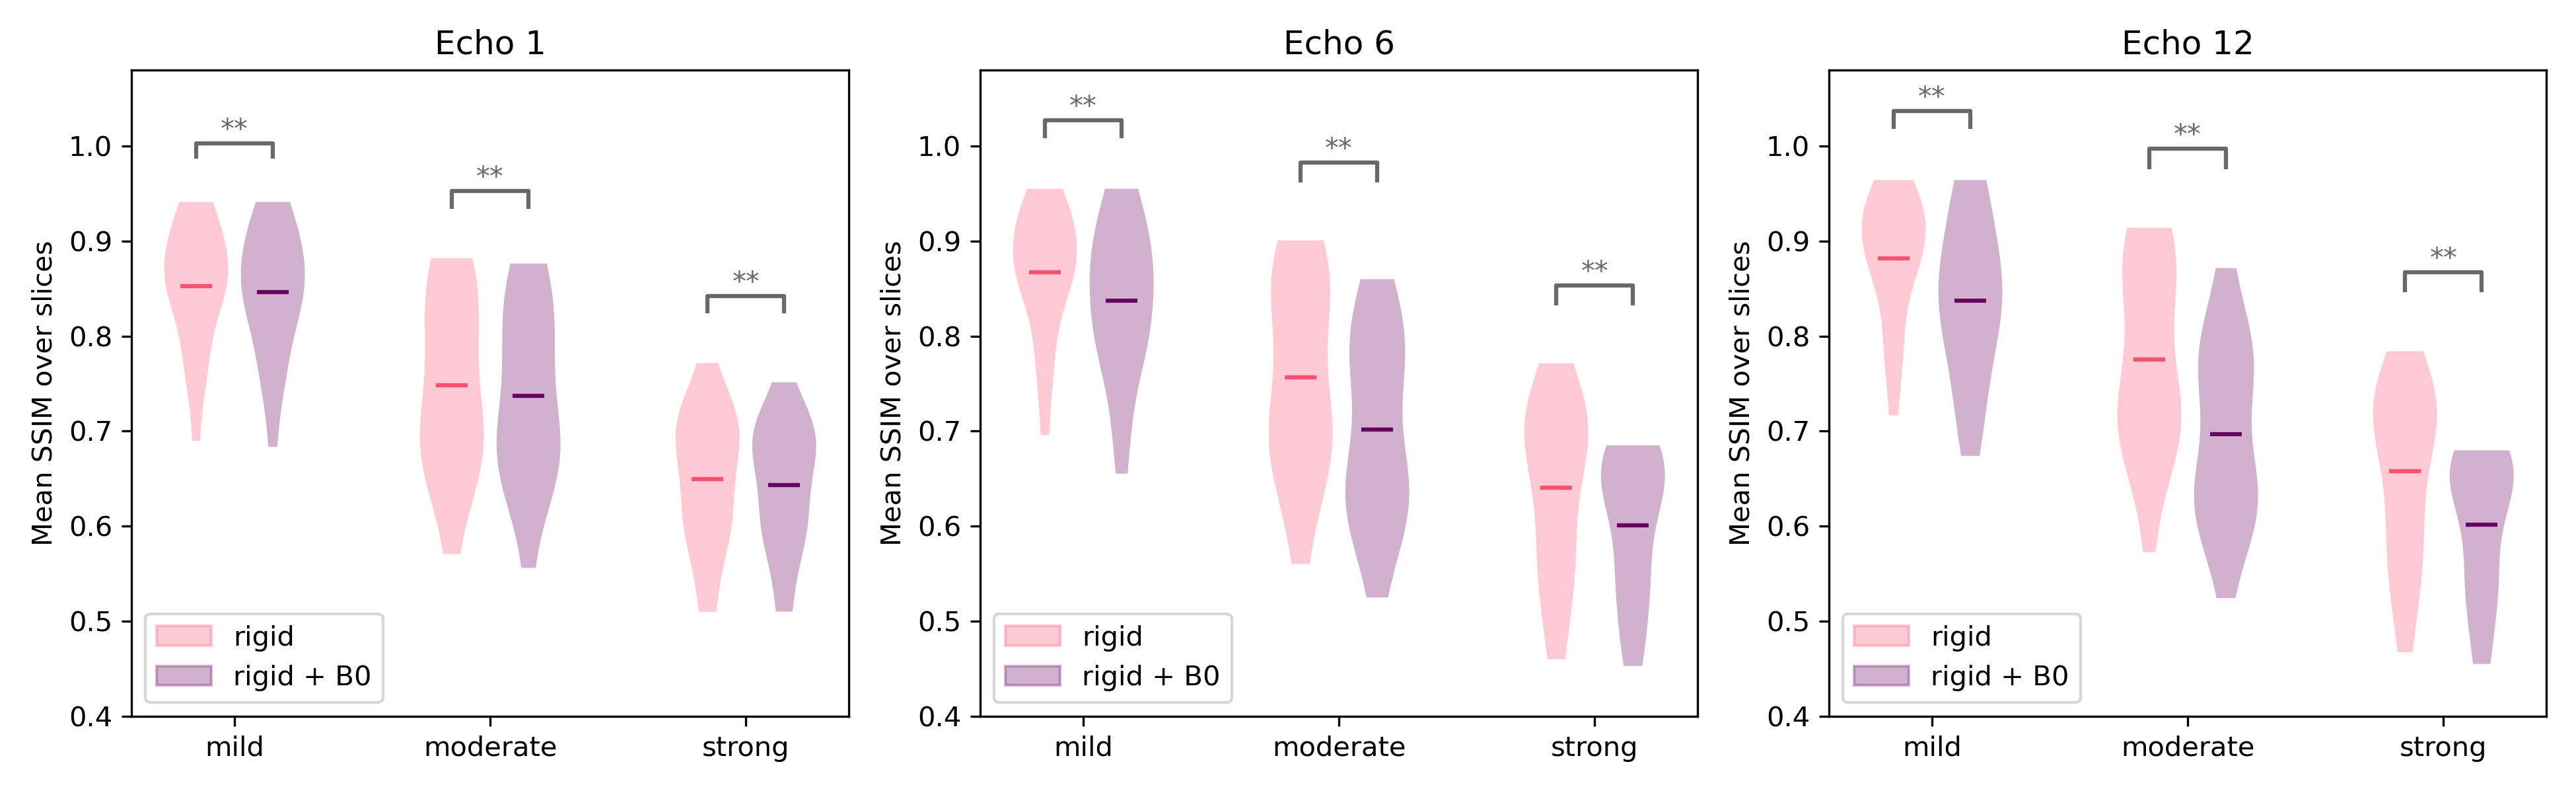
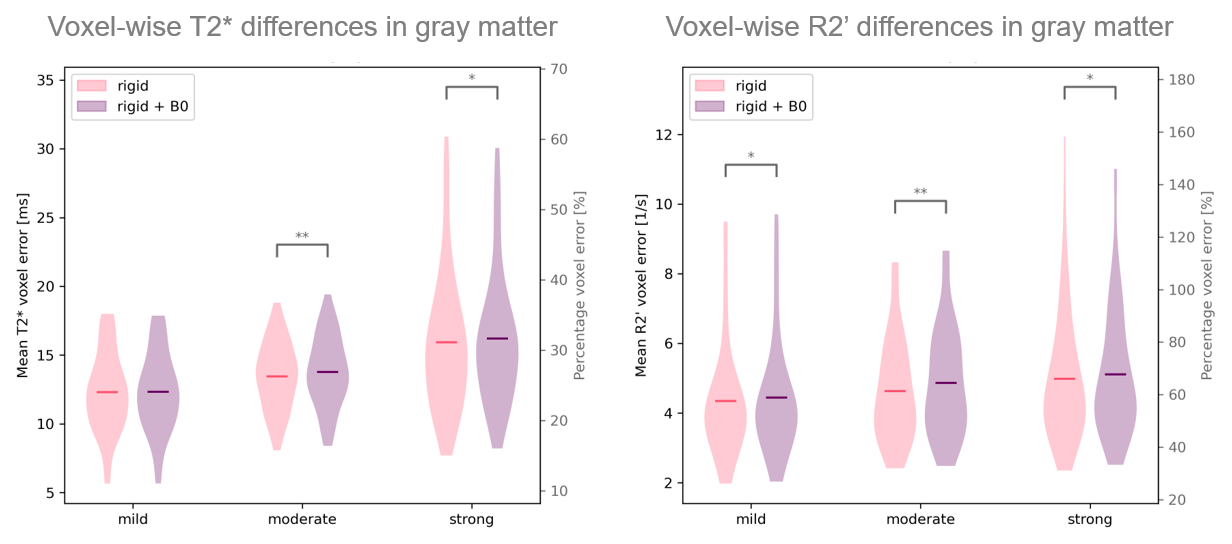
The comparison of a simulated and a real motion-corrupted image example in Figure 2 illustrates that realistic motion artifact patterns can only be achieved by including B0-inhomogeneities in addition to rigid body transformations in the simulation. Notably, this leads to more severe artifacts for later echoes, which is common for real motion-corrupted data. Figure 3 compares simulated data for the three different motion levels and shows that artifacts become more severe for larger amounts of simulated motion. Figure 4 confirms these visual observations from a more quantitative perspective. It compares the Structural Similarity Index (SSIM) between simulated and original images as a measure of image quality. SSIM and thus, image quality, decreased with increasing amount of motion. For larger echo times, simulations using B0-inhomogeneities showed lower SSIM values than simulated data using rigid transformations only. As shown in Figure 5, the decrease in image quality due to simulated motion propagated into T2* and R2’ errors. Even for mild motion, the mean absolute difference of T2* values in gray matter (GM) between simulated and original data was 12.3ms (average across all ‘mild’ simulations), corresponding to 24.1% of the average GM T2* value in the original data. For derived R2’ maps, motion induced artifacts propagated into an even larger error of 58.3%. For both analyses, no substantial differences were observed between either including or excluding B0 inhomogeneities in the simulations.Discussion
Simulated motion caused strong artifacts in T2*-weighted images and propagated into substantial errors in T2* and even larger errors in derived R2’ parameter maps. This highlights the importance of motion correction for a robust quantification of blood oxygenation with the mqBOLD technique. Visual similarity of simulated and real motion artifacts and results of the SSIM analysis demonstrate the relevance of including field inhomogeneities as second order motion effects for generating realistic motion artifact patterns in simulated images. Interestingly, including B0-inhomogeneity in the simulations did not noticeably increase T2* and R2’ errors. This is most likely due to the correction of magnetic background fields during T2* mapping [4], which also excludes later echoes in the presence of strong in-plane susceptibility gradients [6], further weakening the effect of strong B0 inhomogeneities on T2* mapping.Conclusion
Our analysis emphasizes that motion correction for T2*-weighted GRE imaging is necessary within the oxygenation sensitive mqBOLD protocol. The relevance of accounting for field inhomogeneities, when simulating motion-corrupted data, depends on the downstream task: for T2* mapping, background field correction proved to considerably reduce the influence of simulated motion-related B0 inhomogeneities.Acknowledgements
H.E. is supported by the Helmholtz Association under the joint research school "Munich School for Data Science - MUDS".References
[1] Magerkurth, Joerg et al. “Quantitative T * 2 -Mapping Based on Multi-Slice Multiple Gradient Echo Flash Imaging: Retrospective Correction for Subject Motion Effects: Movement Correction in T*2 Mapping.” Magnetic Resonance in Medicine 66, no. 4 (2011): 989–97.
[2] Hirsch, Nuria M et al. “Technical Considerations on the Validity of Blood Oxygenation Level-Dependent-Based MR Assessment of Vascular Deoxygenation: BOLD-based assessment of vascular deoxygenation.” NMR in Biomedicine 27, no. 7 (2014): 853–62.
[3] Liu, Jiaen et al. “Effect of Head Motion on MRI B0 Field Distribution.” Magnetic Resonance in Medicine 80, no. 6 (2018): 2538–48.
[4] Hirsch, N.M., and C. Preibisch. “T2* Mapping with Background Gradient Correction Using Different Excitation Pulse Shapes.” American Journal of Neuroradiology 34, no. 6 (2013): E65–68.
[5] Kaczmarz, Stephan, Fahmeed Hyder, and Christine Preibisch. “Oxygen Extraction Fraction Mapping with Multi-Parametric Quantitative BOLD MRI: Reduced Transverse Relaxation Bias Using 3D-GraSE Imaging.” NeuroImage 220 (2020): 117095.
[6] Baudrexel, Simon et al. “Rapid Single-Scan T 2*-Mapping Using Exponential Excitation Pulses and Image-Based Correction for Linear Background Gradients.” Magnetic Resonance in Medicine 62, no. 1 (2009): 263–68.
Figures