3408
Magnetic Ferritin Nanoprobe Imaging Analysis with MRI Slow Velocity Mapping Measurement1College of Life Science and Technology, Beijing University of Chemical Technology, Beijing, China, 2CAS Center for Excellence in Nanoscience, National Center for Nanoscience and Technology, Beijing, China, 3Institute of Geology and Geophysics, Chinese Academy of Sciences, Beijing, China, 4Beijing Intelligent Brain Cloud Inc, Beijing, China, 5University of Chinese Academy of Sciences, Beijing, China
Synopsis
Keywords: Quantitative Imaging, Velocity & Flow, Tumor Interstitial Fluid
For effectively penetrating into tumors, drug diffusion speed should be greater than the outward tumor interstitial fluid (TIF) convection speed. Studying TIF is helpful to deeply understand the fluid behavior of tumor fluid flow and its impact on the delivery of nano drugs. In this experiment, an improved PC-MRI slow flow measurement sequence was used to detect the velocity of interstitial fluid in different tumor growth periods. Combined with clinical standard sequence, the relationship between the distribution of the magnetic ferritin (M-HFn) contrast agent in tumor and the velocity of TIF was observed and analyzed.Introduction
There are several kinds of fluid flow phenomena in solid tumors including intravascular blood flow and interstitial convection1. It was demonstrated that drug delivery in tumors is greatly affected by tumor interstitial fluid (TIF) 2. Compared with superficial tissue fluid velocity detection by optical technology3-4, PC-MRI has great advantages in imaging depth and FOV. The clinical PC-MRI technique was designed for imaging flow from large vessels, such as arteries and veins, and lack of sensitivity for flow with small velocity5-7. Recently, a vertical plane echo Velocity_mapping PC-MRI sequence was developed to detect velocity of TIF 8. With high signal-to-noise ratio (SNR), it has enough sensitivity to measure the TIF velocity8.In this study, we used the Velocity_mapping sequence to detect the slow flow rate of TIF in different growth periods. Meanwhile, a magnetic ferritin (M-Hfn) nano material was used to assess in-vivo TIF effect. The M-Hfn not only contains superparamagnetic iron oxide nanoparticles, but also can specifically bind with TRf1 ligand over expressed in U87 cancer cells. It is a very effective T2 contrast agent for MRI tumor targeting9-10. The relationship between the distribution of M-Hfn contrast in tumor and the flow rate of TIF was investigated for the influence of tumor fluid dynamics on drug delivery.
Methods
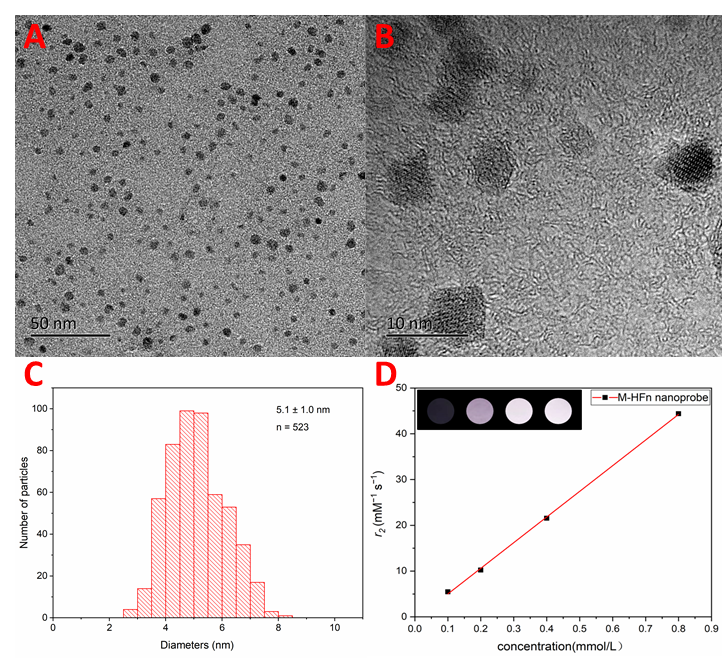
Nano materialsM-HFn nanoparticles were provided from biogeomagnetism group, Institute of Geology and Geophysics, Chinese Academy of Sciences. The morphology and size of nanoparticle are displayed by 200Kv transmission electron microscope (JEOL, JEM-2100). And the relaxivity of M-HFn under different concentrations were measured with MRI(Bruker, Biospec 70/20 USR).
Animal tumor model
Four male nude mice at 4 weeks were implanted subcutaneously with human brain tumor gliomas (U87). One of them was detected by velocity_maping sequence on the 3rd, 5th, 8th and 11th days after tumor bearing to analyze the velocity of TIF in different growth time. The other three mice bearing tumor after 8 days were prepared for M-HFn administration and further MRI experiment.
In vivo MRI
In vivo MRI scan was performed on a 7T small animal scanner. Velocity_mapping sequence (FOV=35 mm × 35 mm; MTX=96 × 96; TE=19.07 ms; TR=4901 ms; Inversion time=700 ms;Velocity encoded directions = 6; Encoding gradient strength (G) =20 mT/m, Gradient duration (τ) = 3 ms, and Gradient separation (Δ) = 100 ms was performed on all mice before administration. The velocity distribution of TIF under the initial statement was determined. Then, M-HFn nanoprobe intravenously injected into mice by single injection at a dose of [Fe3+] 20 mg/kg. Standard T2WI and T2*, T2_Mapping were conducted before and one hour after administration to determine the entry and distribution of the agents in tumor.
Histological analysis
The tumors were collected and then fixed with 10% formalin solution, embedded in conventional paraffin, and sectioned into thin slices. Immunohistochemical staining was performed for histological analyses.
Results
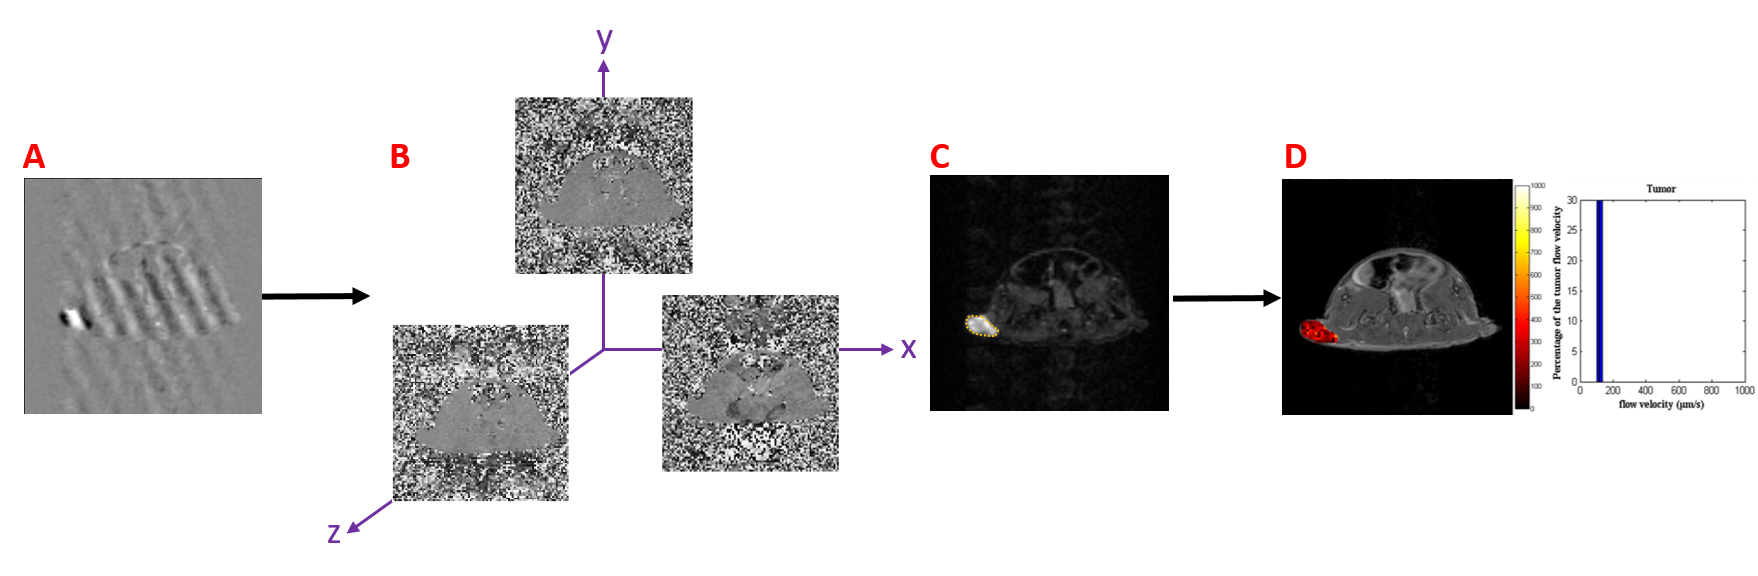
M-HFn nanoparticles were uniformly monodispersed (Fig. 1A-B), and the size distribution is 5 ± 1.0 nm (Fig. 1C).In vitro MRI showed that M-HFn was a highly effective T2 contrast agent (Fig. 1D) and the T2 molar longitudinal relaxivity (r2) was measured as 56.1 mM−1 s−1.The TIF velocity calculation process was demonstrated in Figure 2. The pixel-wise velocity map of six directions of x, y, z (in and out) (Fig. 2B) obtained by the decomposition of complex images (Fig. 2A). Then, the tumor ROI was outlined on magnitude images (Fig. 2C), and the velocity distribution map of the tumor was obtained after background imaging fusion (Fig. 2D).
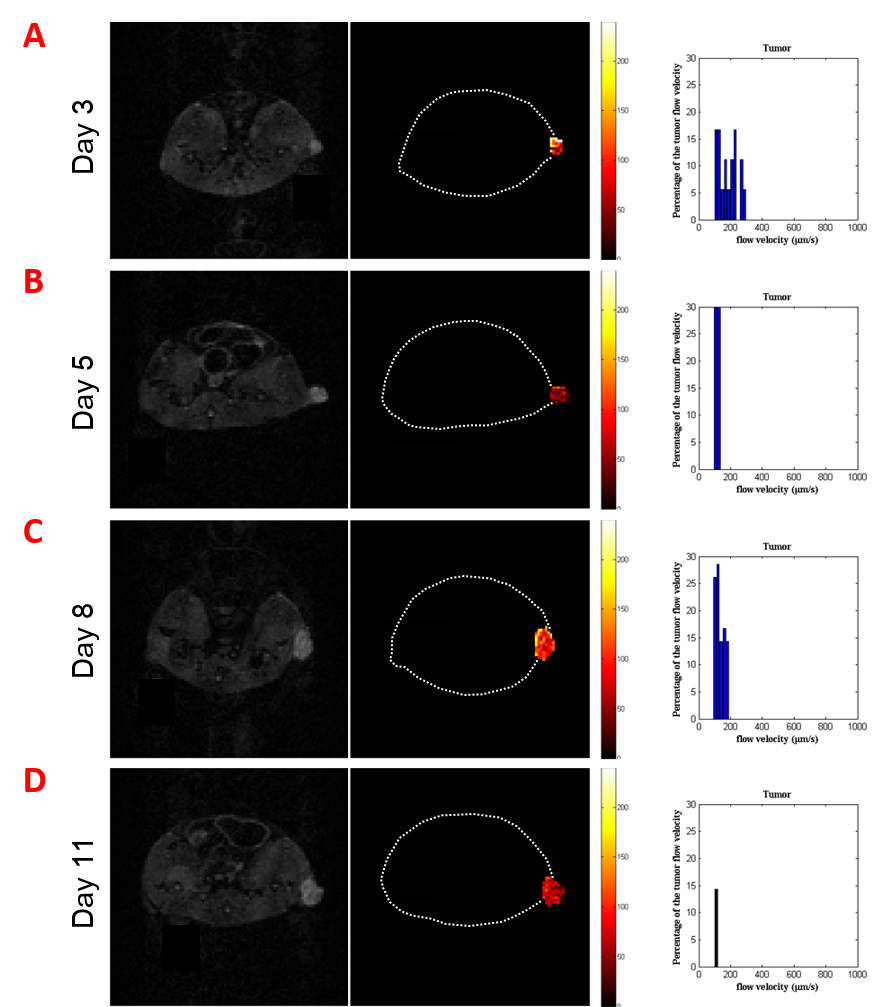
Before drug administration, the flow rate of TIF was calculated in different time points. The above method was used to calculate the TIF velocity distribution statistics on tumor bearing mice at the 3rd, 5th, 8th and 11th days. The flow rate results were 150-300 μm/s, 100-180 μm/s, 100-200 μm/s and 100-120 μm/s, respectively. The change of fluid flow rate in tumor may be related to tumor growth cycle such as tumor formation, cell apoptosis and/or tumor cell proliferation. Therefore, the measurement of TIF is helpful to provide reference for drug delivery.
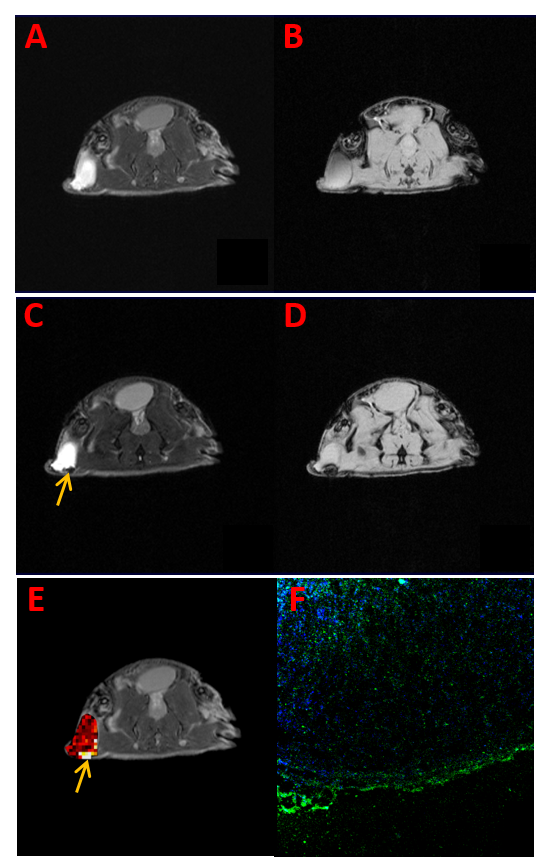
T2 and T2* weighted images of mice before and after tumor administration were shown in Figure 4(A-D). Significant reduced signal intensity at the arrow position was shown in Figure 4C compared with Figure 4A. The T2 value was found to decrease from 48.5 ms to 28.6 ms, indicating that a large amount of drug enriched in the area. It can be seen in Figure 4E that the flow rate in the same area (yellow arrow) before administration was significantly enhanced. Immunohistochemical staining results showed that TRf1 antibody was positive at the tumor edge (Fig. 4f), which was consistent with the enrichment of M-HFn nanoparticle at the tumor edge in MRI.
Conclusion
This study suggests that M-HFn distribution is not only affected by receptor targeting, but also related to the interstitial flow rate. Therefore, investigation of TIF velocity could help to understand the fluid behavior of tumor and its role in nano drug delivery. Moreover, it provides guidance for the customization of nano carriers, doses and the design of physicochemical properties of drugs when setting clinical treatment plans.Acknowledgements
We acknowledge the support from NSFC (61971151), CAS Instrument and Equipment Functional Development and Technological Innovation Project (Research and Development of Mouse Whole Body 19F/1H Dual Frequency birdcage quadrature coil).References
[1] Baronzio G, Schwartz L, Kiselevsky M, et al. Tumor interstitial fluid as modulator of cancer inflammation, thrombosis, immunity and angiogenesis. Anticancer Res. 2012; 32(2):405-14.
[2] Trédan O, Galmarini CM, Patel K, et al. Drug resistance and the solid tumor microenvironment. J Natl Cancer Inst. 2007;99(19):1441-54.
[3] Blatter C, Meijer EF, Nam AS, et al. In vivo label-free measurement of lymph flow velocity and volumetric flow rates using Doppler optical coherence tomography. Sci Rep. 2016;6:29035.
[4] Chary SR, Jain RK. Direct measurement of interstitial convection and diffusion of albumin in normal and neoplastic tissues by fluorescence photobleaching. Proc Natl Acad Sci U S A. 1989;86(14):5385-9.
[5] Stalder AF, Russe MF, Frydrychowicz A, et al. Quantitative 2D and 3D phase contrast MRI: optimized analysis of blood flow and vessel wall parameters. Magn Reson Med. 2008;60(5):1218-31.
[6] Nagaraj HM, Pednekar A, Corros C, et al. Determining exercise-induced blood flow reserve in lower extremities using phase contrast MRI. J Magn Reson Imaging. 2008;27(5):1096-102.
[7] Markl M, Kilner PJ, Ebbers T. Comprehensive 4D velocity mapping of the heart and great vessels by cardiovascular magnetic resonance. J Cardiovasc Magn Reson. 2011;13(1):7.
[8] Cao Y, Zhang Y, Wang Y, et al. Improved stimulated echo in diffusion magnetic resonance imaging: introducing a π pulse for SNR enhancement. Magn Reson Med. 2019;81(5):2905-2914.
[9] Cao C, Wang X, Cai Y, et al. Targeted in vivo imaging of microscopic tumors with ferritin-based nanoprobes across biological barriers. Adv Mater. 2014;26(16):2566-71.
[10] Cai Y, Wang Y, Xu H, et al. Positive magnetic resonance angiography using ultrafine ferritin-based iron oxide nanoparticles. Nanoscale. 2019;11(6):2644-2654.
Figures