3407
Influence of different confounders on measurements results of 2D Flow MRI Examinations in Healthy Travelling Volunteers1Working Group on Cardiovascular Magnetic Resonance, Experimental and Clinical Research Center, a joint cooperation between the Charité Universitätsmedizin Berlin and the Max-Delbrück-Center for Molecular Medicine, Berlin, Germany, Charité - Universitätsmedizin Berlin, Berlin, Germany, 2Partner Site Berlin, DZHK (German Centre for Cardiovascular Research), Berlin, Germany, 3Department of Cardiology and Nephrology, Helios Hospital Berlin-Buch, Berlin, Germany, 4Cardiovascular MR R&D, Siemens Medical Solutions USA, Inc., Cleveland, Ohio, USA, Cleveland, OH, United States, 5Magnetic Resonance, Siemens Healthcare GmbH, Erlangen, Germany, 6Institute of Radiology, University Hospital Erlangen, Friedrich-Alexander-Universität Erlangen-Nürnberg (FAU), Erlangen, Germany, Erlangen, Germany
Synopsis
Keywords: Quantitative Imaging, Heart, 2D Flow
Various confounders can have an influence on the results of cardiovascular MRI (CMR) examinations. Data about systematic investigations of such confounders are sparse. 2D Flow CMR using segmented and realtime measurements was performed in 20 healthy travelling volunteers to examine the influence of beat-to-beat variability between different heart cycles, sequence types, field strengths and scanner configurations as well as examiners on forward flow volume and peak velocity and compared to 95% tolerance intervals established by intraobserver analysis to test for comparability and precision of measurements which revealed good to very good comparability regarding various physiological, technical and post- processing confounders.In the course of acquiring and interpreting cardiovascular MRI (CMR) examinations, various confounders come into consideration that can have an influence on the results (e.g. different field strengths, scanner configurations, sequence types, intraindividual changes in physiology as well as and the effect of different examiners). However, data about systematic investigations of such confounders are sparse. The aim of our study is to investigate the influence of these confounders on the measurement results and on precision using phase contrast based two-dimensional blood flow (2D Flow) examinations (1).
Methods
2D Flow measurements in the ascending aorta at the sinotubular junction were acquired in 20 healthy travelling volunteers and analyzed regarding forward flow volume (FF) and peak velocities (PV) using two repeated segmented gradient echo phase contrast measurements (repetition time 4.625 ms, echo time 2.47 ms, voxel size 1.77 x 1.77 x 6 mm3, flip angle 20°, velocity encoding range 150 – 200 cm/s in a through-plane direction) directly after one another to test for repeatability and one realtime measurement using a research sequence (repetition time 3.65 ms, echo time 2.22 ms, voxel size 1.73 x 1.73 x 8 mm3, flip angle 10°, velocity encoding range 150 – 200 cm/s in a through-plane direction) to test for different sequence types when compared to the segmented ones. Scans took place at four different sites with scanners from Siemens Healthcare, Erlangen, Germany (site 1 MAGNETOM Avanto fit 1.5T; site 2 MAGNETOM Skyra fit 3T; site 3 MAGNETOM Prisma fit 3T and site 4 MAGNETOM Prisma fit 3T) and compared to each other to test for differences due to field strengths and scanner configurations. Sequence parameters and acquisition methods were standardized before inclusion of the first volunteer. At site two repositioning after 15 minutes with repetition of the examination took place to test for hemodynamic changes over time. Additionally, interobserver analysis was applied using the measurements at site two before repositioning to test for the influence of different examiners. An intraobserver analysis was used to define tolerance intervals (2). Equivalence was tested by intraclass correlation coefficient (ICC) with a two-way mixed model and absolute agreement as well as displayed using Bland- Altman plots and plotting against the 95% tolerance interval of the intraobserver difference with 95% coverage as previously described (2). Postprocessing was done using commercially available software (Circle CVI 42 Version 5.13.7, Circle Cardiovascular Imaging Inc., Calgary, Alberta, Canada). Statistical analysis was performed using GraphPad PRISM version 5.00 for Mac (GraphPad Software, San Diego California, USA) and SPSS Version 29 (IBM, Armonk, USA).
Results
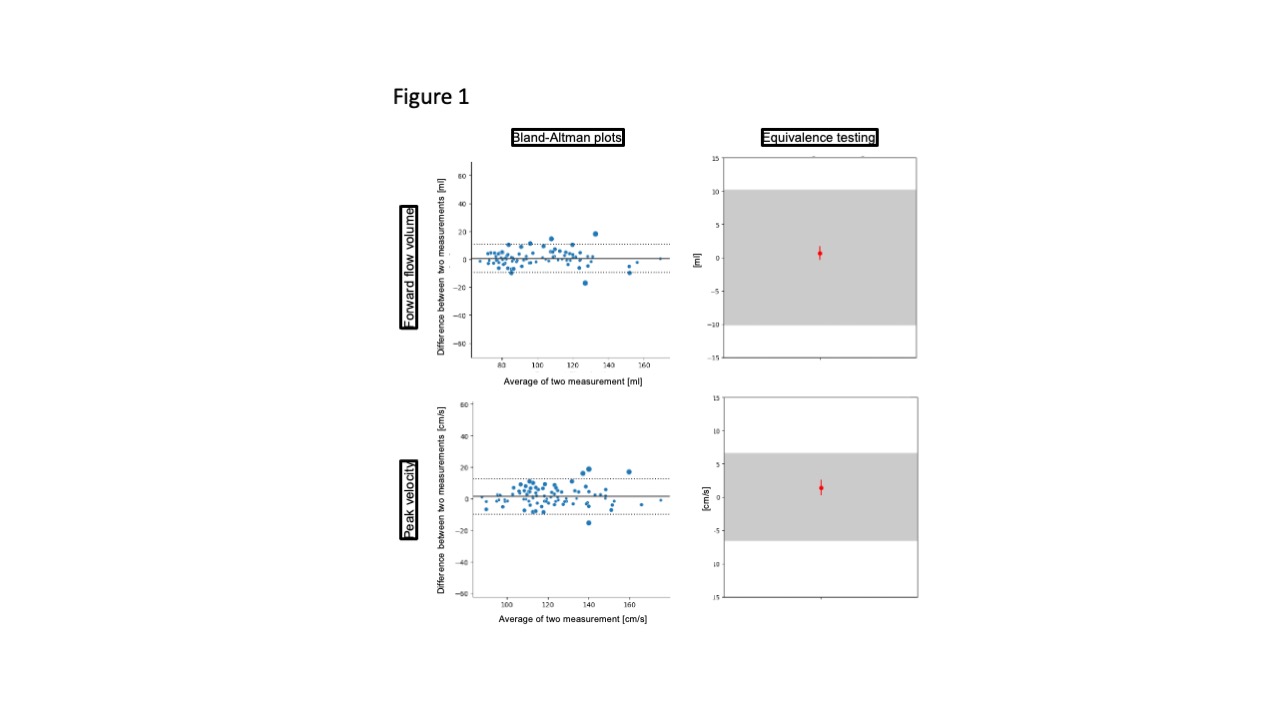
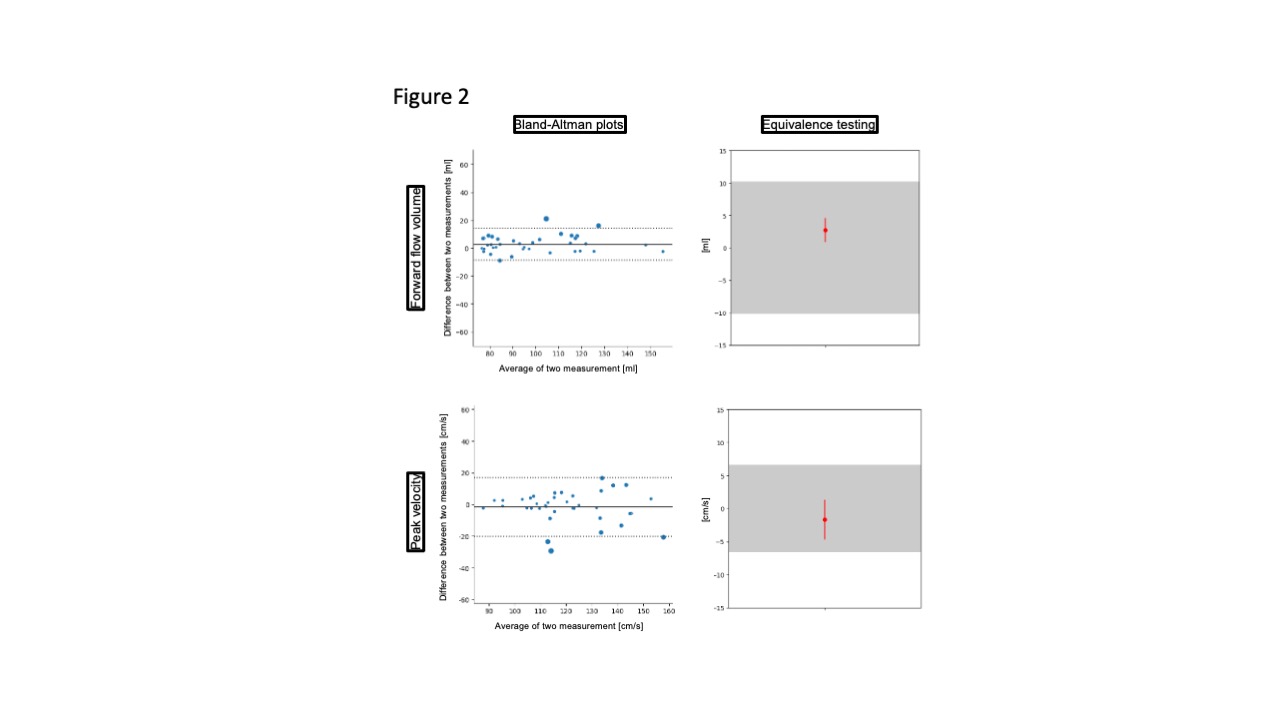
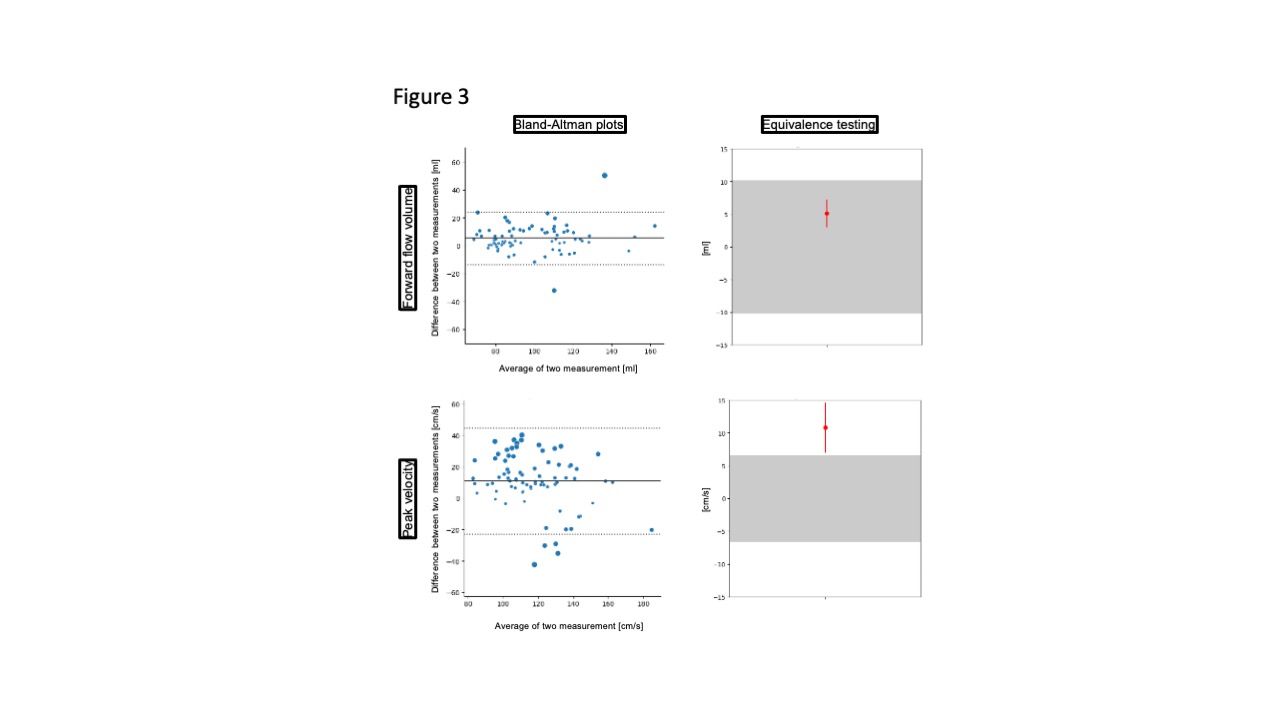
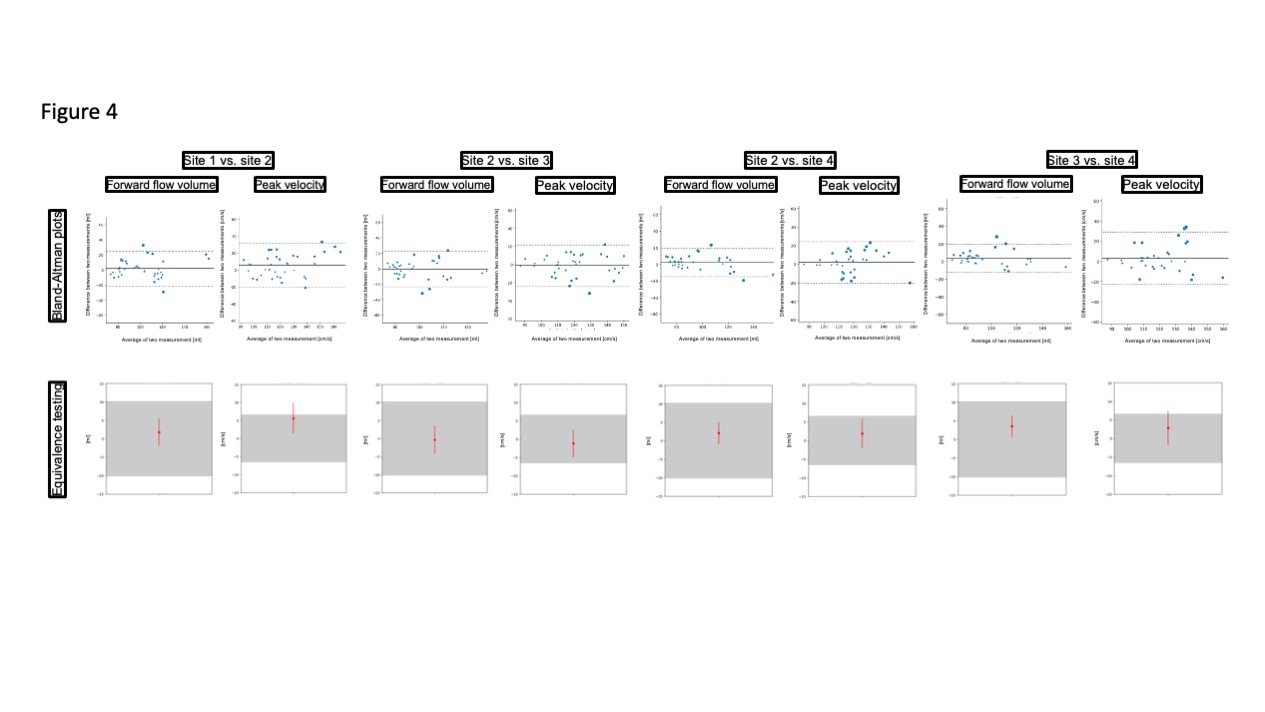
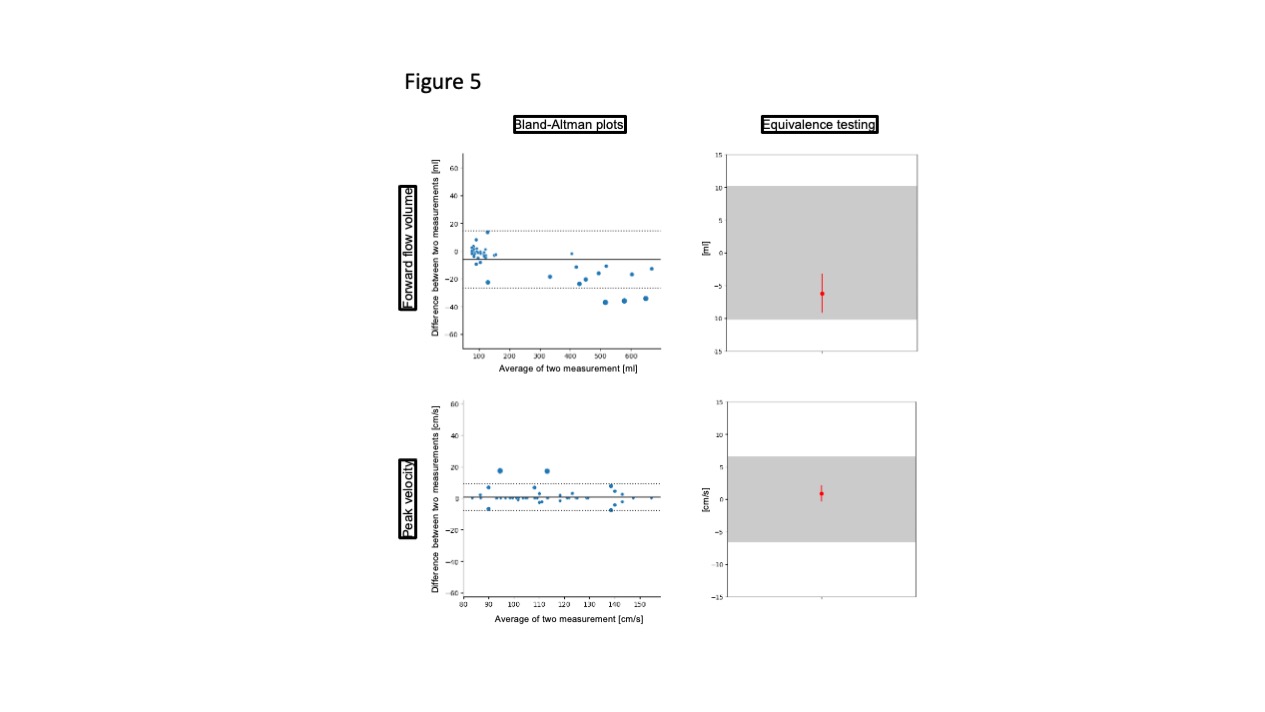
8 females and 12 males (age 27.7±9.1 years) were scanned. A total of 188 segmented and 79 realtime measurements were acquired and analyzed. There was excellent agreement regarding repeatibility (FF: ICC=0.986, PV: ICC=0.972) (Figure 1) and hemodynamic changes over time (FF: ICC=0.976, PV: ICC=0.920) (Figure 2). Segmented acquisition compared to real-time acquisition showed excellent agreement for FF (ICC=0.972) (Figure 3) and good agreement for PV (ICC=0.744) (Figure 3). Different field strengths (1.5T vs. 3T) showed also very good agreement (FF: ICC=0.920, PV: ICC=0.851) (Figure 4) which also applies to different scanner configurations (site 2 vs site 3 FF: ICC=0.918, PV: ICC=0.879; site 2 vs. site 4 FF: ICC=0.956, PV: ICC=0.842; site 3 vs. site 4 FF: ICC=0.959, PV: ICC=0.852) and the interobserver analysis (Figure 5) (FF: ICC=0.999, PV: ICC=0.985). All measurements compared were equivalent when plotted against 95% tolerance intervals except for peak velocites in different sequence types, between different field strengths and between site 3 and 4.
Discussion
Comparison of different 2D flow examinations revealed good to very good comparability and little influence of various physiological, technical, and post-processing confounders in healthy travelling volunteers. Peak velocity was influenced more than forward flow volume. However, although it exceeded the tolerance range in three comparisons, these deviances of up to 15 cm/s are within clinically acceptable levels of variation. As previously published, beat-to-beat variability between cardiac cycles can be up to 30% in stroke volume even in healthy volunteers which could be an explanation beside technical factors like different sequence types or background phases (3). Moreover, various sources of errors in phase-contrast measurements have to be considered (e.g. deviation of imaging planes, phase offset errors), which were not explicitly examined in our study (4).
Conclusion 2D flow CMR examinations in healthy travelling volunteers were comparable regarding quantitative parameters when examined regarding various physiological, technical and post-processing confounders.
Acknowledgements
This study was approved by the local ethics committee of the Charité Universitätsmedizin Berlin as retrospective study (study ID: EA 1 253 21). The requirement for written informed consent was acquired during the original clinical study approved by the local ethics committee of the Charité - Universitätsmedizin Berlin (study ID: EA1 183 19). This study was supported by the BMBF (Bundesministerium für Bildung und Forschung) / DZHK (German Centre for Cardiovascular Research) via project FKZ81Z0100208 and complies with the declaration of Helsinki. The authors declare no competing interests. We thank Siemens Healthcare GmbH for providing the work-in-progress sequences for 2D Flow realtimeReferences
(1) Kilner PJ, Gatehouse PD, Firmin DN. Flow measurement by magnetic resonance: a unique asses worth optimising. J Cardiovasc Magn Reson 2007;9(4):723-8.
(2) Zange L, Muehlberg F, Blaszczyk E, et al. Quantification in cardiovascular magnetic resonance: agreement of software from three different vendors on assessment of left ventricular function, 2D flow and parametric mapping. J Cardiovasc Magn Reson 2019;21(1):12. DOI: 10.1186/s12968-019-0522-y.
(3) Traber J, Wurche L, Dieringer MA, et al. Real-time phase contrast magnetic resonance imaging for assessment of haemodynamics: from phantom to patients. Eur Radiol 2016;26(4):986-96. DOI: 10.1007/s00330-015-3897-7.
(4) Lotz J, Meier C, Leppert A, Galanski M. Cardiovascular Flow Measurement with Phase-Contrast MR Imaging: Basic Facts and Implementation. RadioGraphics 2002;22:651-671.
Figures