3405
Stepwise validation of Perfusion MRI Kinetic Modeling using an Extracorporeal Circulation for AIF determination in Mice1European Institute for Molecular Imaging, University of Münster, Münster, Germany, 2Department for Nuclear Medicine, University Hospital Münster, Münster, Germany, 3Translational Research Imaging Center, Clinic of Radiology, University of Münster, Münster, Germany, 4Institute of Inorganic and Analytical Chemistry, University of Münster, Münster, Germany
Synopsis
Keywords: Quantitative Imaging, Perfusion
Calculation of perfusion parameters from DCE-MRI using pharmacokinetic modeling depends on accurate determination of the dynamic tissue concentration and the dynamic arterial blood concentration (AIF). However, precise AIFs are difficult to measure in small animals. We introduce a novel extracorporeal circulation approach from the external carotid artery for feasible AIF determination. DCE derived AIF and tissue contrast agent concentrations corresponded well with radioactive analogs and mass spectrometry. Perfusion parameters derived by different pharmacokinetic models demonstrated variable agreement with simultaneous radiotracer derived calculations of modeling parameters. Overall, we introduce an accurate and precise framework for quantitative perfusion MRI in small animals.INTRODUCTION
Calculation of perfusion parameters from DCE-MRI using pharmacokinetic modeling (PKM) depends on the accurate determination of the dynamic tissue concentration and the dynamic arterial blood concentration (arterial input function, AIF). Particularly precise AIFs are difficult to measure in small animals. Extracorporeal AIF measurements from the femoral artery may provide a solution but require delay and dispersion correction and validation remains lacking1. Here, we introduce a novel access way from the external carotid artery with likely negligible delay and dispersion. We show extensive validation of each step of this DCE MRI and pharmacokinetic modeling (PKM) framework using radioactive agents and mass spectrometry to set a basis for quantitatively robust perfusion MRI in small animals.METHODS
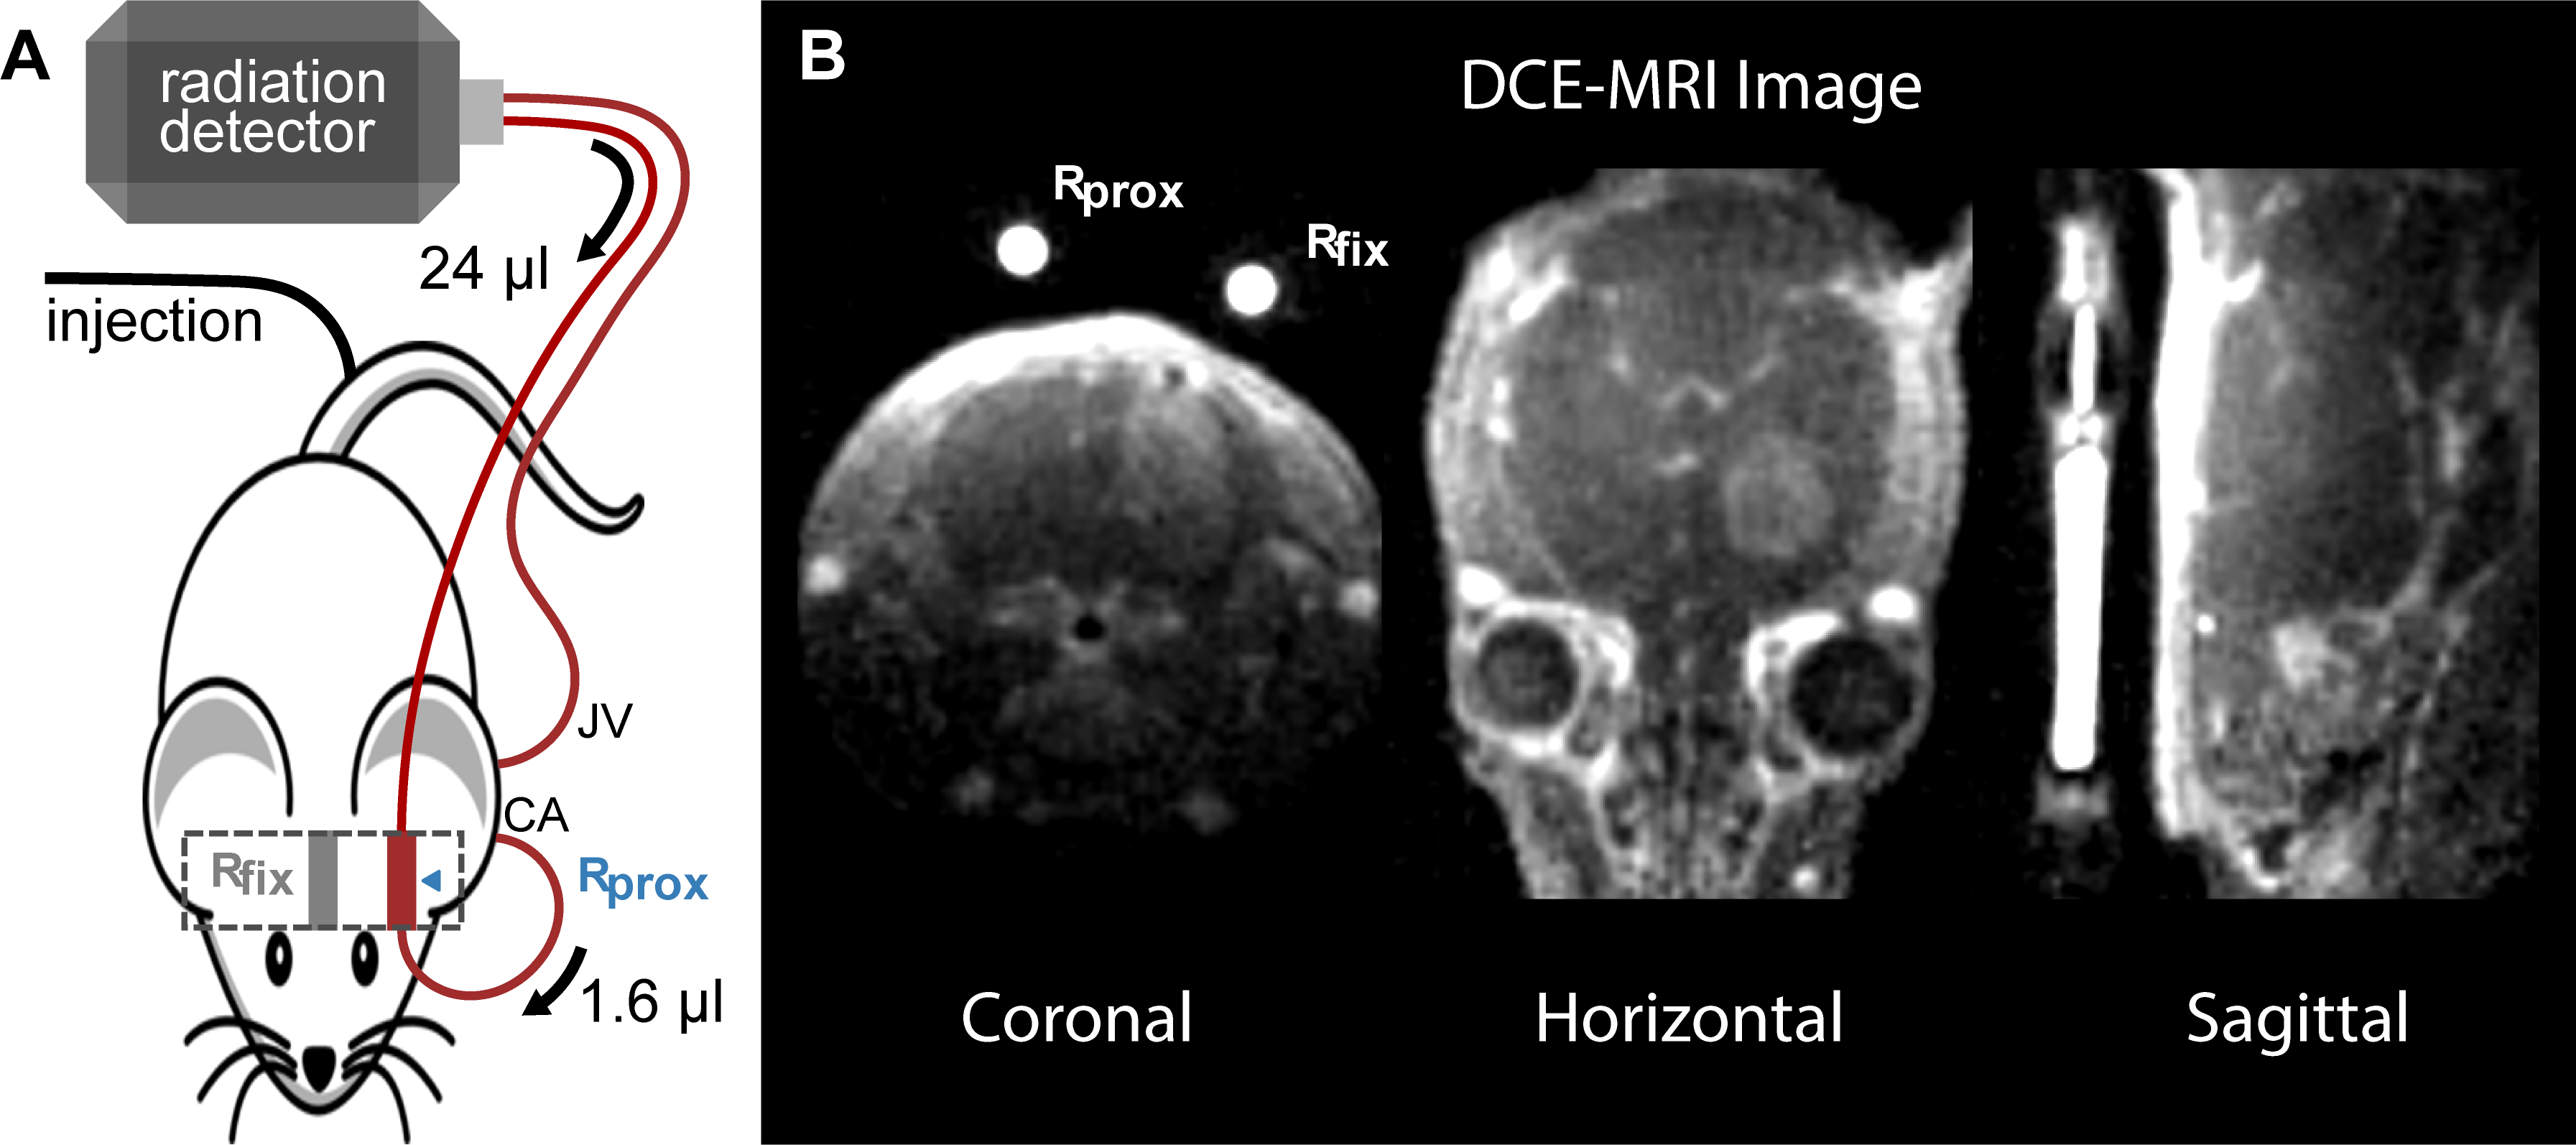
Overall 25 NMRI U87 intracranial glioma bearing nude mice were measured in a 9.4 T Bruker BioSpec MRI. In 100 µl, either 35 mM Gd-DO3A-butrol (Gadovist) or Gd-DTPA (Magnevist) were mixed with their radioactive analogs 68Ga-DO3A-butrol (5.8 ± 2.8 MBq) or 99mTc-DTPA (24.2 ± 1.3 MBq) or with 99mTc-labeled red blood cells (13.7 ± 2.7 MBq) or 99mTc-labeled human serum albumin (13.6 ± 0.4 MBq) and simultaneously injected. An extracorporeal circulation was applied shunting the blood from the external carotid artery to the ipsilateral internal jugular vein. At 1.6 µl volumetric distance to the carotid artery, the circulation featured an MR measurement reservoir . Further downstream, blood radioactivity was assessed using an MR compatible measuring unit (Swisstrace, Twilite). A Golden-angle Radial Sparse Parallel (GRASP) sequence (0.195 x 0.195 x 0.195 mm3, 5 s/frame, TR/TE 4/0.011 ms, FA 13.4°)2, combined with a compressed sensing MP2RAGE sequence for T1 mapping (0.195 x 0.195 x 0.195 mm3, TI1/TI2/MP2RAGE TR = 800 ms/2200 ms/6250 ms, TE/TR = 3.253/7 ms, FA 7°)3, was used for DCE-MRI (Figure 1). Contrast agent concentrations were calculated as previously described1 and were based on relaxation rates of r1 = 3.68 mM−1s−1 for Gadovist4 and r1 = 2.94 mM−1s−1 for Magnevist5. T1 values were individually measured for extracorporeal blood and for tissue. DCE scanning time was approximately 15.5 min. After sacrifice, brains were acutely harvested, sliced and mapped with autoradiography (n=15) and laser ablation-inductively coupled plasma-mass spectrometry (LA-ICP-MS) (n=5). Autoradiography slices were quantified by a simultaneously measured standard6. Plasma distribution volume was calculated based either on 99mTc-labeled red blood cells (RBC) or 99mTc-labelled human serum albumin (HSA) and hematocrit6. Subsequently, voxel wise pharmacokinetic modeling was performed with the software rocketship7 using the extended tofts model (ETM) and the two compartment exchange model (2CXM).RESULTS
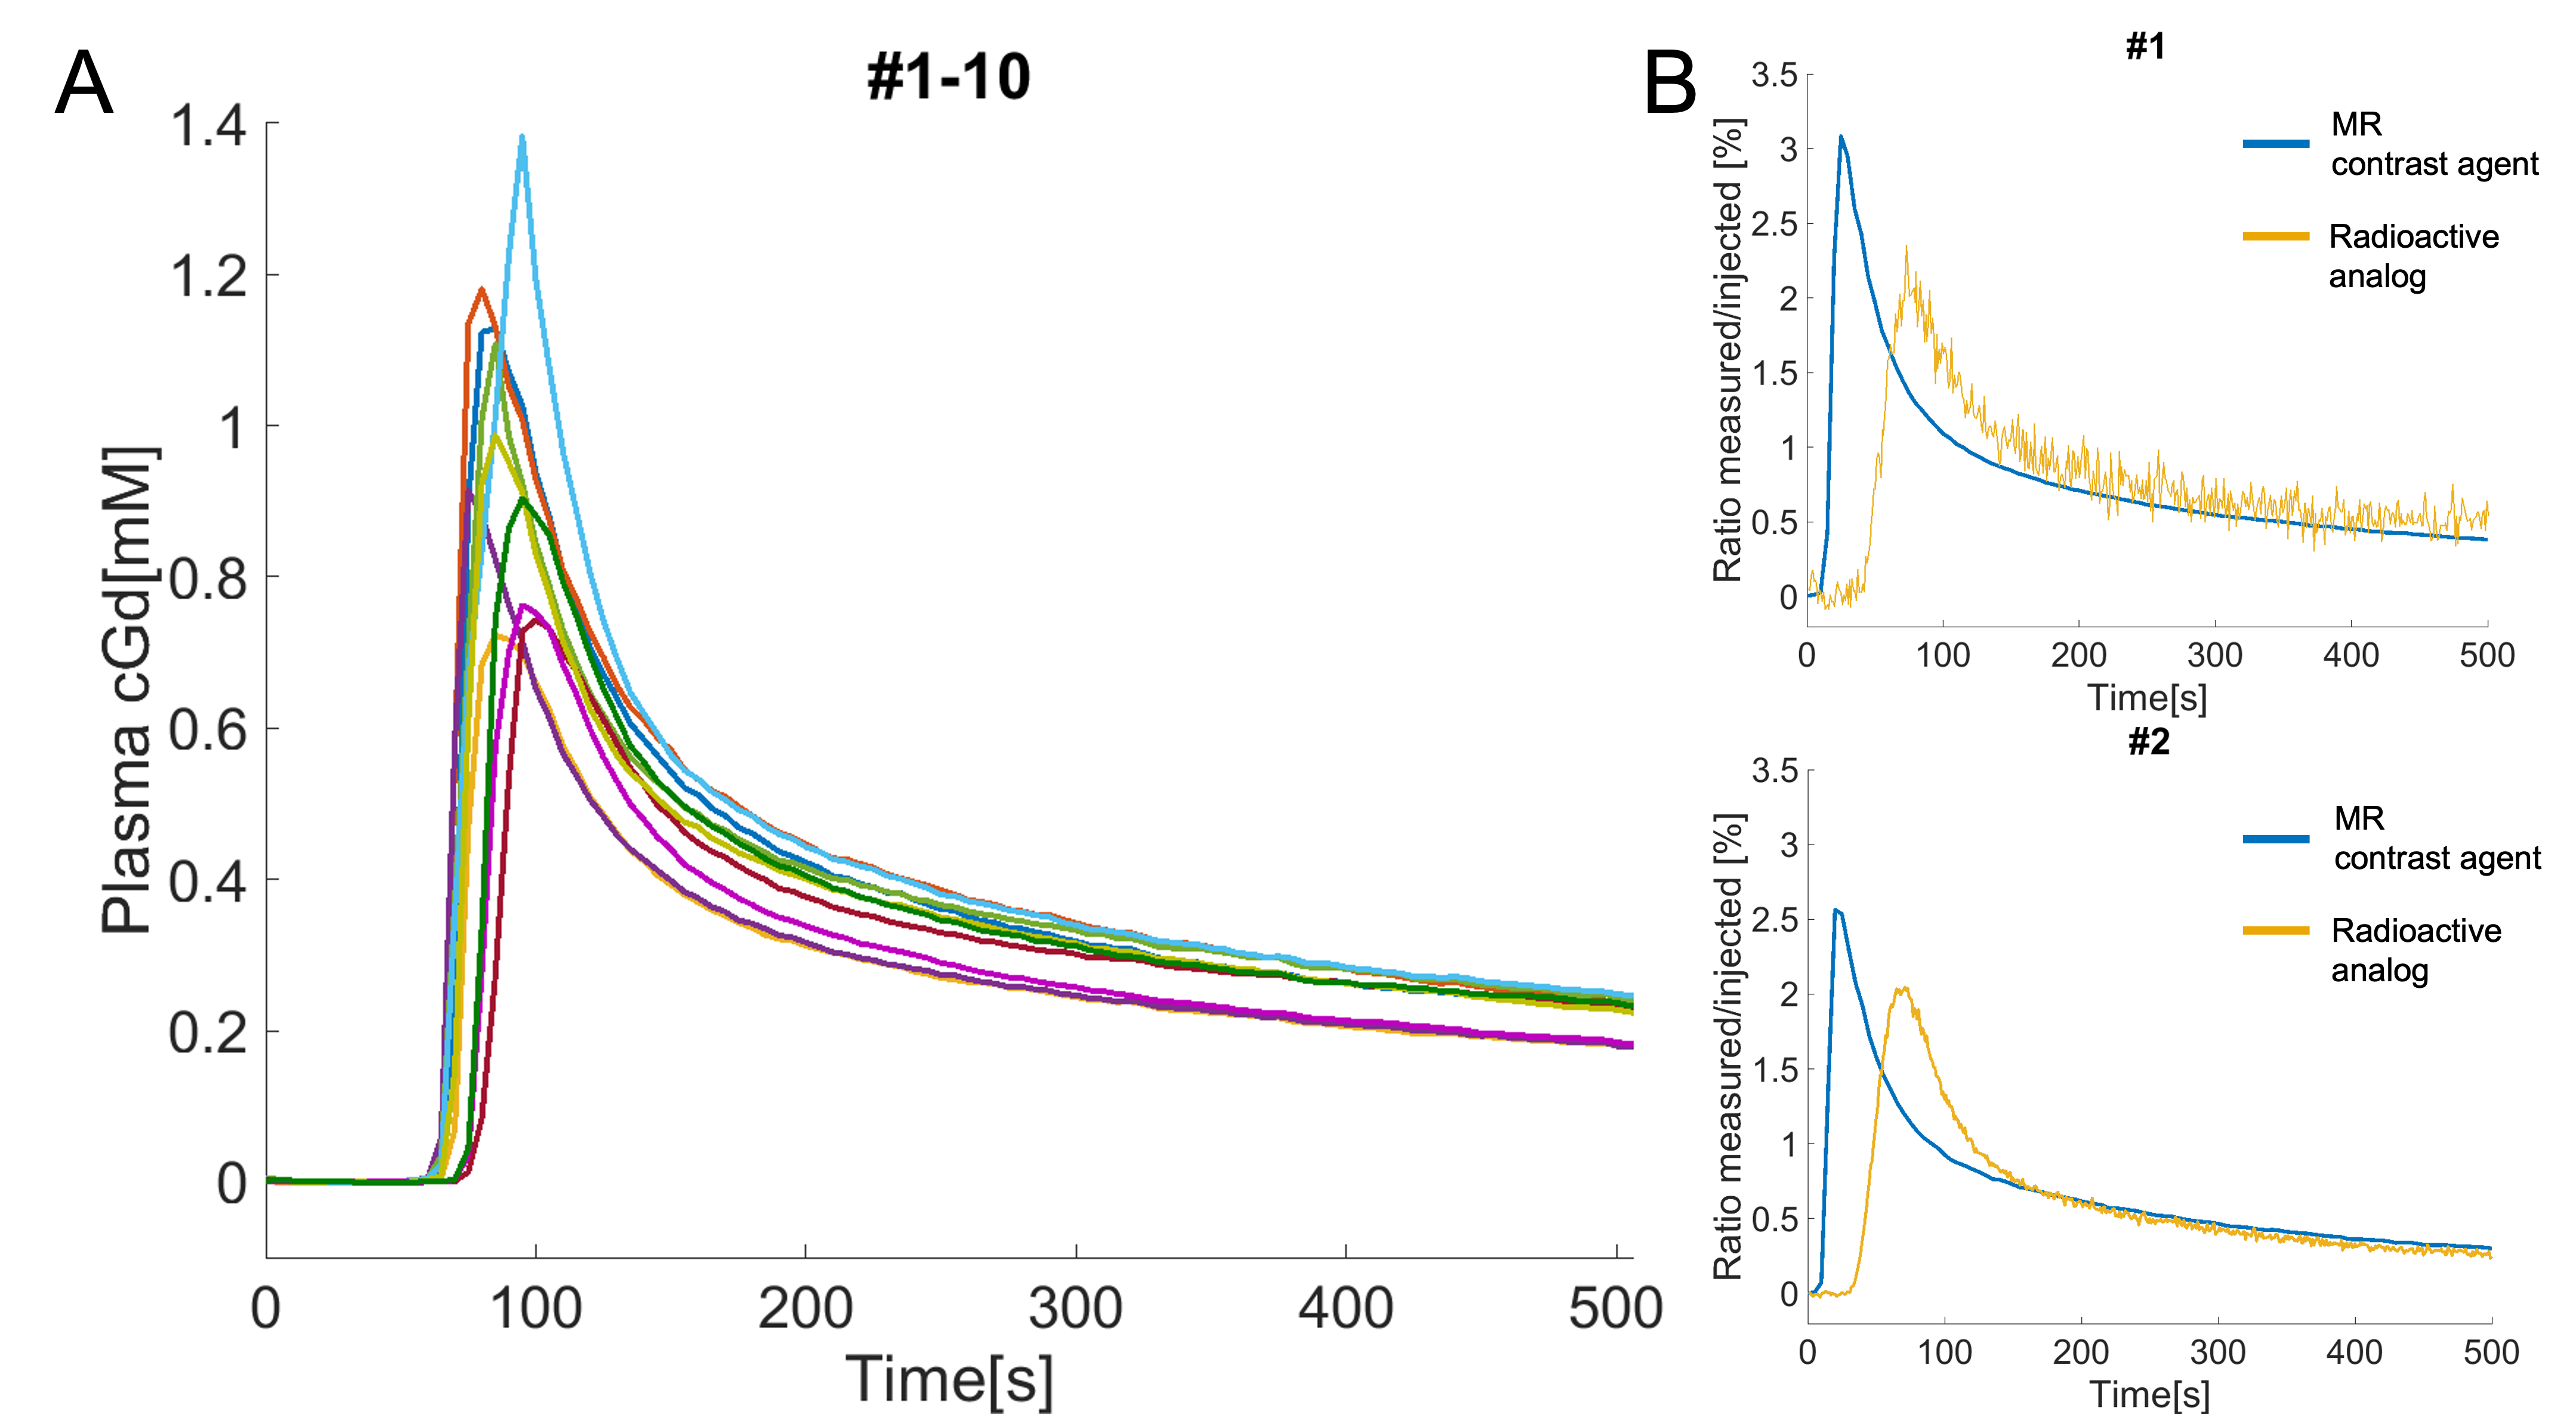
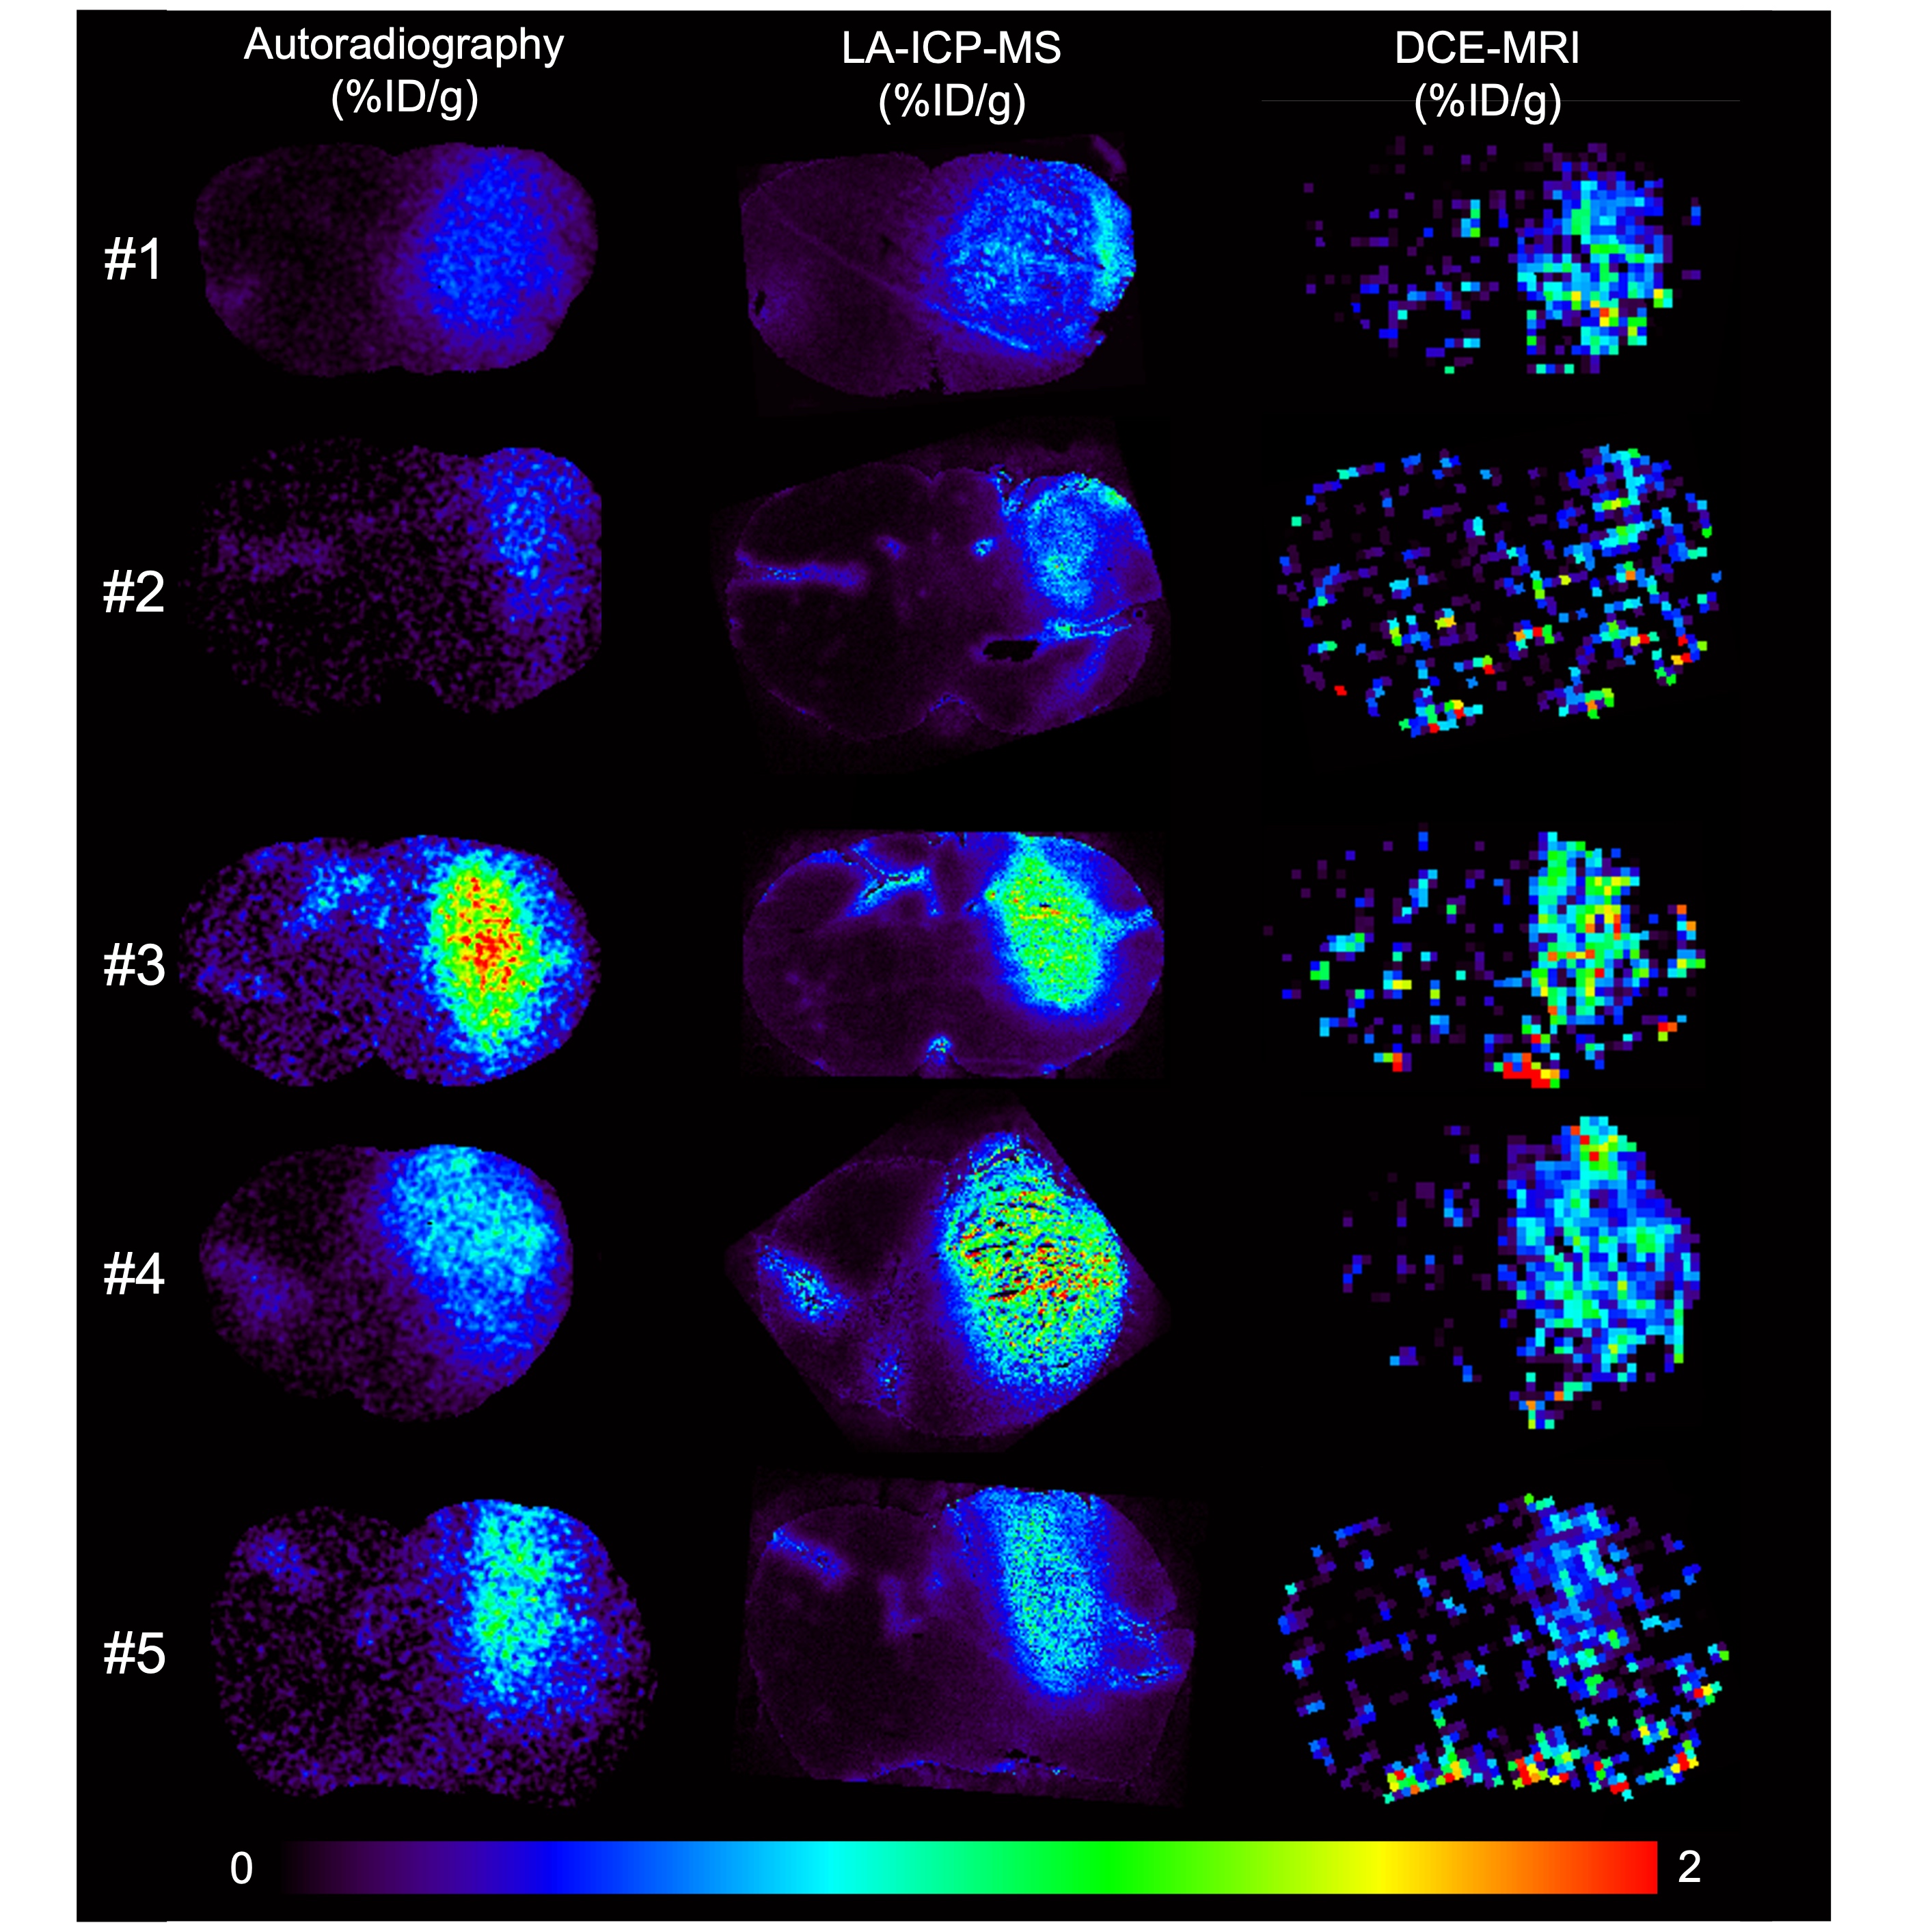
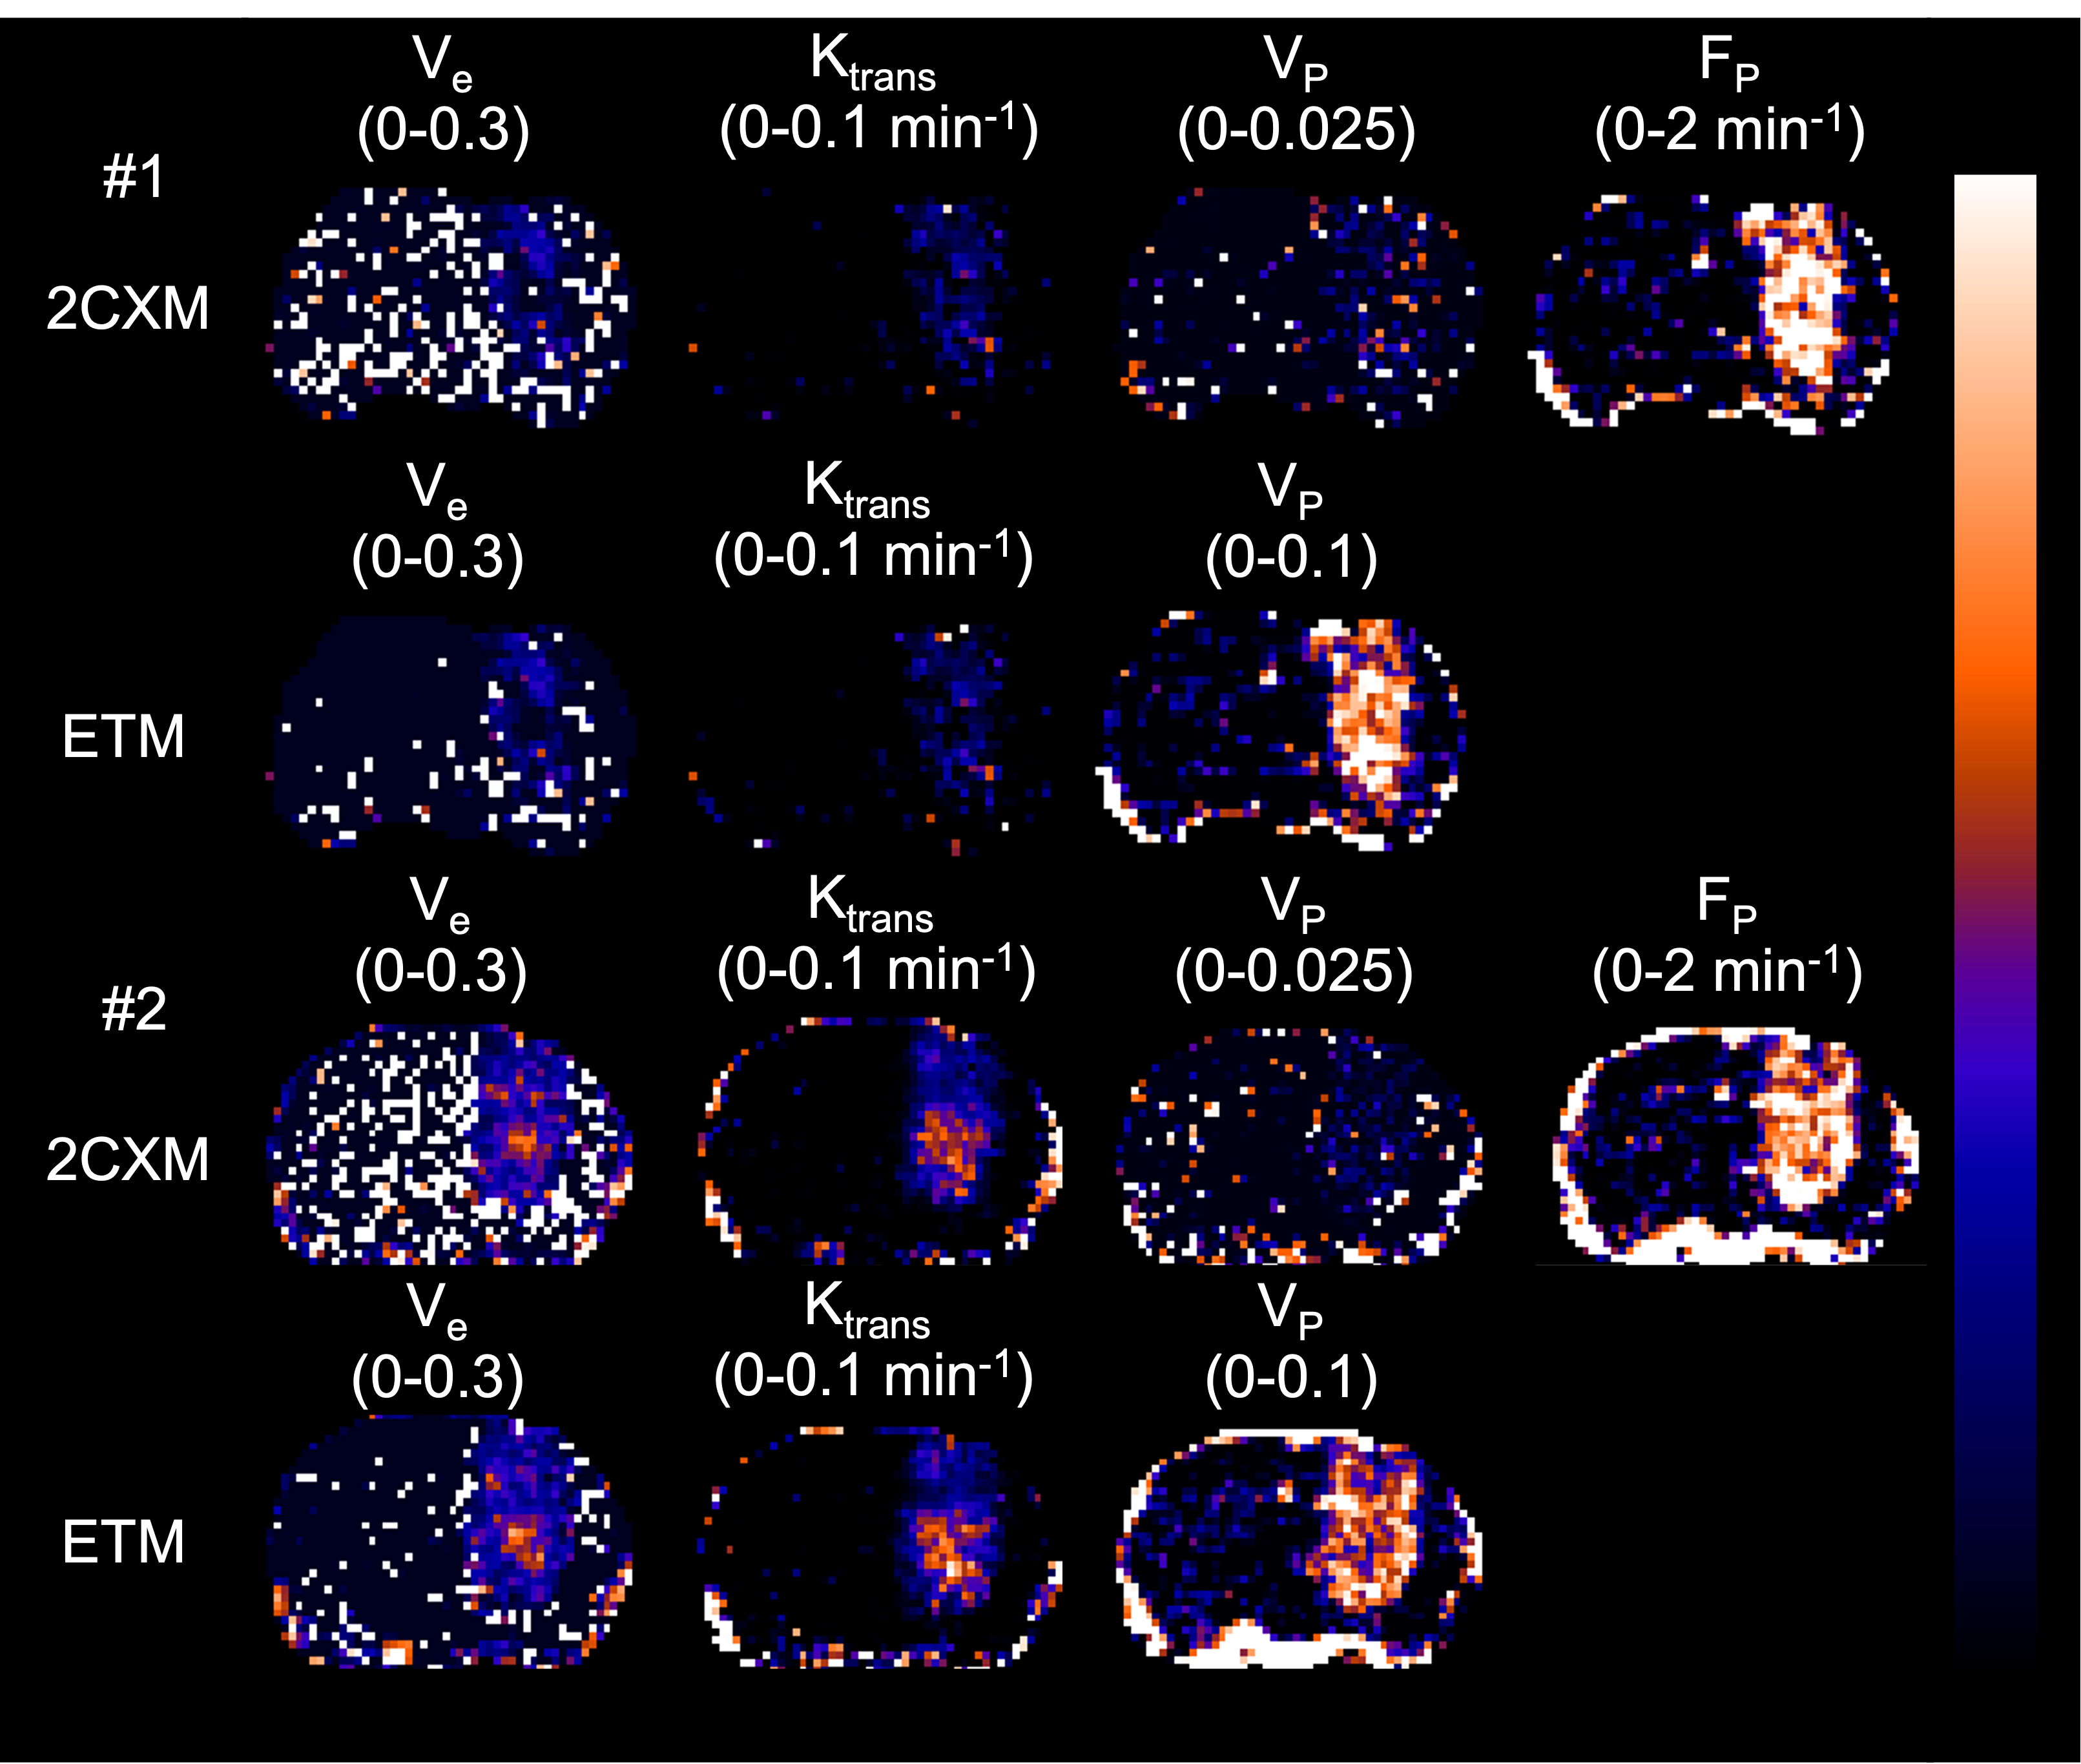
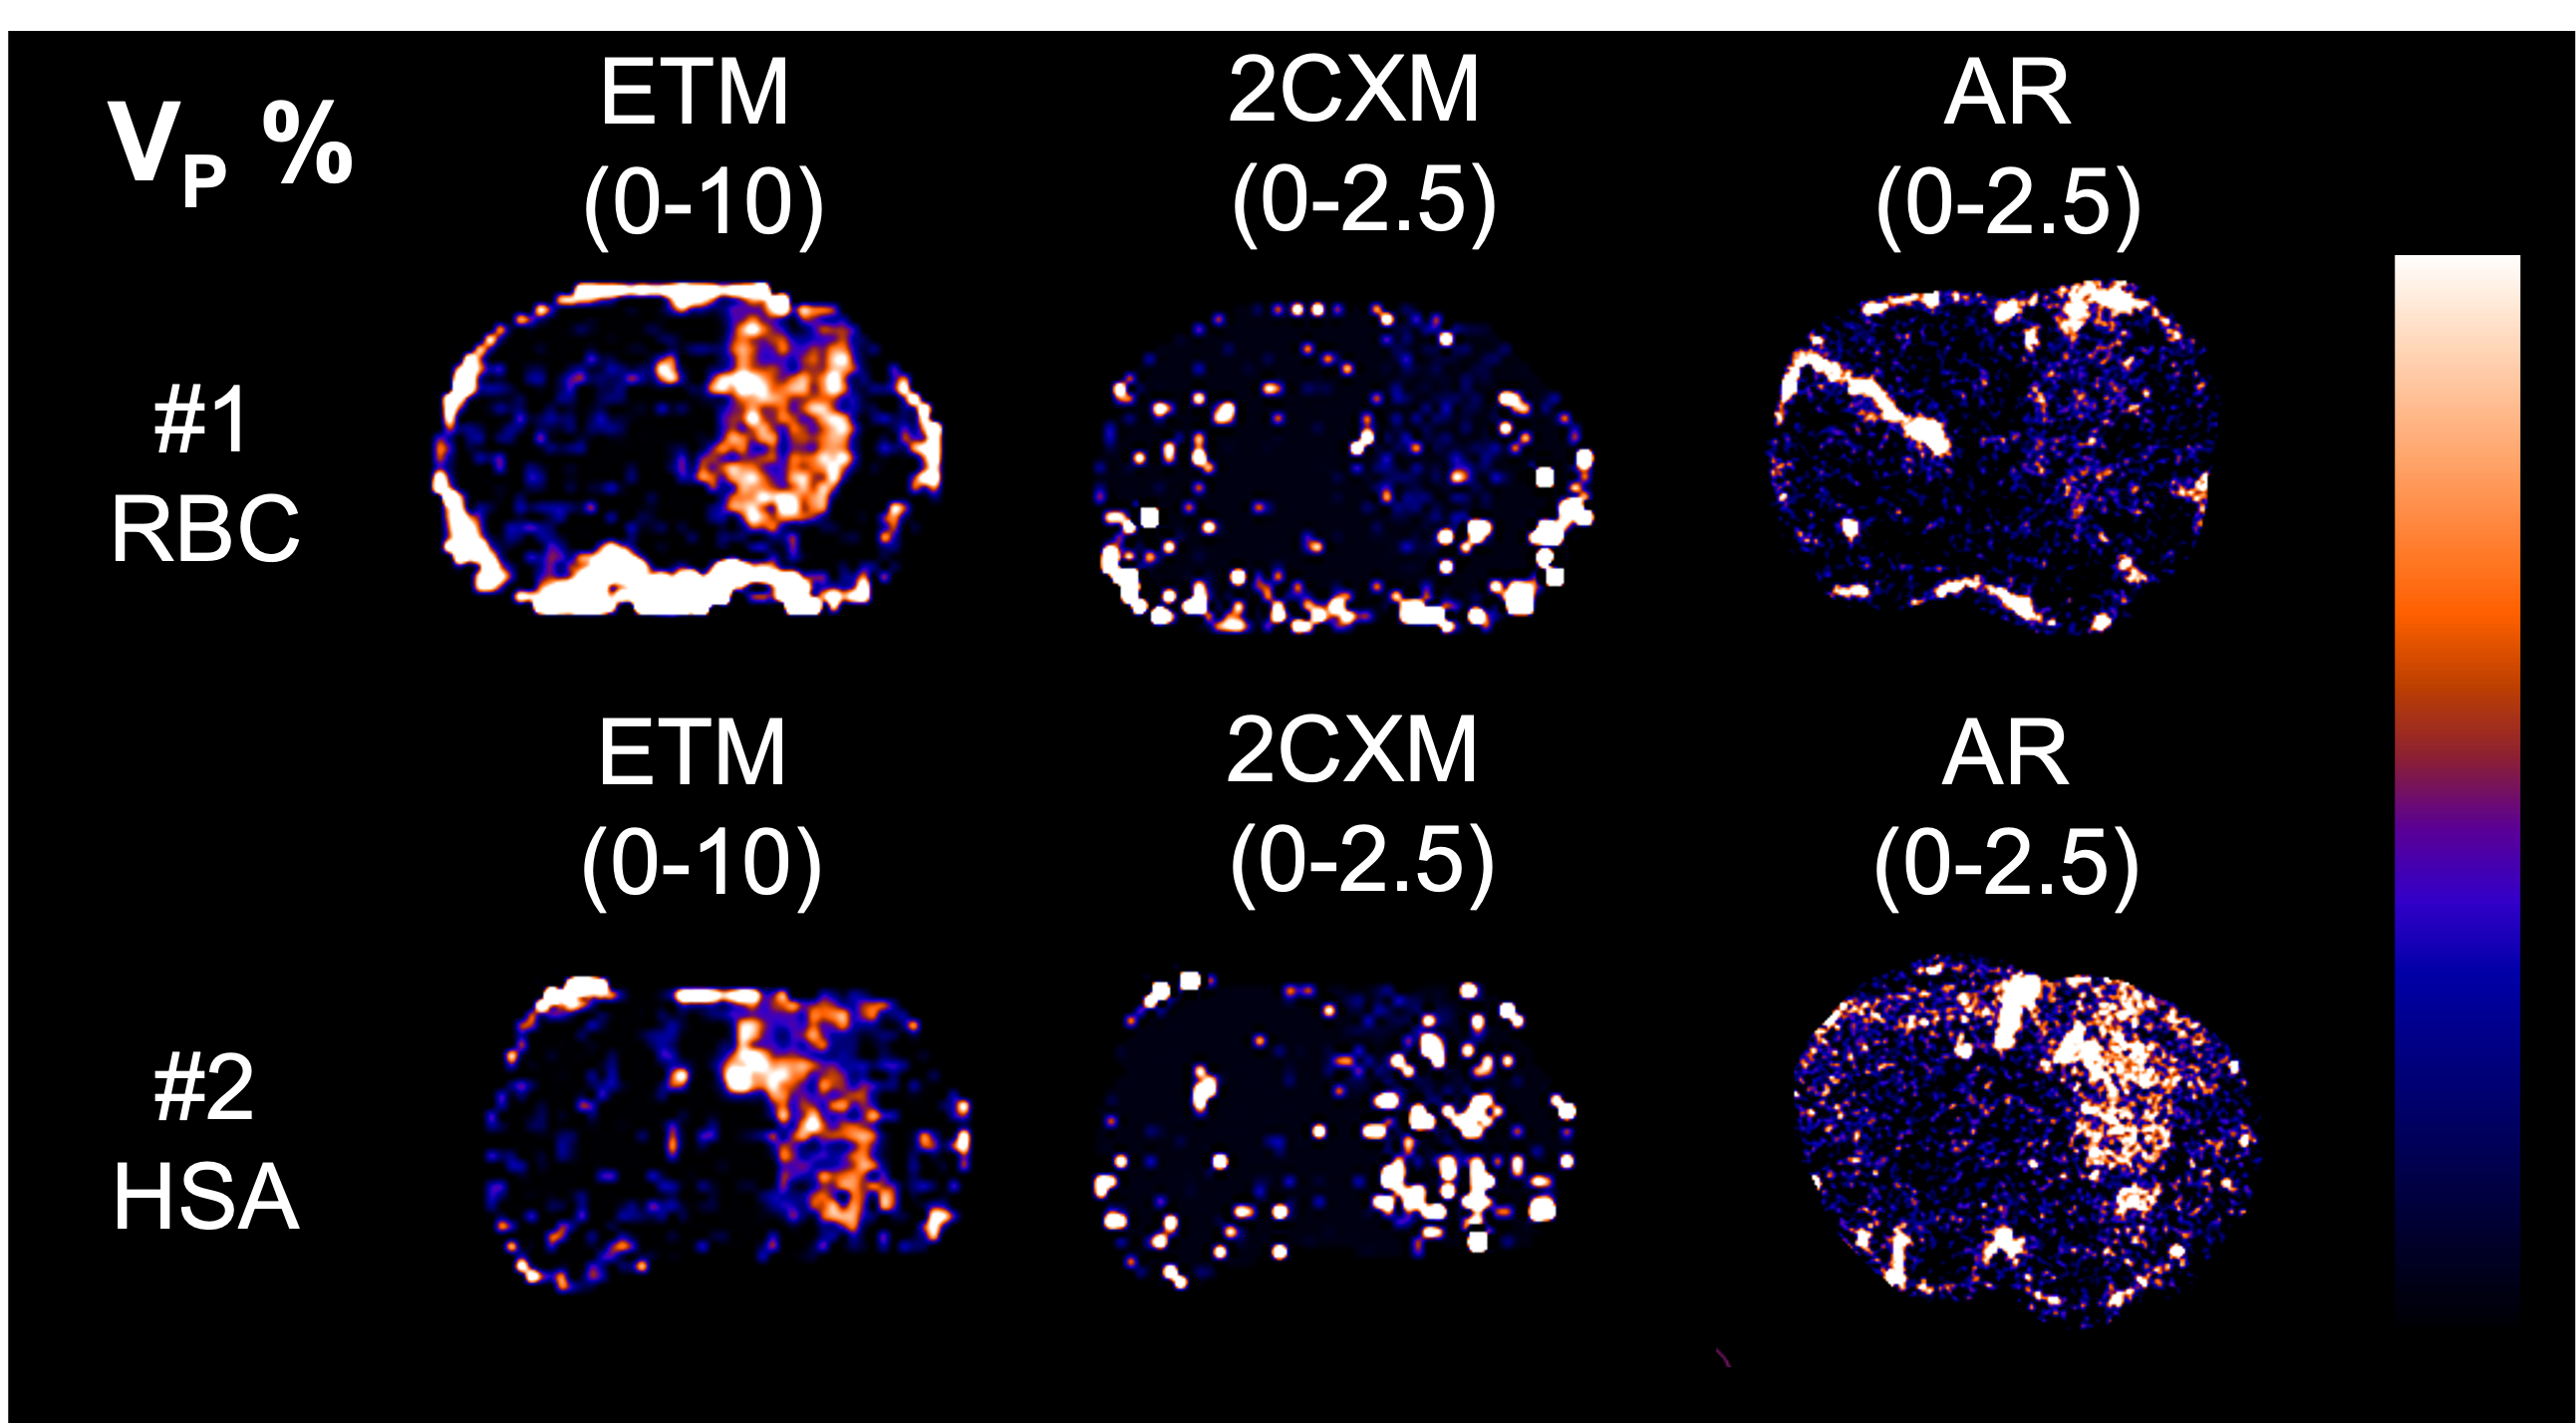
In 6 mice, mean blood c[Gd] extracted from the extracorporeal circulation at the end of the measurement was 0.28 ± 0.08 %ID/g determined by MRI and 0.29 ± 0.08 %ID/g determined by gamma counting together with 0.28 ± 0.08 %ID/g by ICP-MS. AIFs showed a high degree of visual correspondence in consideration of the delay and dispersion resulting from the longer extracorporeal traveling distance to the radiation detector (Figure 2). In 5 mice, calculation of mean tissue c[Gd] for tumor ROIs based on DCE-MRI resulted in values of 0.55 ± 0.18 %ID/g whereas same ROIs showed 0.60 ± 0.16 %ID/g for autoradiography of co-injected radioactive analogs and 0.72 ± 0.16 %ID/g for LA-ICP-MS (Figure 3). Parametric maps of the extravascular extracellular space fractional volume ve, the volume transfer constant Ktrans, and the plasma flow FP showed plausible values in comparison to previous studies1 (Figure 4). Only minor differences were found between the parameters ve and Ktrans comparing the ETM and the 2CXM. However, Vp was highly different between the two models and ~5-fold higher in the ETM compared to the 2XCM. Analysis of autoradiography of acute slices of 99mTc labelled RBC and HSA demonstrated estimations of Vp that were ~2-fold lower for RBCs compared to HSA in tumors. The absolute autoradiography estimates of both radiotracers for Vp more closely matched with the modeling results of the 2XCM compared to the values of the ETM (Figure 5).DISCUSSION
Dynamic validation of the DCE-MRI AIF with radioactive analogs demonstrated high correspondence indicating quantitative accuracy of our extracorporeal circulation approach. Shunting blood from the external carotid artery as opposed to the previously used femoral artery1 resulted in a much smaller artificially introduced delay and dispersion, which may obviate the need for correction. End-of-measurement validation of MR CA concentration in tumor and healthy tissue with radioactive analogues and LA-ICP-MS also showed good agreement between DCE and ex-vivo methods. In our preliminary PKM analysis, the encountered realistic values for ve, Ktrans, and FP underline the appropriateness of measured AIFs and tissue CA concentrations and make a strong impact of dispersion on the extracorporeal AIF unlikely. With autoradiography for determination of Vp, we were able to test the appropriateness of different DCE-models to quantify Vp, which was highly different comparing the 2CXM and ETM. Our results point toward a better match of radiotracer derived Vp with the 2XCM.CONCLUSION
Stepwise validation of perfusion MRI using contrast agent analogs for AIF determination combined with radiotracers and mass spectrometry for comparison of tissue concentration and parameter maps pointed toward high quantitative accuracy using our small animal DCE-MRI framework employing an external carotid artery shunt for AIF determination without delay and dispersion correction.Acknowledgements
The Project was supported by the SFB CRC 1450 and the DFG-NAMT application 446292030 of Dr. med Philipp Backhaus. The project critically relied on support of technical staff, especially Roman Priebe, Dirk Reinhardt, Nina Kreienkamp and Irmgard Hoppe. Furthermore, we thank Zhang et al. and Trotier et al. for providing DCE and T1-mapping sequences.References
1. Backhaus P, Büther F, Wachsmuth L, et al. Toward precise arterial input functions derived from DCE‐MRI through a novel extracorporeal circulation approach in mice. Magnetic Resonance in Medicine. 2020;84:1404-1415.
2. Trotier AJ, Rapacchi S, Faller TL, Miraux S, Ribot EJ. Compressed-Sensing MP2RAGE sequence: Application to the detection of brain metastases in mice at 7T. Magnetic Resonance in Medicine. 2019;81:551-559.
3. Zhang J, Feng L, Otazo R, Kim SG. Rapid dynamic contrast-enhanced MRI for small animals at 7T using 3D ultra-short echo time and golden-angle radial sparse parallel MRI. Magnetic Resonance in Medicine. 2019;81:140-152.
4. Saito T, Hitchens TK, Foley LM, et al. Functional and histologic imaging of urinary bladder wall after exposure to psychological stress and protamine sulfate. Scientific Reports. 2021;11:19440.
5. Varga-Szemes A, Kiss P, Rab A, et al. In Vitro Longitudinal Relaxivity Profile of Gd(ABE-DTTA), an Investigational Magnetic Resonance Imaging Contrast Agent. PLoS One. 2016;11:149260.
6. Broisat A, Lemasson B, Ahmadi M, et al. Mapping of brain tissue hematocrit in glioma and acute stroke using a dual autoradiography approach. Scientific Reports. 2018;8:9878.
7. Barnes SR, Ng TS, Santa-Maria N, Montagne A, Zlokovic BV, Jacobs RE. ROCKETSHIP: a flexible and modular software tool for the planning, processing and analysis of dynamic MRI studies. BMC Medical Imaging. 2015;15:19.
Figures