3404
Quantification of Spatial Ventilation Defect Distribution in Hyperpolarized Gas MRI of Lungs Using A 3D Clustering Algorithm
Gabriela Maria Garcia Delgado1, Ummul Afia Shammi1, Talissa Ann Altes2, John P Mugler III3,4, and Robert Paul Thomen1,2
1Biomedical, Biological and Chemical Engineering, University of Missouri, Columbia, MO, United States, 2Radiology, School of Medicine, University of Missouri, 65201, MO, United States, 3Radiology and Medical Imaging, School of Medicine, University of Virginia, Charlottesville, VA, United States, 4Biomedical Engineering, University of Virginia, Charlottesville, VA, United States
1Biomedical, Biological and Chemical Engineering, University of Missouri, Columbia, MO, United States, 2Radiology, School of Medicine, University of Missouri, 65201, MO, United States, 3Radiology and Medical Imaging, School of Medicine, University of Virginia, Charlottesville, VA, United States, 4Biomedical Engineering, University of Virginia, Charlottesville, VA, United States
Synopsis
Keywords: Quantitative Imaging, Hyperpolarized MR (Gas), Body, Lung, Contrast Mechanisms, Data Analysis
Hyperpolarized gas (HPG) MR imaging allows for quantification of a patient’s lung function. The spatial distribution of ventilation defect patterns is often overlooked in quantitative analyses but may be important for further understanding the nature of lung disease. Here we present a method for quantifying the extent to which defect voxels tend to be sparsely distributed or clustered. This technique involves spherical region-growing for each defect voxel to assess the fraction of neighbors which are also part of a defect. A ‘clustering index’ is reported which quantifies the extent to which defect voxels are spatially congregated or scattered.Introduction
Hyperpolarized gas (HPG) MR imaging is a powerful tool that shows lung structure and function with regional specificity, allowing for quantification of the percentage of a patient’s lung volume that is poorly ventilated: the ventilation defect percentage (VDP)1. However, VDP does not provide information related to the spatial distribution of these defects, which may be useful in understanding regional defect distribution across lung diseases and possibly reflect the extent to which large and/or small airways may be responsible for poor ventilation. Expanding on an approach introduced by Valk et al.2 we have developed an algorithm that quantifies the 3D spatial ‘clustering’ of defect voxels within the lung and reports a whole-lung clustering index (CI) indicative of the degree to which defects are sparse (low CI) or focal (high CI). We validated the accuracy of the technique using synthesized ideal defect data. We hypothesized that calculated CI would reflect a visual assessment of spatial defect clustering, and so examined HPG data of subjects with lung diseases. Differences in CI were seen in subjects with similar and different VDP values.Methods
This algorithm accepts a binary 3D array indicating locations of defect voxels and a vector specifying voxel dimensions; it returns a 3D array wherein each defect voxel is assigned a ‘clustering value’ calculated as follows. For each defect voxel (Figure 1a), a spherical contour is expanded until the fraction of defect voxels within the sphere falls below 50% of the total voxels inside the sphere (Figure 1b). The sphere volume at this threshold is then recorded in the active voxel location in the output array as that voxel’s cluster value (CV) (Figure 1c). The process is then repeated for the remaining defect voxels (Figure 1d). The mean cluster value across the whole lung, normalized to the subject’s total lung volume, is defined as the subject’s cluster index (CI).Ideal data was synthesized to assess and confirm how cluster values vary with different spatial distributions of defects. The synthesized data consisted of binary spherical defects ranging in radii of 3 to 14 voxels, with spheres composed of 100 binary, randomized scattered defects. Cluster maps were obtained and the maximum cluster value in the array examined since it relates to the defect radius by CV = 21/3R (Figure 2a).
CI analysis was also performed on 16 sets of HPG images in subjects with asthma and cystic fibrosis (CF) (mean age 46.4± 18.7): 2D multi-slice GRE 3 (Figure 3a, b): TR=9.7-12 ms, TE=1 ms, flip angle=9-11°, voxel size=2.5-3.9 mm in-plane, 15 mm slice thickness, bandwidth of 170-391 Hz/pixel.
Results
Examples of different synthesized spherical defect patterns are shown in Figure 2a with corresponding CI maps that were constructed. A plot of the different spherical defect radii and spherical scattered defects showing the maximum cluster value versus defect sphere radius is seen in Figure 2b. As expected, the maximum cluster value increases linearly with slope of $$$\sqrt[3]{2}$$$ (m = 1.25). The spheres of scattered defect clusters show linear increase in maximum cluster value with slope corresponding to the fraction of spherical volume contained therein (m = 0.7053). These graphs demonstrate the expected behavior that more sparsely distributed defects yield lower CI.Example HPG images and CI maps from 3 subjects are presented in Figure 3a alongside a scatter plot of CI vs VDP for each patient. CI was taken for subject data to account for all ‘cluster values’ in lungs, where maximum cluster values of lungs with defects would show similar behavior to that of synthesized data. The algorithm can also quantify differences among cases of similar VDP but very different CI, demonstrating different clustering (Subject 1 versus Subject 2).
Discussion
The cluster analysis on synthesized data produced the expected linear outcomes and difference between dense versus sparse defect cluster schemes. As seen in Figures 3a and 3b, patients with similar VDP can have different CI, and therefore different distribution of defects. For example, Subject 1 and Subject 2 have similar VDP, 5.93% and 5.90%, respectively, however Subject 2’s CI is much higher: 0.72% vs 0.09% (recall that subject CI is normalized to the subject’s lung volume whereas results from synthetic data are not). Similarly, when comparing Subject 3 to Subjects 1 and 2, Subject 3 has the highest VDP of all three subjects at 14.14%, but the CI of Subject 3 (0.78%) is slightly higher than Subject 2’s CI (0.72%). Overall, the relationship between CI and VDP trends upward as expected.Conclusion
Clustering of regional defects in HPG MRI may be a distinguishing feature for different lung diseases and thus may be helpful in quantifying differences related to underlying pathophysiology where VDP alone is uninformative. This may be beneficial in assessing diseases characterized by multiple etiologies (e.g., airway hyperresponsiveness vs localized inflammation, etc.), and in monitoring regional treatment responses. Future work will involve further analysis on a larger sample size and the comparison of CI among lung diseases.Acknowledgements
Funded by NIH R01 HL152288References
- Thomen RP, Walkup LL, Roach DJ, Cleveland ZI, Clancy JP, Woods JC. Hyperpolarized 129Xe for investigation of mild cystic fibrosis lung disease in pediatric patients. J Cyst Fibros. 2017;16(2):275-82. doi: 10.1016/j.jcf.2016.07.008
- Valk, A, Willers, C, Shahim, K, et al. Defect distribution index: A novel metric for functional lung MRI in cystic fibrosis. Magn Reson Med. 2021; 86: 3224– 3235. https://doi.org/10.1002/mrm.28947
- Mugler, J.P., III and Altes, T.A. (2013), Hyperpolarized 129Xe MRI of the human lung. J. Magn. Reson. Imaging, 37: 313-331. https://doi.org/10.1002/jmri.23844
Figures
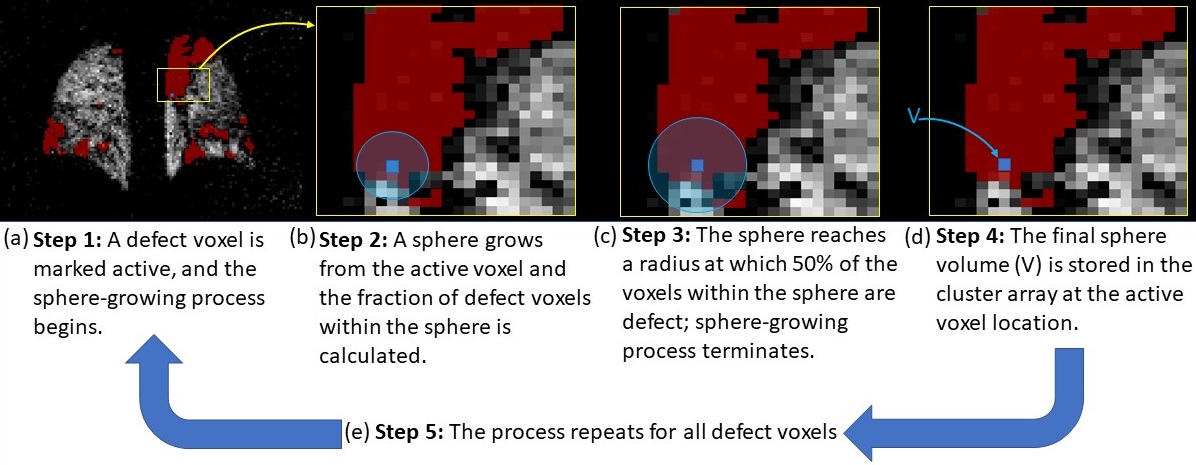
Illustration of the cluster quantification
algorithm
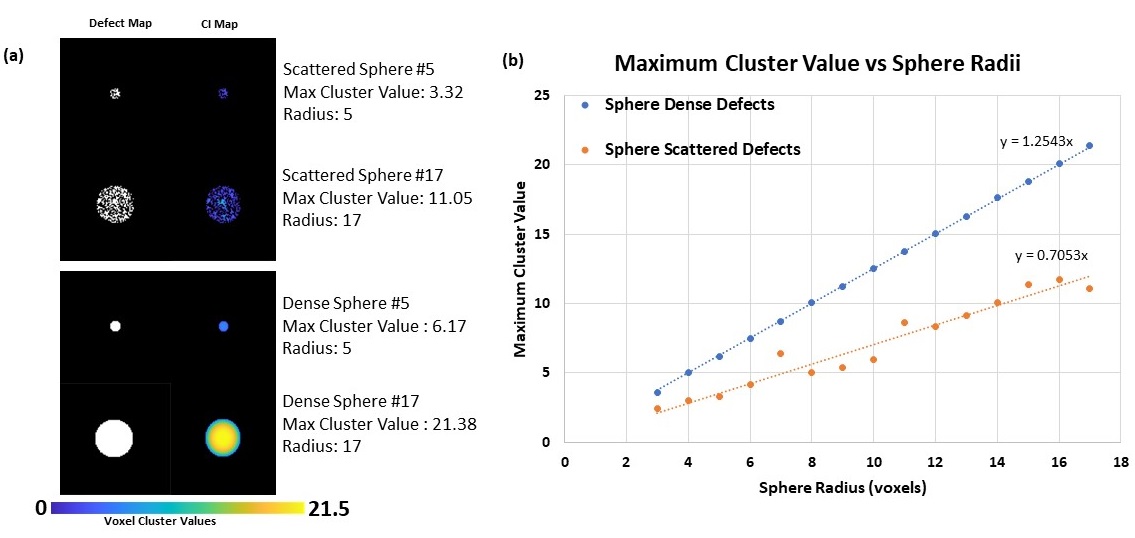
(a) Example of synthesized spherical scattered
defects with 50% defect voxels or spherical dense defects (100% defect voxels),
showing corresponding maximum cluster values and radii. (b) Plot of maximum
cluster value versus spherical radii of synthesized spherical defect pattern
data, with calculated linear fit equations.
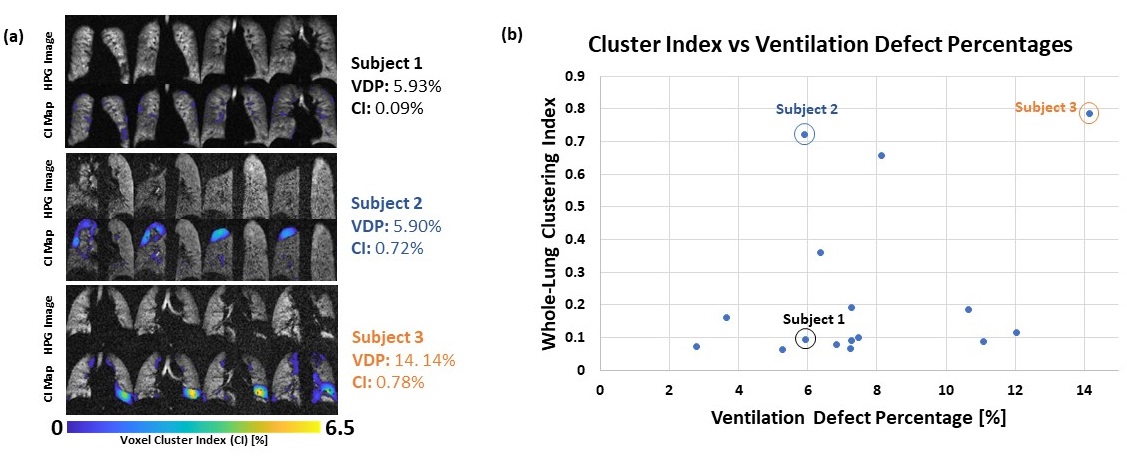
(a) Example HPG ventilation images of 2 subjects
with similar VDP and corresponding CI and a subject with higher VDP and
corresponding CI. VDP and whole-lung CI is reported on the right. (b) Plot of CI
versus VDP of lung disease data from 16 subjects.
DOI: https://doi.org/10.58530/2023/3404