3402
Deep learning assisted quantification of myocardial oxygen extraction fraction1Washington University in St. Louis, St. Louis, MO, United States
Synopsis
Keywords: Quantitative Imaging, Myocardium
A previously developed MRI method for quantitative myocardial oxygen extraction mapping showed promising results, but image quality suffered from distortion and inhomogeneity artifacts. A new deep learning-based approach was developed and tested in healthy subjects. This preliminary study showed excellent reproducibility and consistent myocardial oxygen extraction values with other reported data using positron emission tomography methods.Methods:
Sequence: A novel 2D Asymmetric-spin-echo (ASE) prepared balanced steady state free precession (SSFP) readout sequence with TE of 60 msec (ASEprep) was used for data acquisition. The ASE preparation module consists of 90o-180o-180o-90o RF pulses with alternate 0 and 180 o phase to reduce B0 and B1 inhomogeneity. The two 180o pulses shift t towards opposite directions to create an ASE signal (a single-shot acquisition). Sixteen images were acquired with 16 different t times. Image resolution was 1.7 x 1.7 mm2.
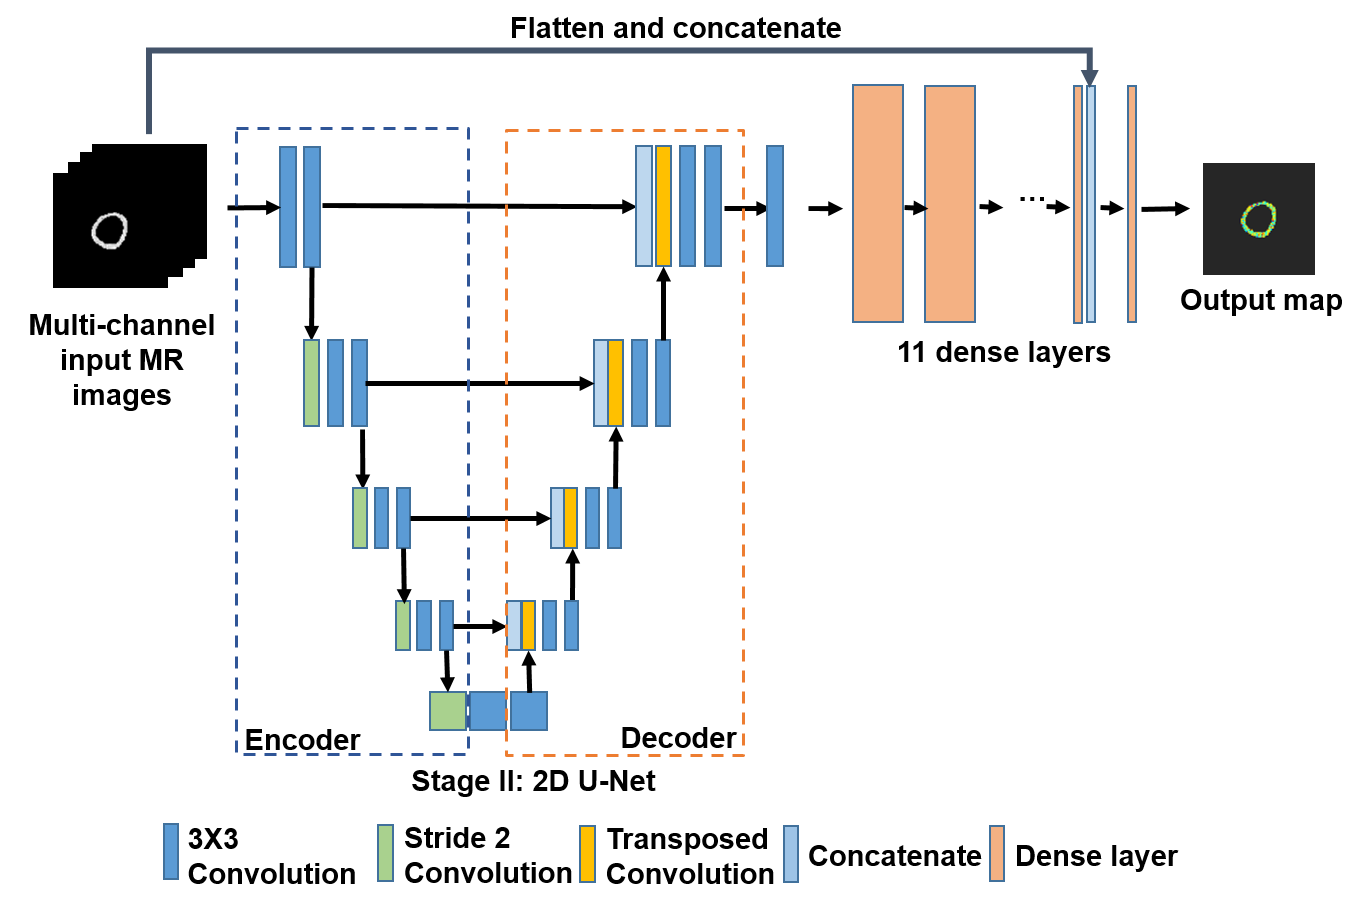
Deep learning method: In this study, ground truth mOEF maps were created with means of 0.3 to 0.8 and standard deviations of 0.05 to 0.15. Synthetic mOEF training sets were simulated using the theoretical model, 2,3 with consideration of various imperfect conditions, e.g., field inhomogeneity (-0.3 to 0.3 ppm) and Gaussian noise. According to ASEprep sequence, 16 repetitions of MR images corresponding to different t were simulated. A total of 1800 data sets of MR images and mOEF maps, both in the size of 128×128, were created. 80% of the data were used for training and rest of the data were used for testing. These simulated data were then used as input to accomplish pixel-wise regression task using a UNet-based fully connected neural network (UFCN). The structure of neural network is shown in Figure.1. The U-net structure was comprised of an encoder and a decoder. The encoder was composed of 5 convolutional blocks each with 64, 128, 256, 512, and 1024 convolutional filters. The decoder consisted of 4 deconvolutional blocks with 512, 256, 128 and 64 output channels. The output of UNet structure was flattened as the input of 11 dense layers. We evaluated the performance of our model with mean square error (MSE) on test set. To validate the reproducibility of UFCN model, two training sets were created to obtain two trained models, which were then evaluated for the performance.
Reproducibility study: Ten healthy volunteers (24 – 30 years old, 5F) were recruited for the evaluation of the CMR method at two different days (D1 and D2). The study was performed at a 3T Prisma Siemens MR system (Siemens Healthcare, Malvern, PA). The CMR mOEF measurements was performed along short-axis using the ASEprep sequences. Each subject was scanned at three slices along short-axis view: basal, mid, and apex. The mOEF maps were derived with the custom-made software program developed from the deep-learning method. A 16-segment model was used for data analysis. The reproducibility was represented by the coefficient of variation (CV) between day 1 and day 2.
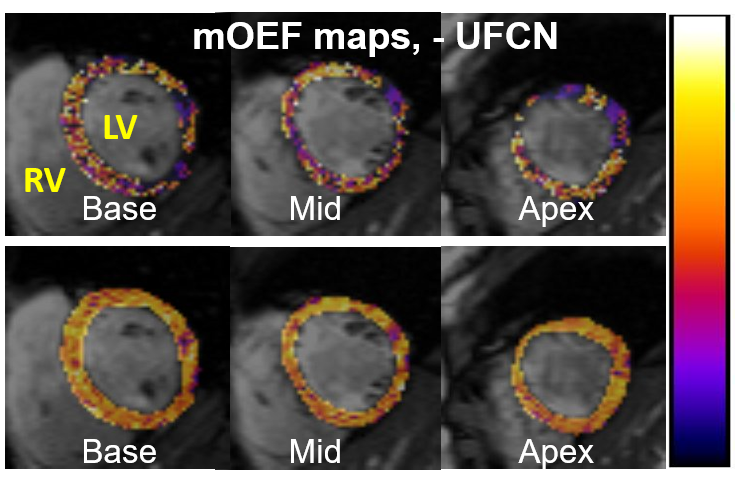
Results: The UFCN model yielded a MSE = 0.0032. The reproducibility evaluation of two trained model shows MSE of 0.0034 and 0.0031, respectively. In human study, the average global mOEF was 0.607 ± 0.043 on the day 1 and 0.613 ± 0.042 on the day 2, which agreed well with data measured by positron emission tomography.4. The CV was 2.21% [0.97%, 2.98%], which is consistent with previous result of 3.37% [0%, 6.3%] in septal segment.1 Figure 2 shows one case of three slices of mOEF maps, demonstrating much improved image quality with the deep learning UFCN method, compared to maps without UFCN. No significant difference in mOEF was shown among three slices, nor between male and female subjects.
Discussion & Conclusion: We have successfully developed a new deep learning approach to quantify mOEF to minimizing image distortion and inhomogeneity artifacts occurred with previous method. Excellent reproducibility was achieved in this initial study. Rigorous validation studies in animal and/or human are warranted prior to translational research in patients with myocardial metabolic dysfunction.
Acknowledgements
No acknowledgement found.References
1. Lu L, Eldeniz C, An H, et al. Quantification of myocardial oxygen extraction fraction: A proof‐of‐concept study[J]. Magnetic resonance in medicine, 2021, 85(6): 3318-3325.
2. Yablonskiy D A, Haacke E M. Theory of NMR signal behavior in magnetically inhomogeneous tissues: the static dephasing regime[J]. Magnetic resonance in medicine, 1994, 32(6): 749-763.
3. An H, Lin W. Quantitative measurements of cerebral blood oxygen saturation using magnetic resonance imaging[J]. Journal of Cerebral Blood Flow & Metabolism, 2000, 20(8): 1225-1236.
4. Kudomi N, Kalliokoski K K, Oikonen V J, et al. Myocardial blood flow and metabolic rate of oxygen measurement in the right and left ventricles at rest and during exercise using 15O-labeled compounds and PET[J]. Frontiers in physiology, 2019, 10: 741.
Figures