3401
Automating Component Selection in Independent Component Analysis (ICA) in dynamic Oxygen-Enhanced MRI (dOE-MRI)
Annika Hofmann1,2, Jennifer H.E. Baker3, Firas Moosvi4, and Stefan A Reinsberg2
1Department of Physics, TU Dortmund University, Dortmund, Germany, 2Department of Physics & Astronomy, University of British Columbia, Vancouver, BC, Canada, 3Radiation Biology Unit, British Columbia Cancer Research Centre, Vancouver, BC, Canada, 4Department of Computer Science, Mathematics, Physics and Statistics, University of British Columbia, Kelowna, BC, Canada
1Department of Physics, TU Dortmund University, Dortmund, Germany, 2Department of Physics & Astronomy, University of British Columbia, Vancouver, BC, Canada, 3Radiation Biology Unit, British Columbia Cancer Research Centre, Vancouver, BC, Canada, 4Department of Computer Science, Mathematics, Physics and Statistics, University of British Columbia, Kelowna, BC, Canada
Synopsis
Keywords: Quantitative Imaging, Cancer, Independent Component Analysis
Using Independent Component Analysis (ICA) in dynamic Oxygen-Enhanced MRI has been shown to improve the sensitivity of this technique. However, the ICA component has to be identified manually by an observer. In this work we propose an optimization process that automatically determines the best number of components and extracts the component in best accordance to the target function of the breathing challenge.Introduction
Dynamic oxygen enhanced MRI (dOE-MRI) uses changes in the oxygen level of tissues and blood during a period of excess oxygen breathing as contrast to indicate oxygenation. Using Independent Component Analysis (ICA; a computational technique first described by Hyvarinen in 19991) to analyze the change in image intensity following a cycling gas breathing challenge has been shown to improve the sensitivity of dOE-MRI in murine tumour models2. However, this analysis relies on an observer to manually determine the number of components and select the component in closest correspondence with the target function of the gas breathing challenge. Here we automate the component selection process using a metric that compares how closely the Fourier transform of an expected breathing challenge response approximated the Fourier transform of the observed, ICA-derived components. We demonstrate the application in tumour oxygenation analysis of dOE-MR imaged pancreatic patient-derived xenograft (PDX).Methods
Twenty-six mice each bearing one of three pancreatic PDX tumour models (Pancreas Centre BC) were scanned on a 7T Bruker BioSpec 70/30 scanner, using a volume transmit coil and a custom surface receive coil at the University of British Columbia MRI Research Center. A 2D Multi-Gradient Echo sequence was used to obtain T1- and T2*-weighted images, as well as calculate T2* and T1-dependent parameter maps. The dOE-MRI gas breathing challenge consisted of segments of two minutes each, starting with medical air, followed by a switch to 100% oxygen. The switch was performed remotely, operated by a gas mixer following a preprogrammed breathing paradigm, with a fluctuation of three cycles, over a total of 14 minutes. Independent Component Analysis (ICA) was applied over the Regions of Interest (ROI), using the sklearn.decomposition.FastICA machine learning algorithm3. The ICA was iterated for a range of number of components (n=2...20). The Wasserstein metric was used to calculate the distance between the Fourier transformed spectrum of every component with the Fourier transformed spectrum of the target function arising from the cyclic gas breathing challenge. The Wasserstein distance is a metric that allows the comparison of two different distributions. It can be described as the amount of work that is required to transform one distribution into the other4. For a given ICA, the component (and related dOE-MRI maps) with the lowest Wasserstein distance was chosen. In these maps, voxels are colored according to the contribution of each voxel to the signal intensity change over time.Results
Using the automated component detection, it is feasible to conduct a search over all ICAs, with the number of components out of a previously defined range. The result is the optimal number of components which includes the component trace with the lowest Wasserstein value. The program returns this optimal number of components as well as the component trace, that best aligns with the target function.It was observed consistently across most tumours (93.75%), that if the information corresponding to the oxygen challenge is present in the data, the program will return the correct component trace and is even more sensitive than a manual search by an experienced operator. However, the Wasserstein criterion will always identify a component with minimal distance even if a challenge function is, in fact, not present in the data.
Discussion
In this study we are proposing an alternative to the manual component selection process previously used by our group during ICA analysis of dOE-MRI. Using the Wasserstein distance as a metric for comparing two distributions, it is possible to extract the component that is in highest accordance with the target function originating from the cycling gas breathing challenge. Automation of the component finding process using the Wasserstein distance leads to great results in nearly all analyzed tumours, providing an objective measure for selection of the best fitting component from the data. However, occasional artifacts in the data require continued manual verification of individual results. These artifacts include greater value being placed on larger frequencies due to the nature of Fourier transforms, which leads to slow-moving trends tending to be favoured, returning a misleading component. Moreover, when no component is visible in the data, the algorithm still returns a result, making a manual review necessary. One potential solution is to define a cut-off value beyond which components are automatically disregarded.Conclusion
The proposed optimization of the selection process based on the principles of Fourier transformation and a distribution metric improves the process for ICA in combination with a cyclic oxygen challenge in dOE-MRI. This step resolves the long-standing issue of manual and potentially biased component selection in the analysis process and can be implemented to further optimize the workflow advancing the potential of dOE-MRI in tumour oxygenation determination. With this work we have proven its feasibility in a pre-clinical pancreatic PDX tumour model.Acknowledgements
We gratefully acknowledge the support of the Cancer Research Society Charlotte Légaré Memorial Fund as well as the NSERC Discovery Grant.References
1. Hyvärinen, A. Fast and Robust Fixed-Point Algorithms for Independent Component Analysis. IEEE Transactions on Neural Networks 10(3): 626-634 (1999).
2. Moosvi, F. et al. Fast and sensitive dynamic oxygen-enhanced MRI with a cycling gas challenge and independent component analysis. Magn Reson Med. 81(4): 2514– 2525 (2019).
3. Pedregosa, F. et al. Scikit-learn: Machine Learning in Python. Journal of Machine Learning Research 12(85): 2825−2830 (2011).
4. Arjovsky, M. et al. Wasserstein Generative Adversarial Networks. Proceedings of the 34th International Conference on Machine Learning, PMLR 70:214-223 (2017).
Figures
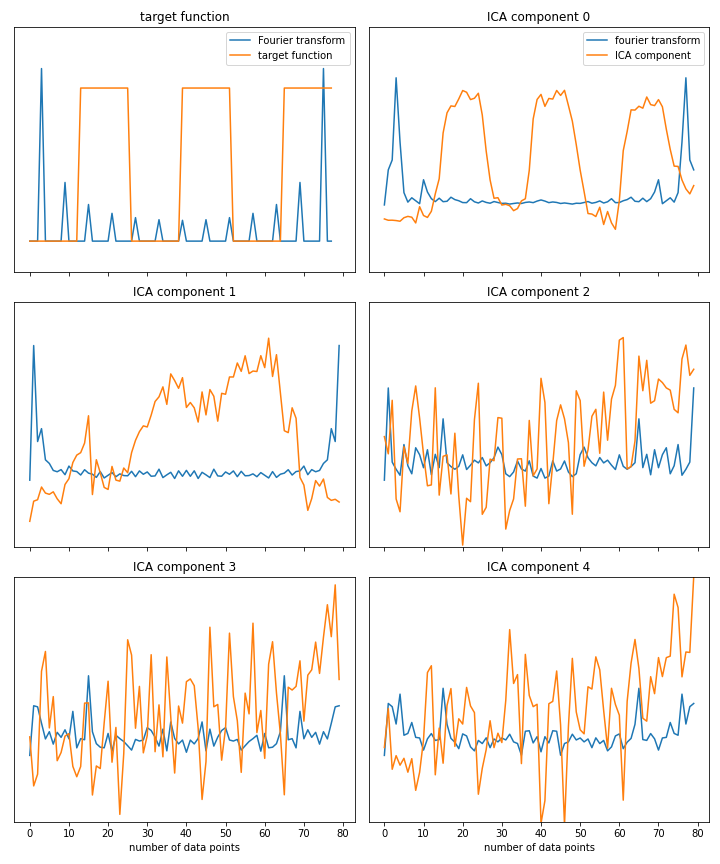
Figure 1: Independent Component Analysis with five number of components. Signal trace (orange) and absolute value of Fourier spectrum (blue). Upper left: target function of the cyclic gas breathing challenge with according absolute value of Fourier transformed spectrum. The component showing the gas breathing challenge trace has the FT spectrum distribution closest to the target function and can be extracted as the best match.
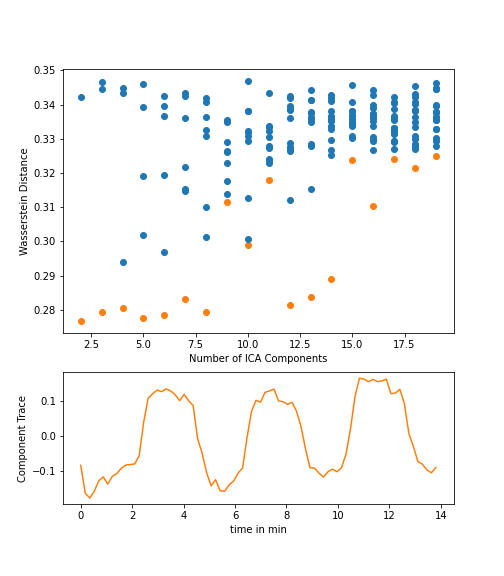
Figure 2: The results of the component finding program for the ICA on the T1-W image. In the top is the Wasserstein distance for each individual component plotted against the Number of Components. In the bottom is the component trace of the best matching component with the lowest value of Wasserstein Distance between the ICA component and the target function of the oxygen breathing cycle.
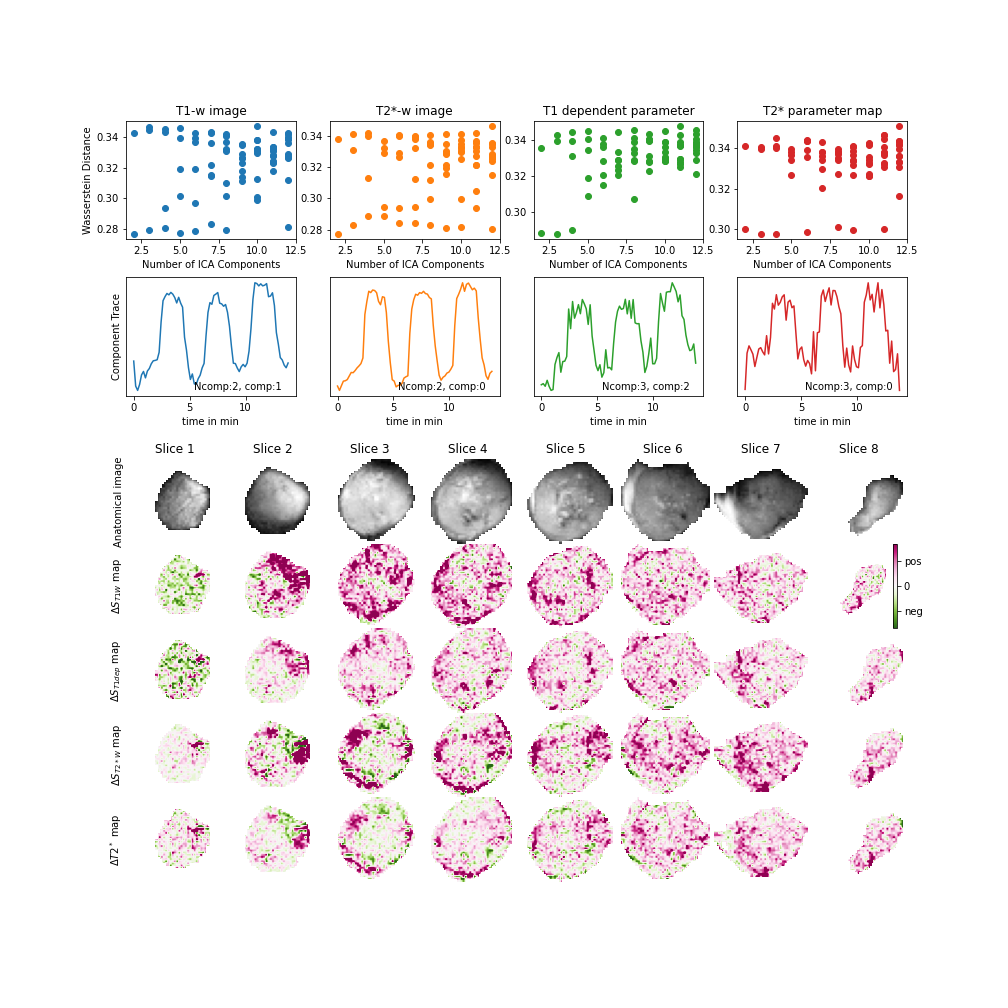
Figure 3: Summary of the results from the automated ICA program used on a pancreatic PDX tumour implanted subcutaneously in mice. top row: Wasserstein distance for number of components on different parameter maps. second row: component trace of the ICA component with lowest Wasserstein value. bottom rows: corresponding component maps for the extracted signal traces including anatomical T1 weighted image. color scale: pink for positive and green for the negative signal intensity change.
DOI: https://doi.org/10.58530/2023/3401