3400
Quantitative BOLD with Variational Bayesian inference: model comparisons with Monte Carlo simulations and in an elderly cohort1Department of Biomedical Engineering, University of California, Davis, Davis, CA, United States, 2School of Medicine & Health Sciences, University of Nottingham, Nottingham, United Kingdom, 3Department of Neurology, University of California, Davis, Davis, CA, United States
Synopsis
Keywords: Quantitative Imaging, Oxygenation
This study uses Monte Carlo simulations to understand the behavior of quantitative BOLD in different physiological conditions, using a Variational Bayesian inference framework with prior information and data from Asymmetric Spin Echo (ASE) scans. The performance of the three models at 7 SNR levels (from 5 to 500) showed that one-compartment and two-compartment models estimated oxygen extraction fraction (OEF) more accurately than linear model across a full range of deoxygenated blood volume (DBV) (p<0.05 using two-way ANOVA with pairwise comparisons). In vivo data showed that Bayesian inference approach effectively enables smoother and quantitatively different parameter maps of OEF and DBV.INTRODUCTION
Asymmetric Spin Echo (ASE) enables non-invasive and quantitative estimates of transverse relaxation rate (R2’) and tissue hemodynamics parameters, such as deoxygenated blood volume (DBV) and oxygen extraction fraction (OEF) in normal subjects1 and many neurological conditions. Our goal is to evaluate an ASE sequence across various physiological conditions and select a qBOLD model that provides the most reliable estimates of OEF. We hypothesized that the model using a full range of ASE data with multiple tissue compartments would produce more stable OEF estimations than streamline-qBOLD (sqBOLD or L)2 model for all physiological conditions. Additionally, in vivo data from elderly participants were used to demonstrate the model performance in parameter estimations.METHODS
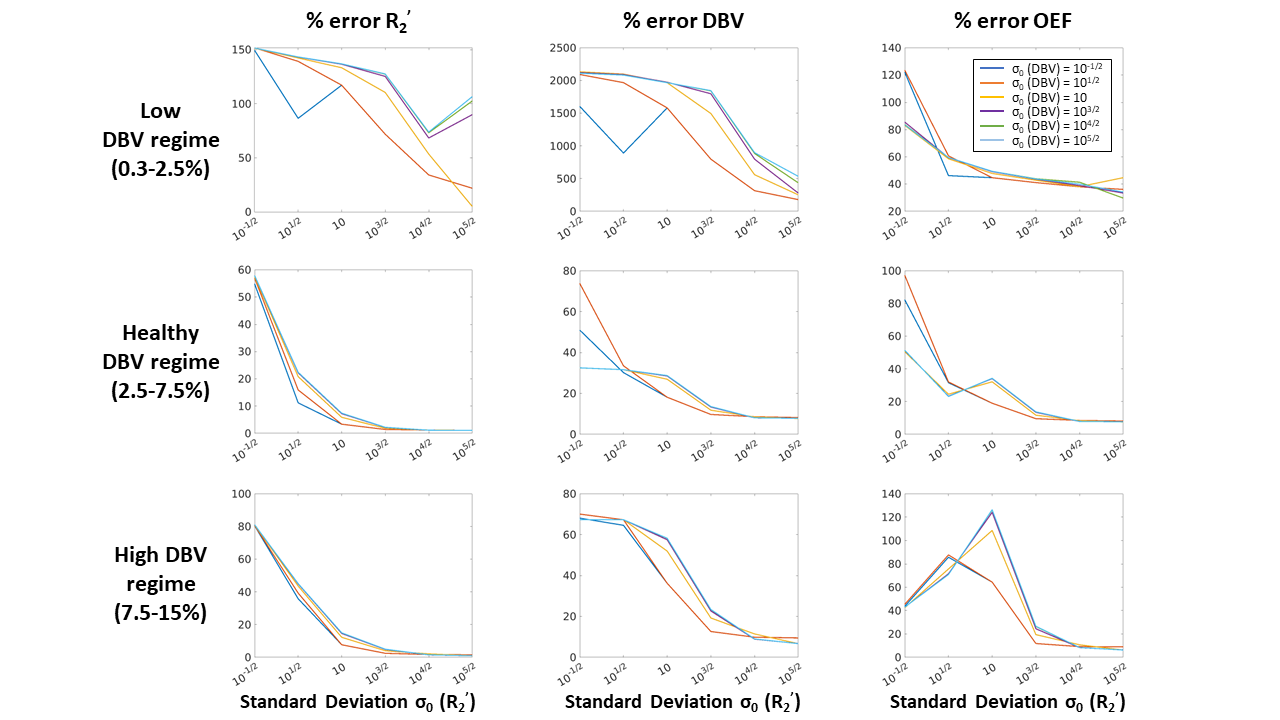
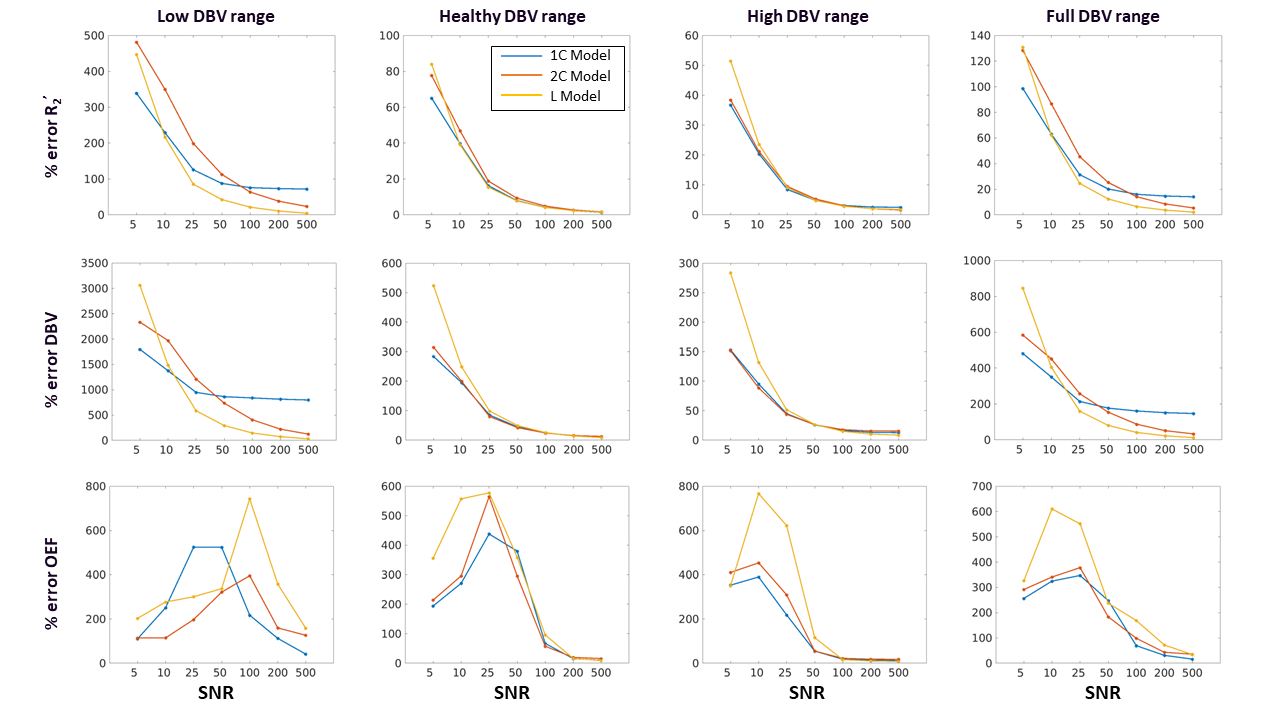
Simulations: In MATLAB, simulated two-compartment ASE qBOLD signals were generated1,3,4. Signals were simulated with an expected range of healthy values, 30 OEF values from 20% to 70%, and 30 DBV values from 0.3% to 15%, for a total of 900 artificial ASE signals. DBV range was divided into three physiological ranges (low DBV: 0.3-2.5%; healthy DBV: 2.5-7.5%; and high DBV: 7.5-15%). Gaussian noise was added to each ASE signal curve at 7 signal-to-noise ratios (SNR) levels from 5 to 500 with 1000 Monte Carlo simulations for each combination. The complete set of simulated signals was analyzed using R2’-based models5 with VB scheme, using the FAST ASL and BOLD Bayesian Estimation Routine (FABBER)6–8 with 1-Compartment (1C)9 and 2-Compartment (2C)3 qBOLD models. Prior means (μ0) were taken from literature for healthy subjects (μ0 (DBV) = 3.6% and μ0 (R2’) = 2.6 s-1)5, and we explored the effect of different standard deviations of the prior distribution.VB inference was performed using 1C model with a range of standard deviations (σ0) between 10-1/2 to 105/2 for each parameter at the highest SNR of 500 with fixed μ0. The relative error for each parameter at different physiological stages was computed and averaged over all simulated pairs of OEF and DBV values. Once the optimal prior was determined, the simulated ASE signals were analyzed using three models (L, 1C, and 2C) at seven different SNRs.
MRI Acquisitions: A total of 46 cognitively normal individuals from the UC Davis Alzheimer’s Disease Research Center cohort underwent scanning on a 3T MRI scanner (Siemens Tim Trio) with a 32-channel head coil. The imaging acquisition included a Gradient Echo Slice Excitation Profile Imaging Asymmetric Spin Echo (ASE) scan and a T1-weighted MPRAGE. The ASE scan was acquired as previously described10. Imaging parameters included TR/TE, 2800/66 ms; 96x96 matrix, 20 slabs, 2.3x2.3x1.3 mm3 resolution; FOV, 224 mm. R2’ weighting was acquired by shifting the spin echo refocusing pulse of the spin echo displacement time,τ, from 0 ms to 52 ms in steps of 4 ms, including spin echo scan (τ=0).
Image Processing: ASE data were motion corrected and smoothed in FSL11 to reduce the effect of noisy voxels. The spin echo was registered to the T1-weighted image to create gray matter (GM) and white matter (WM) regions of interest using FAST12. In vivo ASE scans were analyzed using L model, and 1C and 2C models with VB inference. DBV and R2’ were estimated directly from each model. OEF was then quantified by:
$$OEF = \frac{3\times R_2^{'}}{DBV\times \gamma\times 4\times \pi\times \triangle\chi_{0} \times Hct \times B_{0}}$$
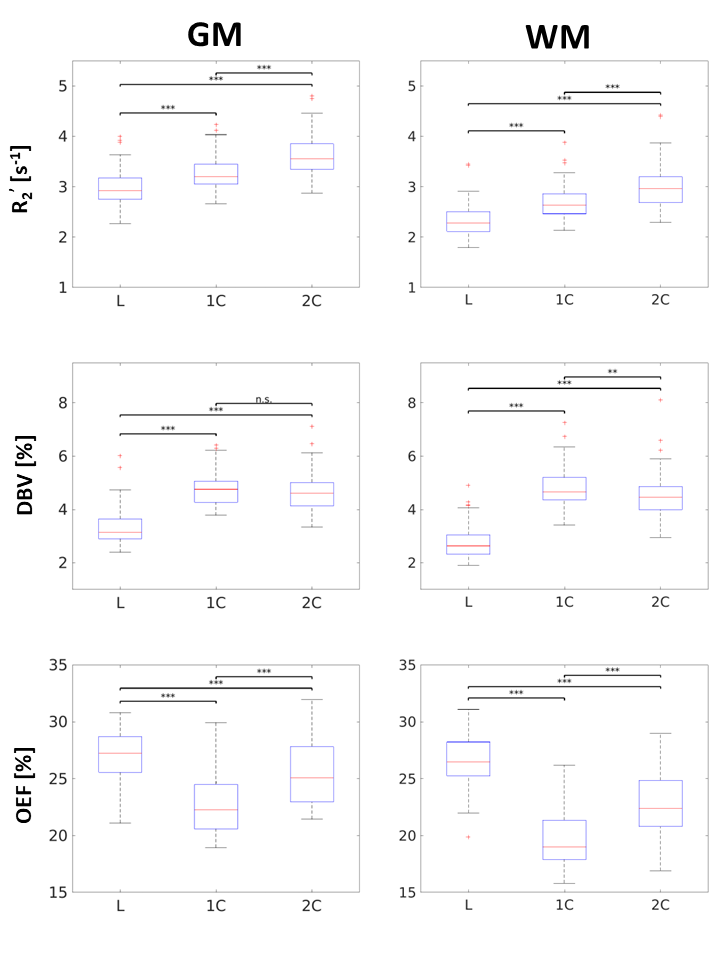
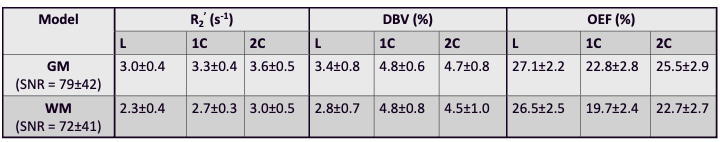
where γ is the proton gyromagnetic ratio, Δχ0 is the susceptibility difference between fully oxygenated and deoxygenated red blood cells (0.264ppm), Hct is the hematocrit (0.40), and B0 is the field strength. The 1C and 2C models were fit to data for 14 τ values, while the L model only applies to τ > 15ms (11 data points). Group average GM and WM estimates for each parameter (Figure 4) were assessed by two-way ANOVA and Tukey-Kramer pair-wise comparisons.
RESULTS
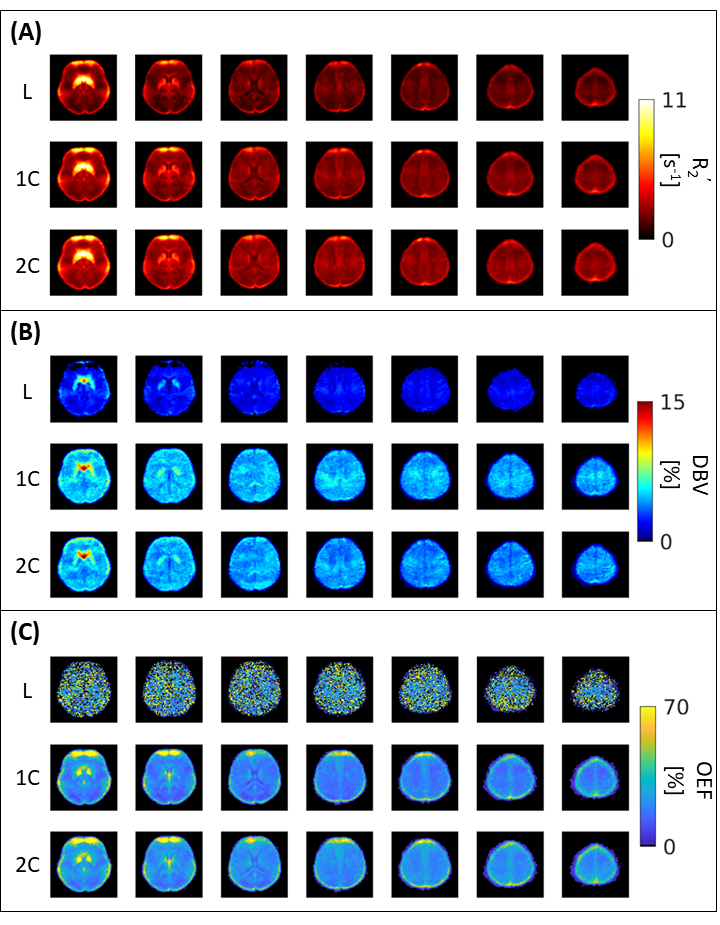
The results suggest that σ0 (R2’) = 103/2 and σ0 (DBV) = 101/2 produce the smallest error at most physiological ranges for OEF (Figure 1). At a low DBV regime, the effect of priors on OEF error converges quickly at low σ0 (R2’) and remains consistent after σ0 (R2’) = 10. Figure 2 showed that 1C and 2C estimate OEF more accurately than L model in a full range of DBV (p<0.05, two-way ANOVA with pairwise comparisons). For in vivo data, the group average parameter maps (Figure 3) showed that OEF maps are more homogeneous and have fewer voxels with unphysiological values in 1C and 2C models. Group average GM and WM (Figure 4, Table 1) showed that 1C and 2C models produce statistically lower estimates of all parameters than L model in both regions. However, 1C and 2C models produce similar DBV estimates in GM.DISCUSSION
One main limitation of this study is using the analytical qBOLD model as ground truth for simulations, while in vivo data include more complex vascular compartments and vessel sizes. In addition, the estimates of OEF in the WM might be affected by various artifact factors such as WM hyperintensities, myelin susceptibility, and anisotropy of WM fibers.CONCLUSION
This study has shown that a qBOLD model with a Bayesian framework can robustly estimate parameters with less error than sqBOLD, which improves the interpretation of ASE data from clinical populations such as cerebrovascular disease and vascular dementia.Acknowledgements
This study was supported by NIH R00-NS102884 and the UC Davis Alzheimer’s Disease Research Center.References
1. An, H. & Lin, W. Impact of intravascular signal on quantitative measures of cerebral oxygen extraction and blood volume under normo- and hypercapnic conditions using an asymmetric spin echo approach. Magn. Reson. Med. 50, 708–716 (2003).
2. Stone, A. J. & Blockley, N. P. A streamlined acquisition for mapping baseline brain oxygenation using quantitative BOLD. NeuroImage 147, 79–88 (2017).
3. He, X. & Yablonskiy, D. A. Quantitative BOLD: Mapping of human cerebral deoxygenated blood volume and oxygen extraction fraction: Default state. Magn. Reson. Med. 57, 115–126 (2007).
4. Berman, A. J. L. et al. Gas-free calibrated fMRI with a correction for vessel-size sensitivity. NeuroImage 169, 176–188 (2018).
5. Cherukara, M. T., Stone, A. J., Chappell, M. A. & Blockley, N. P. Model-based Bayesian inference of brain oxygenation using quantitative BOLD. NeuroImage 202, 116106 (2019).
6. Chappell, M. A., Groves, A. R., Whitcher, B. & Woolrich, M. W. Variational Bayesian Inference for a Nonlinear Forward Model. IEEE Trans. Signal Process. 57, 223–236 (2009).
7. Groves, A. R., Chappell, M. A. & Woolrich, M. W. Combined spatial and non-spatial prior for inference on MRI time-series. NeuroImage 45, 795–809 (2009).
8. Woolrich, M. W. & Behrens, T. E. Variational Bayes inference of spatial mixture models for segmentation. IEEE Trans. Med. Imaging 25, 1380–1391 (2006).
9. Yablonskiy, D. A. & Haacke, E. M. Theory of NMR signal behavior in magnetically inhomogeneous tissues: The static dephasing regime. Magn. Reson. Med. 32, 749–763 (1994).
10. Blockley, N. P. & Stone, A. J. Improving the specificity of R2’ to the deoxyhaemoglobin content of brain tissue: Prospective correction of macroscopic magnetic field gradients. NeuroImage 135, 253–260 (2016).
11. Jenkinson, M., Beckmann, C. F., Behrens, T. E. J., Woolrich, M. W. & Smith, S. M. FSL. NeuroImage 62, 782–790 (2012).
12. Zhang, Y., Brady, M. & Smith, S. Segmentation of brain MR images through a hidden Markov random field model and the expectation-maximization algorithm. IEEE Trans. Med. Imaging 20, 45–57 (2001).
Figures