3399
Comparing L1 and L2 Regularizations for Quantitative Transport Mapping of Tumor: an Image Quality Analysis
Dominick Romano1,2, Qihao Zhang1,2, Ilhami Kovanlikaya2, Pascal Spincemaille2, and Yi Wang2,3
1Biomedical Engineering, Cornell University, New York, NY, United States, 2Radiology, Weill Cornell Medical College, New York, NY, United States, 3Biomedical Engineering, Cornell University, Ithaca, NY, United States
1Biomedical Engineering, Cornell University, New York, NY, United States, 2Radiology, Weill Cornell Medical College, New York, NY, United States, 3Biomedical Engineering, Cornell University, Ithaca, NY, United States
Synopsis
Keywords: Quantitative Imaging, Perfusion, Regularization
This study compared L1 and L2 regularized Quantitative Transport Mapping (QTM1-3) of dynamic contrast enhanced (DCE) MRI in breast and neck tumor using image quality scoring. Improved consistent soft tissue and lesion characterization was observed when using the L1 norm.Introduction
Advanced stage tumors are known to alter the surrounding vasculature. This causes increased uptake and blood flow, which can be visualized with dynamic contrast enhanced MRI imaging (DCE-MRI), which encodes physiological transport parameters. DCE-MRI can be modeled using the convection-diffusion equation, in a method called Quantitative Transport Mapping (QTM1-3). QTM is ill-posed and requires regularization to achieve consistent results. In this study, we compare $$$L_{1}$$$ and $$$L_{2}$$$ regularized QTM on breast and neck tumor data. The images were evaluated using a scoring system by an experienced radiologist.Theory
The DCE-MRI signal can be modeled by the simplified convection-diffusion equation3: $$\partial_{t}c(\textbf{r},t)=-\nabla \cdot (c(\textbf{r},t)\textbf{u}(\textbf{r}))$$ The $$$L_{1}$$$ regularized QTM inverse problem is defined as follows: $$\textbf{u}^{*}=\underset{u}{\operatorname{argmin}}\sum_{k=1}^{N-1}\sum_{k=1}^{N-1}\lVert \partial_{t}c(\textbf{u},t) +\nabla \cdot (c(\textbf{r},t)\textbf{u}(\textbf{r}))\rVert_{2}^{2}+\lambda \lVert \nabla \textbf{u}\rVert_{1}$$ And $$$L_{2}$$$ QTM is defined as follows: $$\textbf{u}^{*}=\underset{u}{\operatorname{argmin}}\sum_{k=1}^{N-1}\sum_{k=1}^{N-1}\lVert \partial_{t}c(\textbf{u},t) +\nabla \cdot (c(\textbf{r},t)\textbf{u}(\textbf{r}))\rVert_{2}^{2}+\lambda \lVert \nabla \textbf{u}\rVert_{2}^{2}$$ Once $$$\textbf{u}$$$ is obtained from the QTM reconstruction, we then report the speed map defined by $$u^{*}=\sqrt{\textbf{u}\cdot \textbf{u}}$$ Regularization weights were selected from the L-curve method.Methods
For the neck tumor dataset, 88 subjects diagnosed with Nasopharyngeal carcinoma (NPC) with a DCE-MRI acquisition were selected for QTM processing. The scanning parameters at 3T (Siemens, Erlangen, Germany): FLASH/vibe sequence; time points = 50; dt = 4.9s; TR=4.9ms; TE=1.47ms; flip angle = 9 degrees; image orientation: axial/transversal; Phase FOV = 75%; bandwidth = 400 Hz; dz = 4mm; slice spacing = 0mm; in-plane FOV = 180x180 mm2; in-plane matrix = 192x144; Acquisition Time = 245sThe breast tumor cohort consisted of 26 subjects. The subjects were scanned at 3T with an 8-channel breast coil with acquisition parameters: time points = 5; dt = 15.4s; TR=3.95 ms; TE=1.7 ms; flip angle = 10; image orientation: axial/transversal; in-plane resolution = 0.71mm; dz = 1.8mm.
The resulting speed maps from $$$L_{1}$$$ and $$$L_{2}$$$ are compared with DCE-MRI as a reference. An experienced radiologist (I.K.) scored the images on the following scale: $$$L_{1}$$$ preferred, $$$L_{2}$$$ preferred, and equal preference. The rationale for each case preference was based on the following: 1) Lesion intensity should not be exaggerated, 2) Soft tissue contrast should be considered, 3) QTM reconstructed lesion should not appear artifactual, 4) QTM reconstructed structures should not be exaggerated.
Results
In NPC cases, $$$L_{1}$$$ regularized maps were preferred in 81.8% of the cases, with $$$L_{2}$$$ regularized maps were preferred in 10.2$ of the cases, and 8.0% were equally preferred (Table 1). This may be explained by the fact that $$$L_{1}$$$ tissue maps present consistent characterization of the normal appearing tissue, while the $$$L_{2}$$$ speed maps provide artifactual normal appearing tissue (Figure 1). Furthermore, $$$L_{1}$$$ speed maps are consistently preserved at and within the lesion boundary when compared with $$$L_{2}$$$ maps.In the breast tumor dataset, $$$L_{1}$$$ was preferred in 73.1% of the cases, $$$L_{2}$$$ was preferred in 3.8% of the cases, and the remaining 21% of cases were preferred equally (Table 2). It was found that the normal appearing tissue and lesion characterization was exaggerated in the $$$L_{2}$$$ computed speed maps (Figure 2).
Discussion
Previous studies have found $$$L_{1}$$$ regularization of perfusion models perform best in numerical simulations and acquired CT data, especially in lower SNR cases4-7. Furthermore, these works found that $$$L_{1}$$$ regularization localized perfusion quantities to tissue types, in which our work falls into agreement. In MRI, many studies report piecewise constant CBF between white and grey matter8-10, which supports the choice for the $$$L_{1}$$$ norm. Notably, our work fills a gap of comparing regularization methods for convection-diffusion based modeling of time-resolved perfusion imaging signals. For the QTM inverse problem, we find improved consistent soft tissue and lesion characterization when using the L1 norm.Acknowledgements
No acknowledgement found.References
- Huang W, Zhang Q, Wu G, Chen PP, Li J, McCabe Gillen K, Spincemaille P, Chiang GC, Gupta A, Wang Y, Chen F. DCE-MRI quantitative transport mapping for noninvasively detecting hypoxia inducible factor-1α, epidermal growth factor receptor overexpression, and Ki-67 in nasopharyngeal carcinoma patients. Radiother Oncol 2021;164:146-154.
- Zhang Q, Spincemaille P, Drotman M, Chen C, Eskreis-Winkler S, Huang W, Zhou L, Morgan J, Nguyen TD, Prince MR, Wang Y. Quantitative transport mapping (QTM) for differentiating benign and malignant breast lesion: Comparison with traditional kinetics modeling and semi-quantitative enhancement curve characteristics. Magn Reson Imaging 2022;86:86-93.
- Zhou L, Zhang Q, Spincemaille P, Nguyen TD, Morgan J, Dai W, Li Y, Gupta A, Prince MR, Wang Y. Quantitative transport mapping (QTM) of the kidney with an approximate microvascular network. Magnetic Resonance in Medicine 2021;85(4):2247-2262.
- Fang R, Chen T, Sanelli PC. Towards robust deconvolution of low-dose perfusion CT: sparse perfusion deconvolution using online dictionary learning. Med Image Anal 2013;17(4):417-428.
- Fang R, Chen T, Sanelli PC. Tissue-specific sparse deconvolution for low-dose CT perfusion. Med Image Comput Comput Assist Interv 2013;16(Pt 1):114-121.
- Fang R, Karlsson K, Chen T, Sanelli PC. Improving low-dose blood-brain barrier permeability quantification using sparse high-dose induced prior for Patlak model. Med Image Anal 2014;18(6):866-880.
- Ruogu F, Shaoting Z, Tsuhan C, Sanelli PC. Robust Low-Dose CT Perfusion Deconvolution via Tensor Total-Variation Regularization. IEEE Trans Med Imaging 2015;34(7):1533-1548.
- Brown GG, Clark C, Liu TT. Measurement of cerebral perfusion with arterial spin labeling: Part 2. Applications. J Int Neuropsychol Soc 2007;13(3):526-538.
- Buxton RB. Quantifying CBF with arterial spin labeling. J Magn Reson Imaging 2005;22(6):723-726.
- Fan AP, Guo J, Khalighi MM, Gulaka PK, Shen B, Park JH, Gandhi H, Holley D, Rutledge O, Singh P, Haywood T, Steinberg GK, Chin FT, Zaharchuk G. Long-Delay Arterial Spin Labeling Provides More Accurate Cerebral Blood Flow Measurements in Moyamoya Patients: A Simultaneous Positron Emission Tomography/MRI Study. Stroke 2017;48(9):2441-2449.
Figures
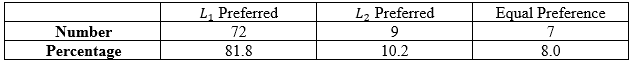
Table 1: Radiologist L1 vs L2 preference of neck tumor speed maps
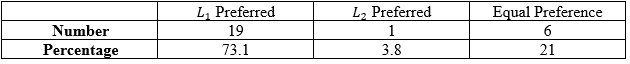
Table 2: Radiologist L1 vs L2 preference of breast tumor speed maps
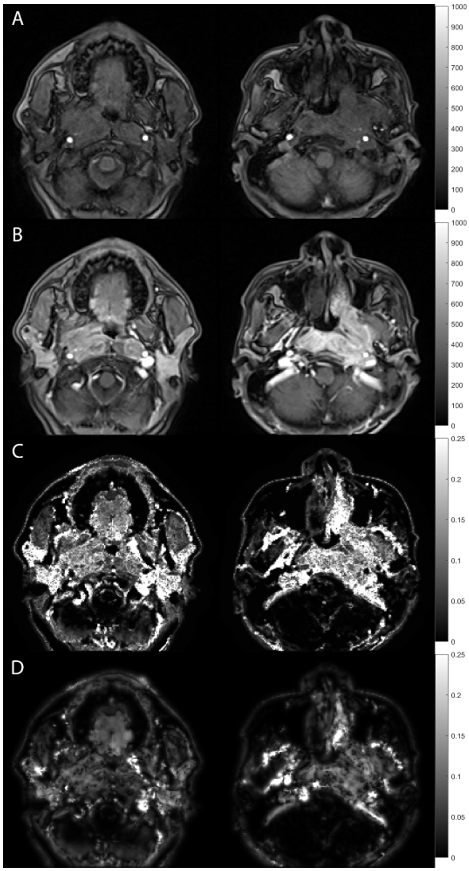
An example of anatomical and quantitative speed maps for neck tumors. (A)
DCE-MRI pre-contrast. (B) DCE-MRI post-contrast. (C) QTM L1 regularized speed map $$$|\textbf{u}|$$$. (D) QTM L2 regularized speed map $$$|\textbf{u}|$$$.
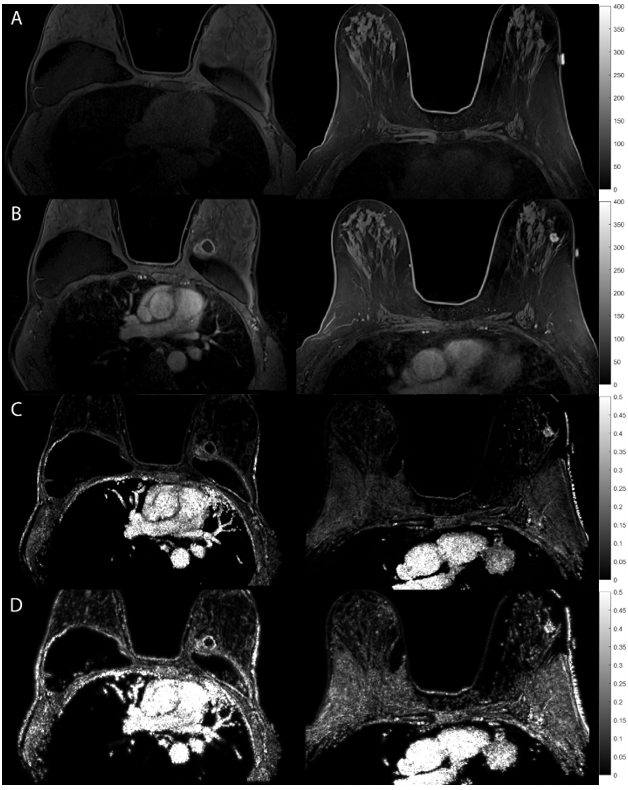
Anatomical and quantitative speed maps for breast tumors. (A)
DCE-MRI pre-contrast. (B) DCE-MRI post-contrast. (C) QTM L1 regularized speed map $$$|\textbf{u}|$$$ (D) QTM L2 regularized speed map $$$|\textbf{u}|$$$
DOI: https://doi.org/10.58530/2023/3399