3398
Advanced-Model 3D DCE-MRI of Small Animals with Spatially Regularized Processing Steps1Czech Academy of Sciences, Institute of Scientific Instruments, Brno, Czech Republic, 2Czech Academy of Sciences, Institute of Information Theory and Automation, Praha, Czech Republic, 3Department of Telecommunications, Brno University of Technology, Faculty of Electrical Engineering and Communication, Brno, Czech Republic
Synopsis
Keywords: Quantitative Imaging, DSC & DCE Perfusion
In DCE-MRI, advanced pharmacokinetic models, such as the 2CX, TH and ATH models, provide a more complete set of pharmacokinetic parameters than the commonly used simpler models, such as the Tofts and Patlak models. However, their use requires higher temporal resolution and signal-to-noise ratio. Hence, advanced-model DCE-MRI allows for imaging of only a few slices. We present an approach making 3D advanced-model DCE-MRI possible and evaluate it under the low-signal-to-noise-ratio conditions of small-animal MRI. Our methodology is based on compressed sensing and spatially regularized fitting of the pharmacokinetic model. The approach is evaluated on simulated and real datasets.INTRODUCTION
Use of advanced pharmacokinetic (PK) models1 (e.g. 2CX, TH, ATH) in Dynamic Contrast-Enhanced (DCE) MRI can provide a more complete set of PK parameters than the common models1 (e.g. Tofts, Patlak), especially by estimating blood flow and permeability surface area instead of their compound parameter Ktrans. However, advanced PK models require high temporal resolution of the acquisition (approx. 1s) and high signal-to-noise ratio (SNR) (especially challenging in small-animal DCE-MRI). This allows for acquisition of one or only a few slices. We show the feasibility of 3D advanced-model DCE-MRI of small animals by means of compressed sensing and spatially regularized perfusion analysis.METHODS
We used our implementation of the radial golden-angle stack-of-stars (GASOS) T1-weighted spoiled gradient-echo acquisition2 to achieve the incoherent-sampling condition of compressed sensing. From the acquired data, we reconstructed image sequences by the L+S algorithm with limited differences3, minimizing the time-domain starcase artifacts. Subsequently, we converted the image-sequences to contrast-agent concentration curves using T10 mapping from multi-flip-angle precontrast recordings. Finally, we estimated PK maps with spatially regularized PK-model fitting4. In contrast to standard voxel-by-voxel approach, the spatially regularized version fits the PK model simultaneously to all voxels of a slice while inducing edge-preserving smoothness (formulated as total-variation regularization) of the resulting PK maps. The tissue homogenity (TH) PK model was used, with the fitting procedure formulated in the Fourier domain (including estimation of the bolus arrival time), assuming a population-based arterial input function5.To evaluate the proposed approach with respect to the ground truth and under ideal conditions, we generated simulated k-space data. The GASOS acquisition was simulated for the same acquisition parameters as used for real data described below. We added realistic Gaussian noise of approx. the same level as in real data. The concentration curves were generated using the TH model. Based on a real DCE-MRI recording of a rat with a glioma, we manually segmented out 53 regions and assigned each region a median of its estimated voxel-based PK parameters as the ground-truth value. Constant T10 and T20 were assumed. Multi-flip-angle precontrast sequences were simulated as well.
Furthermore, we evaluated our method on recordings from 6 tumor bearing SHO mice (MiaPaCa-2 luc SPX2 ovarian tumor cells; approved by the National Animal Research Authority), imaged with single-slice 2D GA DCE and with the 3D GASOS DCE (2 boli of Magnevist, Bayer HealthCare, Germany, separated by 45 min). We used the 2D recording (image sequence reconstructed using NUFFT, no spatial regularization in PK model fitting) as a reference. For comparison of our 3D DCE results with this 2D reference, we selected manually the corresponding slice of the 3D data. The details of our acquisition procedure were as follows: 9.4T scanner Bruker Biospin (Ettlingen, Germany), 4-channel surface mouse brain coil, 2D DCE: TR/TE = 15/1.5ms, FA = 20°, 1 axial slice, 128 samples/projection, acquisition time 15 min, multi-TR precontrast scans with TR=15, 30, 50, 100, 250, 500ms; 3D DCE: TR/TE = 5.5/1.4ms, FA = 15°, 25 slices, 128 samples/projection, acquisition time 15 min, multi-flip-angle precontrast scans with FA=5, 10, 15, 25, 30°.
RESULTS
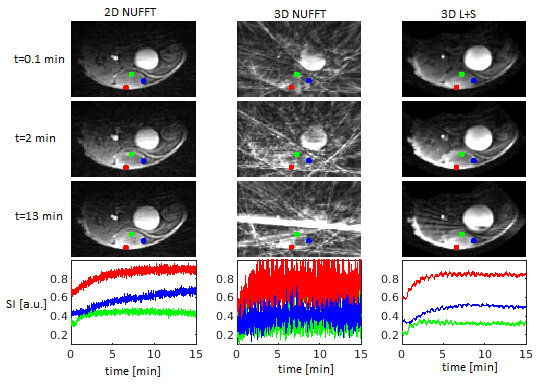
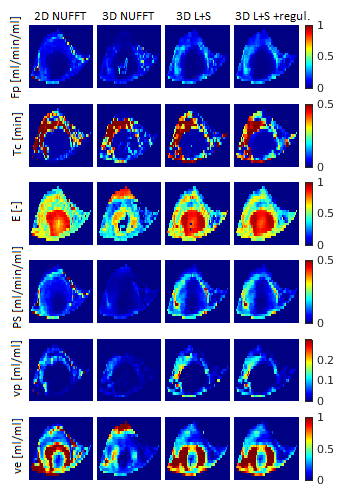
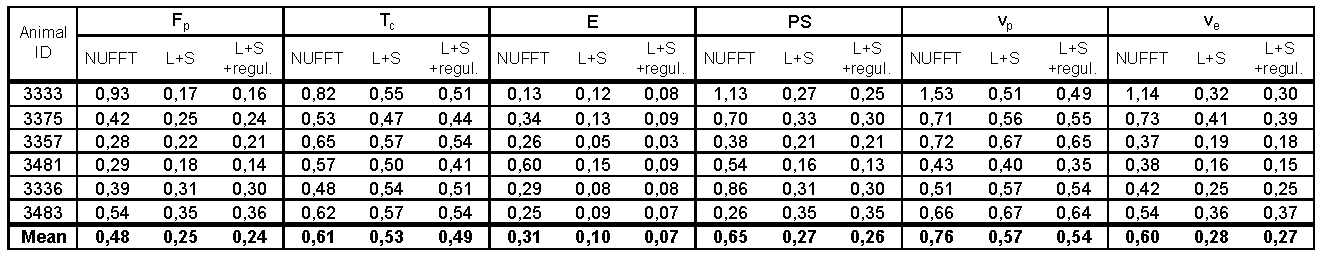
As shown in Figs.1,3, the PK maps of the 3D data were clearly unacceptable when using only the NUFFT reconstruction. A substantial improvement was achieved by the L+S reconstruction and a slight further improvement was gained by the subsequent regularized PK-model fitting. This agreed well with the quantitative comparison of the mentioned 3D approaches with the reference 2D results (Fig.4) using the mean voxel-wise within-subject coefficient of variation (wCV)6 of the PK-parameter estimates. Fig.2 shows the quality of images and time curves reconstructed from the 3D data with L+S, comparable with the reference 2D data.DISCUSSION
The most important step towards feasible 3D DCE-MRI was the GASOS acquisition combined with the L+S reconstruction. The subsequent spatial regularization of PK-model fitting was helpful mainly for estimates of Fp, Tc and E, which are the most difficult PK parameters to estimate. In evaluation on the real data, the comparison of the PK maps obtained from the reference 2D data and the corresponding slice of the 3D datasets was problematic because of the impossibility of choosing exactly the same slice, due to animal motion during the examination. This was the reason for some mismatch between the 2D and 3D PK-parameter maps.CONCLUSION
Advanced-model 3D DCE-MRI in small animals is feasible for tumor applications. Compared to the available simple-model DCE-MRI, or single-slice advanced-model DCE-MRI, the proposed approach can provide a broad set of PK parameters within the whole tumor volume, allowing for studies of tumor heterogeneity.Acknowledgements
Supported by Czech Science Foundation (GA22-10953S) and Ministry of Education, Youth and Sports of the Czech Republic (LM2018129).References
1. Sourbron SP, Buckley DL. Classic models for dynamic contrast-enhanced MRI. NMR Biomed. 2013;26(8):1004-1027.
2. Feng L, Grimm R, Block KT, et al. Golden-angle radial sparse parallel MRI: combination of compressed sensing, parallel imaging, and golden-angle radial sampling for fast and flexible dynamic volumetric MRI. Magn Reson Med. 2014;72(3):707-717.
3. Mangová (Daňková) M. Increasing resolution in perfusion magnetic resonance imaging using compressed sensing. Ph.D. Thesis, Brno Univ. of Technol., 2018.
4. Bartoš M, Rajmic P, Šorel M, et al.. Spatially regularized estimation of the tissue homogeneity model parameters in DCE‐MRI using proximal minimization. Magn Reson Med. 2019;82(6):2257-2272. doi:10.1002/mrm.27874
5. Jiřík R, Taxt T, Macíček O, et al. Blind deconvolution estimation of an arterial input function for small animal DCE-MRI. Magn Reson Imaging. 2019;62:46-56.
6. Shukla-Dave A, Obuchowski NA., Chenevert TL, et al. Quantitative imaging biomarkers alliance (QIBA) recommendations for improved precision of DWI and DCE-MRI derived biomarkers in multicenter oncology trials. J. Magn. Reson. Imaging. 2019;49:e101-e121.
Figures
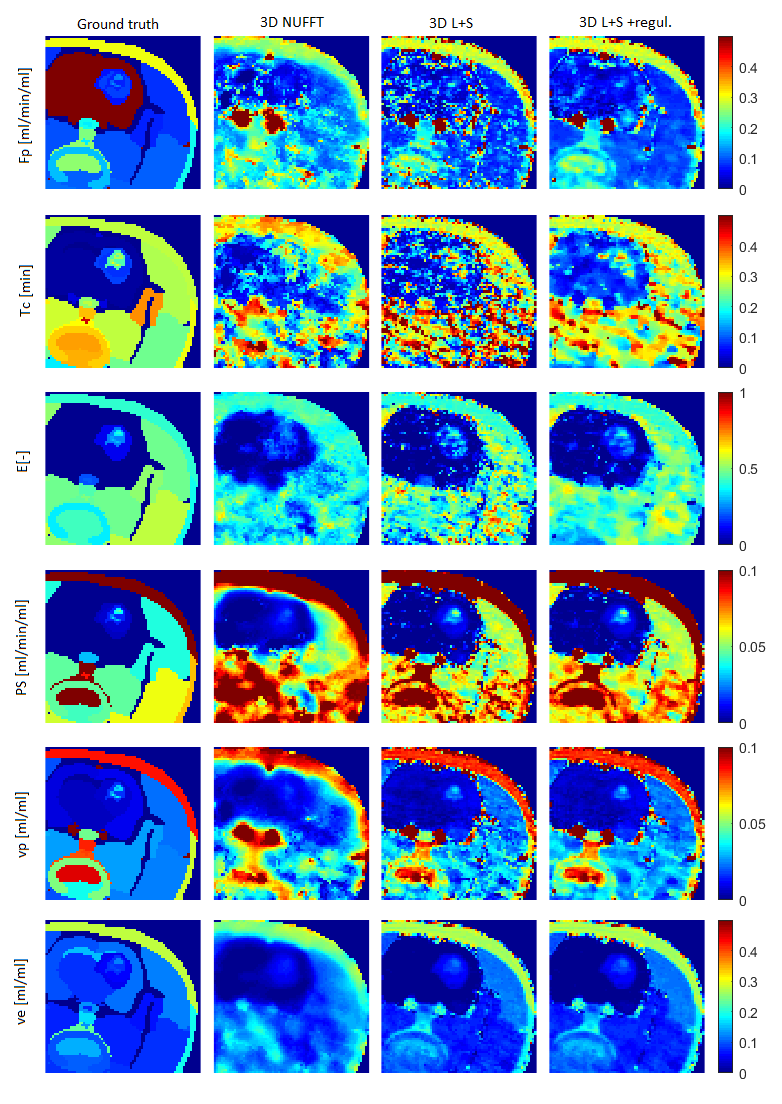
Fig.1. Simulated dataset of a rat head with glioma brain tumor. Ground-truth PK maps and PK maps estimated using the tested approaches. The main tissue of interest is the glioma tumor (non-tumor brain regions are not relevant for evaluation because of an inadequate PK model for this tissue).