3397
Differentiation of Triple-negative and HER2 Positive Breast Cancer Using DISCO CE-MRI1the Second Affiliated Hospital of Nanjing Medical University, Nanjing, China, 2GE Healthcare, China, Beijing, Beijing, China
Synopsis
Keywords: Quantitative Imaging, Breast, DISCO CE-MR
This study aims to investigate the feasibility triple-negative and HER2 positive breast cancer using DISCO CE-MRI. A total of 96 patients were recruited in the study. Quantitative and semi-quantitative parameters were used. kep and TTP had diagnostic value for triple-negative breast cancer. The AUC of kep and TTP were 0.870 and 0.928. kep had diagnostic value for HER2 positive breast cancer.The AUC of kep was 0.832. Our findings suggest that DISCO CE-MRI parameters might be reliable quantitative indicators for the differential diagnosis of triple-negative breast cancer and HER2 positive breast cancer.Background
This study aims to investigate the feasibility triple-negative and HER2 positive breast cancer using DISCO CE-MRI. A total of 96 patients were recruited in the study. Quantitative and semi-quantitative parameters were used. kep and TTP had diagnostic value for triple-negative breast cancer. The AUC of kep and TTP were 0.870 and 0.928. kep had diagnostic value for HER2 positive breast cancer.The AUC of kep was 0.832. Our findings suggest that DISCO CE-MRI parameters might be reliable quantitative indicators for the differential diagnosis of triple-negative breast caBreast cancer is the leading cause of cancer death in women. Routine magnetic resonance examination has been widely used in preoperative staging of breast cancer [1], therapeutic monitoring, and detection of recurrence [2]. In the updated guidelines for the diagnosis and treatment of HER2 positive advanced breast cancer presented at the 2021 National Breast Cancer Conference and the Annual Meeting of the Chinese Society of Clinical Oncology, a new generation of antibody-coupled drugs has enriched treatment options for advanced HER2 positive breast cancer, significantly extending survival in these patients [3].Dynamic contrast-enhanced MRI (DCE-MRI) has high temporal and spatial resolution and can provide specific morphological and functional information for the neovascularization of lesions [4]. Currently, it has been applied in the classification of the malignant degree of tumor lesions. [5].
Differential subsampling with Cartesian ordering contrast-enhanced magnetic resonance imaging (DISCO CE-MRI) was developed with a pseudo-random variable density κ-space segmentation and κ-space shared reconstruction scheme. With DISCO CE-MRI, high spatial and temporal resolution and reduced image artifacts have been achieved for malignant focal hepatic lesions, focal enhanced breast lesions, and intracranial aneurysms [6].
To our knowledge, there have been no previous studies that have applied DICSO CE-MRI to investigate breast cancer lesions. Therefore, the purpose of this work was to implement the aforementioned method to analyze triple-negative vs. non-triple-negative, HER2 positive vs. HER2 negative cancer lesions, and evaluate the role of quantitative and semi-quantitative parameters in the molecular typing of breast cancer.
ncer and HER2 positive breast cancer.
Methods
SubjectsIn total, 96 patients were included in the study. According to the postoperative pathological results, the lesions were divided into 16 triple-negative patients (19 lesions), 80 non-triple-negative patients (82 lesions). As well as 39 HER2 positive patients (42 lesions), and 57 HER2 negative patients (59 lesions).
DISCO CE-MRI
A 3.0-T MR scanner (GE SIGNA™ Premier 3.0T) with a 16-channel phased-array body coil was used for all subjects. DISCO CE-MRI was performed for each participant with the scanning time about 1 minutes 40 seconds. Detailed scan parameters are presented in Table 1.Gd-DTPA (0.15 mmol/kg) was injected intravenously with a high pressure syringe at a flow rate of 3.0 ml/s, and then rinsed with 20ml normal saline.
Data analysis
Quantitative parameters were derived using Omni-Kinetics software (Omni-Kinetics, GE Healthcare). The data was processed by two radiologists with more than five years' experience in breast imaging diagnosis using double-blind method. The ROIs were delineated by avoiding areas of blood vessels, susceptibility artifacts, hemorrhage and necrosis. Then, the quantitative and semi-quantitative parameters of the lesion were obtained. There were 4 quantitative parameters: transfer constant (Ktrans), interstitium-to-plasma rate constant (kep), fractional extracellular space volume (ve) and blood plasma volume fraction (vp); and 4 semi-quantitative parameters: time to peak (TTP), maximum concentration (MAX Conc), area under the curve (AUC) and maximum slope (MAX Slope).
Statistical analysis
SPSS 23.0 statistic software was used. Intra-class correlation coefficients analysis was applied to assess the inter-observer agreement of parameter measurement over two radiologists. These parameters were compared between the two groups separately using the Mann-Whitney U test (Table 2). A Binary Logistic regression analysis was performed on the significantly different features, and a diagnosis model was built. A receiver operating characteristic (ROC) curve was carried out to observe the difference of diagnostic performance between the single positive parameter and the combination of parameters (1.804* kep + 4.802*TTP).
Results
There were statistical differences in Ktrans, kep, vp, TTP, MAX Conc, AUC and MAX Slope between the triple-negative breast cancer group and the non-triple-negative breast cancer group. The results showed that kep and TTP had diagnostic value for triple-negative breast cancer by binary logistic regression. The ROC curve showed that the diagnostic efficacy of combined parameter (1.804* kep + 4.802*TTP, AUC = 0.956, P < 0.001) was higher than kep (AUC = 0.870, P = 0.024) and TTP (AUC = 0.928, P = 0.002).Ktrans, kep, ve, vp, TTP, MAX Conc, AUC and MAX Slope had statistical differences between HER2 positive breast cancer and HER2 negative breast cancer . The ROC curve showed that kep has diagnostic value in HER2 positive breast cancer (AUC = 0.832, P = 0.002).
Conclusions
Our results are encouraging and suggest that parameters derived from DISCO CE-MRI could be reliable quantitative biomarkers for differential diagnosis of triple-negative breast cancer, as well as HER2 positive breast cancer.Acknowledgements
Thanks Guo Haodong.Li Haige. and Zhu Jianguo for rotting the main abstract text. Thanks Dmytro Pylypenko Zhang Ziyan andYuan Xiaofan for prepared figures.References
- Dorling L, Carvalho S, Allen J, et al. Breast Cancer Risk Genes-Association Analysis in More than 113,000 Women [J]. N Engl J Med 2021:428-39.
- Li K, Machireddy A, Tudorica A, et al. Discrimination of Malignant and Benign Breast Lesions Using Quantitative Multiparametric MRI: A Preliminary Study [J]. Tomography 2020;6(2):148-59.
- Yang J, Yin J. Discrimination between breast invasive ductal carcinomas and benign lesions by optimizing quantitative parameters derived from dynamic contrast-enhanced MRI using a semi-automatic method [J]. International journal of clinical oncology 2019;24(7):815-24.
- Aung TN, Acs B, Warrell J, et al. A new tool for technical standardization of the Ki67 immunohistochemical assay [J]. Modern Pathology 2021:1-10.
- Vollmann-Zwerenz A, Leidgens V, Feliciello G, et al. Tumor cell invasion in glioblastoma [J]. International journal of molecular sciences 2020;21(6):1932.
-
Shen Y, Li X, Zhang C, et al. Differential
Subsampling with Cartesian Ordering Contrast-Enhanced Magnetic Resonance
Angiography for the Preoperative Assessment of Anterolateral Thigh Flap
[J]. Korean J Radiol 2022;23(8):803-810.
Figures
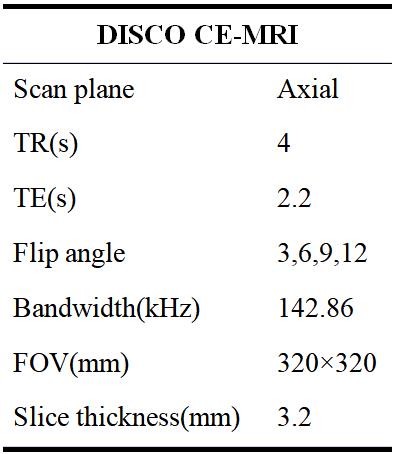
Table 1: Scan parameters used in the study
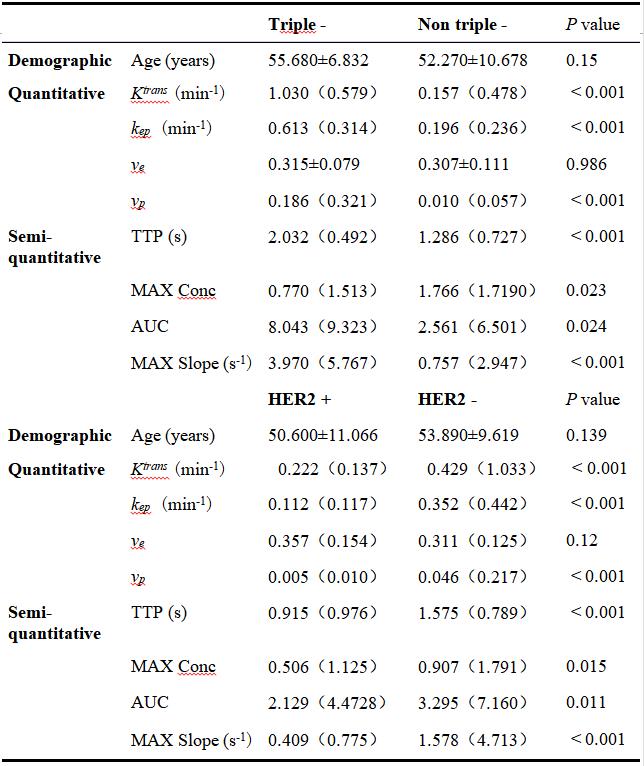
Table 2. Comparison of demographic and DISCO CE-MRI parameters between triple-negative, non-triple-negative, HER2 positive, and HER2 negative groups. The data conforming to the normal distribution are expressed as mean ± SD, and those not conforming are expressed as median value (interquartile range)
#: the data square differences between age and ve groups were the same, and the ANOVA test was used for comparison between groups;
*: Mann-Whitney U test was used for comparison among other data groups.
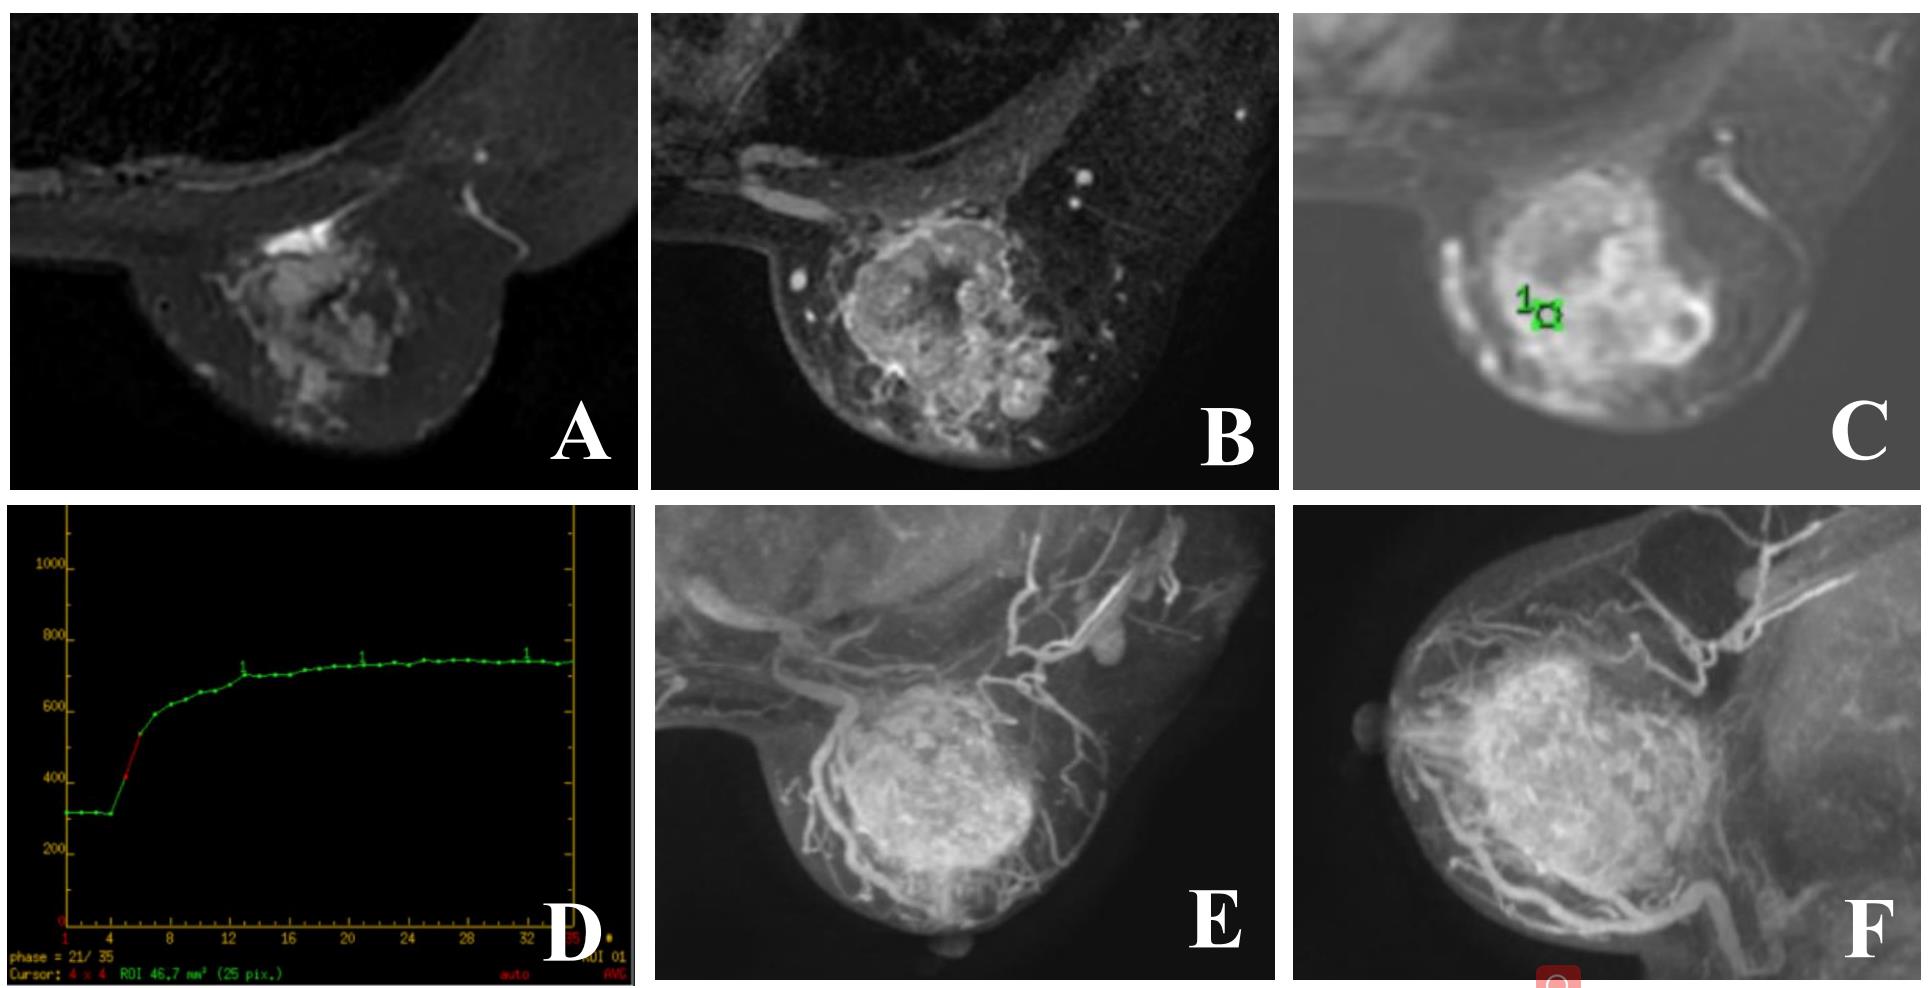
Figure 1:DISCO CE-MRI original maps of female subject, 47 years old, with breast cancer. A shows high signal mainly mixed signal on T2WI fat compression sequence. B represents enhanced image on T1WI, and the lesion shows obvious uneven enhancement. C~D show time signal intensity curve of the region of interest at the lesion after enhancement, which is flat. E~F show the axial and sagittal vascular reconstruction images of the lesion.
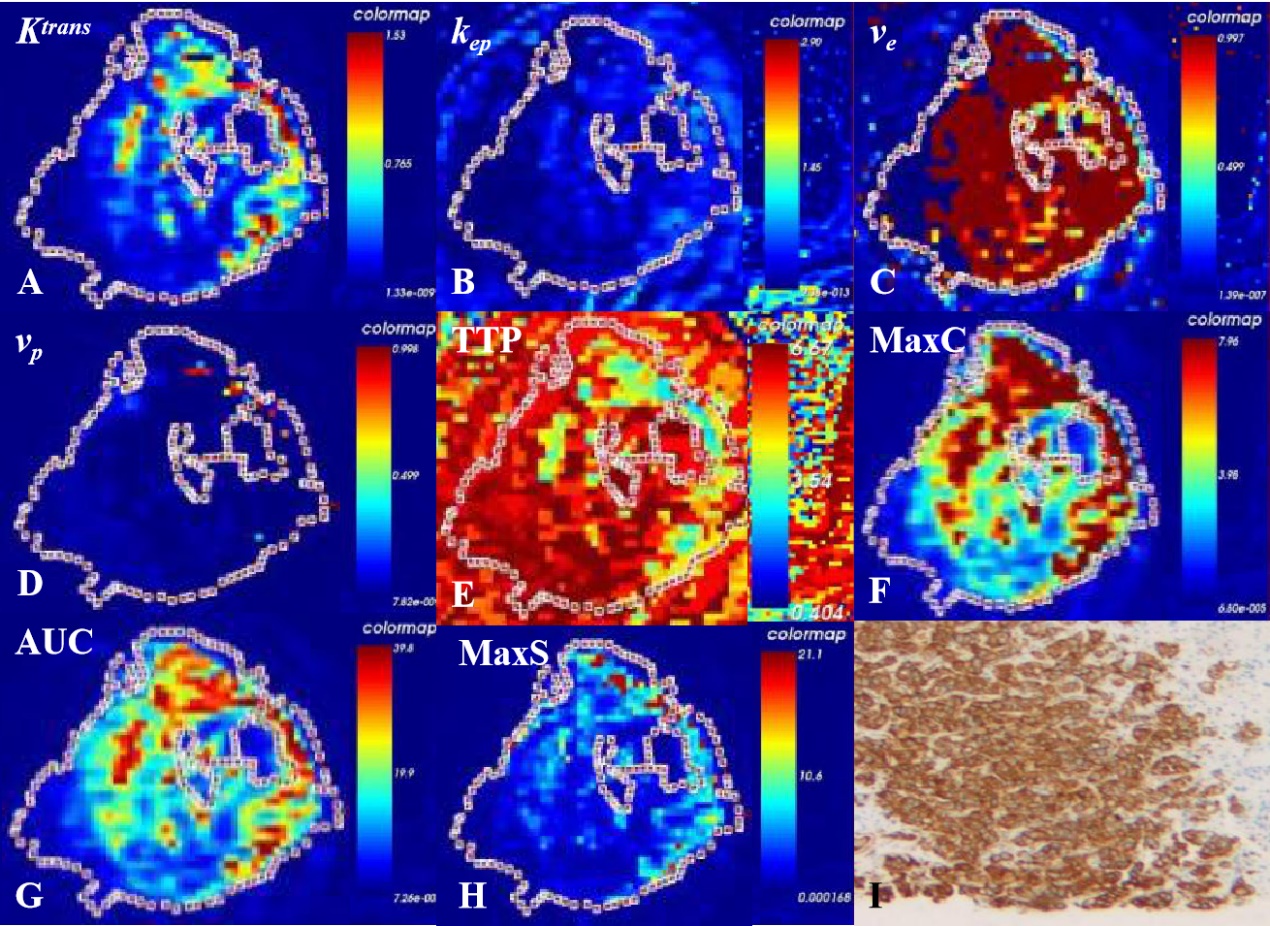
Figure 2: DISCO CE-MRI pseudo color map and original map generated by the tumor area of female subject with breast cancer. A~H show the whole focus method to outline ROI, avoiding the pseudo color images of Ktrans, kep, ve, vp, TTP, Max Conc, AUC and Max Slope obtained by internal necrosis and cystic transformation; I represent the pathological chart.
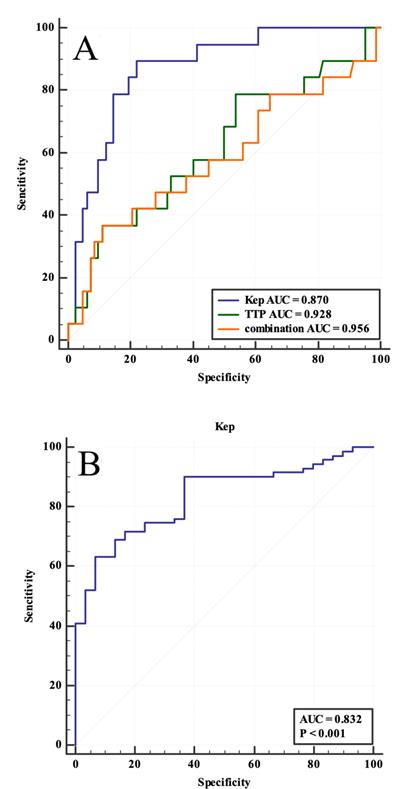
Figure 3: ROC curve. A, the ROC curve shows that the diagnostic efficacy of combined parameter (1.804* kep + 4.802*TTP, AUC = 0.956, P < 0.001) was higher than kep (AUC = 0.870, P = 0.024) and TTP (AUC = 0.928, P = 0.002). B, the ROC curve shows that kep has diagnostic value in HER2 positive breast cancer (AUC = 0.832, P = 0.002).