3395
Monitoring metronomic chemotherapy response in orthotopic breast cancer mouse model using DCE-MRI
Sawwal Qayyum1, Jin Zhang1, and Gene Kim1
1Radiology, Weill Cornell Medical, New York City, NY, United States
1Radiology, Weill Cornell Medical, New York City, NY, United States
Synopsis
Keywords: Quantitative Imaging, DSC & DCE Perfusion, Cancer, Orthotopic, 4T1, Metronomic
Metronomic chemotherapy (MCT) is a cost-effective combinatorial treatment that can be used to normalize tumor vasculature for further treatment. Current monitoring schemes of MCT response are either invasive or are partially sampled. Dynamic contrast enhanced (DCE)-MRI can be utilized to measure the spatial heterogeneity of the tumor microenvironment which can serve as a noninvasive biomarker for treatment response. Using an MCT dose scheme of cyclophosphamide (70mg/kgx3 IP/week), the preliminary result shows that the DCE-MRI can detect the tumor vascular normalization in the treated group.Introduction
Metronomic chemotherapy (MCT) has been studied as a viable (neo)adjuvant therapy to illicit innate immune response and normalize tumor vasculature for additional treatment in different cancer types1,2. The optimal biological dose is being studied at the biological level predominately; however, utilizing a noninvasive imaging technique such as dynamic contrast enhanced (DCE)-MRI may aid in assessing treatment response. Pharmacokinetic model analysis of DCE-MRI data can provide spatial heterogeneity of treatment and its longitudinal changes. Here we propose to utilize a previously reported MCT dose scheme3 of 70mg/kg of cyclophosphamide (CPA) intra-peritoneally (IP)-injected 3 times a week and assess for any heterogenous changes observed throughout the dose scheme by using DCE-MRI in an orthotopic murine breast cancer model.Methods
Six to eight -week-old BALB/c mice (n=10) with 4T1luc2 carcinoma model were included in this study. The 4T1luc2 cells (10,000) were injected into the left 4th set of the mammary fat pad and were scanned 8 days after for baseline measurements. The treated mice received IP injections of 70mg/kg of CPA 3 times a week, and the control received equivalent volume of saline. MRI experiments were performed on a Bruker 7T micro-MRI system, with a four-channel phased array receive-only MRI surface coil. DCE-MRI scan was performed using a custom-made 3D UTE pulse sequence with golden-angle projections4 (TR=5ms and TE=0.028ms) to achieve an isotropic spatial resolution and to minimize the T2* effect. It was continuously run to acquire 48,500 spokes (9,700 spokes each flip angle segment, total 14 segments, flip angels of segments in series were: 10o-10o-10o-10o-2o-10o-20o-10o-5o-10o-15o-10o-25o-10o) for 11 min 19 s. The multiple flip angles during the dynamic scan were used to estimate the pre-contrast T1 along with the pharmacokinetic parameters, i.e., active contrast encoding MRI5-7. Image reconstruction was conducted to have temporal frame resolution T= 5 s/frame, Image matrix = 128x128x128, field of view = 27x27x27 mm3 and the spatial resolution was 0.210x0.210x0.210 mm3. A bolus of gadobutrol (Gadavist, Bayer) in saline at the dose of 0.1 mmol/kg was injected through a tail vein catheter, starting 60 seconds after the start of data acquisition. Arterial Input Function (AIF) was obtained using the median of the 10 most enhancing vessels (selected by initial area under curve, IAUC) from the whole field of view (FOV). For conversion of AIF signal intensity to concentration, the pre-contrast T1 values of those vascular voxels were obtained by minimizing the jumps in the concentration curve as demonstrated before.6 Pharmacokinetic model analysis was carried out with the two-compartment exchange model to simultaneously estimate pre-contrast T10, and four pharmacokinetic parameters: PS (permeability surface area product), Fp (blood flow), ve (extracellular space volume fraction), and vp (vascular space volume fraction). Ktrans (volume transfer constant) was calculated from the estimated PS and Fp.Results and Discussion
Representative tumors, in three orthogonal planes (axial/coronal/sagittal), of a control mouse and a cyclophosphamide treated mouse one week after baseline (Week 2) are shown in Figure 1. The tumor volume measured using post-contrast MR images shows that the two groups did not have significant difference at Week1, but the CPA treated group had a significantly smaller tumor volume than the control group (Figure 1C). Figure 2A shows the signal enhancement ratio curve generated from an ROI of the mouse common iliac artery and Figure 2B shows the resulting AIF in concentration. The log-linear function fit to the AIF data was used for pharmacokinetic analysis. Figure 3 shows representative pharmacokinetic parameter maps which indicate that tumors have relatively high-enhancing (HE) portion near the rim (i.e., IAUC > 0.4) and low-enhancing (LE) area near the core of the tumors (i.e., IAUC < 0.4). The estimated parameters in the whole tumor as well as in HE and LE voxels are shown in Figure 4. It is observed that the treated group had a similar sample dataset of a control mouse and a metronomic CPA treated mouse from baseline (week 1) to one week after baseline. These maps show an increasing trend of vp and Fp with the HE portion of the treated group. In addition, the control group had a bigger decrease of the HE portion of the tumor, compared to the treated group (Figure 5), suggesting the vascular normalization effect of the metronomic therapy.Conclusion
This study demonstrates the utility of DCE-MRI and contrast kinetic analysis for monitoring the changes in tumor vasculature and permeability with MCT. While this study shows the changes between baseline and post 1 week of MCT (3 total doses), future studies will include a larger cohort of animals and further timepoints to better understand the full scope of MCT, together with further optimization of the AIF and histological assessment.Acknowledgements
NIH R01CA160620, R01CA219964, UH3CA228699.References
- Muñoz R, Girotti A, Hileeto D, Arias FJ. Metronomic Anti-Cancer Therapy: A Multimodal Therapy Governed by the Tumor Microenvironment. Cancers (Basel). 2021;13(21):5414.
- Simsek C, Esin E, Yalcin S. Metronomic Chemotherapy: A Systematic Review of the Literature and Clinical Experience. J Oncol. 2019;2019:5483791.
- Chen CS, Doloff JC, Waxman DJ. Intermittent metronomic drug schedule is essential for activating antitumor innate immunity and tumor xenograft regression. Neoplasia. 2014;16(1):84-96.
- Zhang J,, Kiser K, Kim S. Whole tumor pharmacokinetic model analysis with 3D isotropic high resolution using 3D-UTE-GRASP sequence at 7T. ISMRM 2020 abstract 0007.
- Zhang J, Winters K, Reynaud O, Kim SG. Simultaneous measurement of T1 /B1 and pharmacokinetic model parameters using active contrast encoding (ACE)-MRI. NMR Biomed. 2017;30(9):10.
- Zhang J, Kim SG. Estimation of cellular-interstitial water exchange in dynamic contrast enhanced MRI using two flip angles. NMR Biomed. 2019;32(11):e4135.
- Zhang J, Winters K, Kiser K, Baboli M, Kim SG. Assessment of tumor treatment response using active contrast encoding (ACE)-MRI: Comparison with conventional DCE-MRI. PLoS One. 2020;15(6):e0234520.
Figures
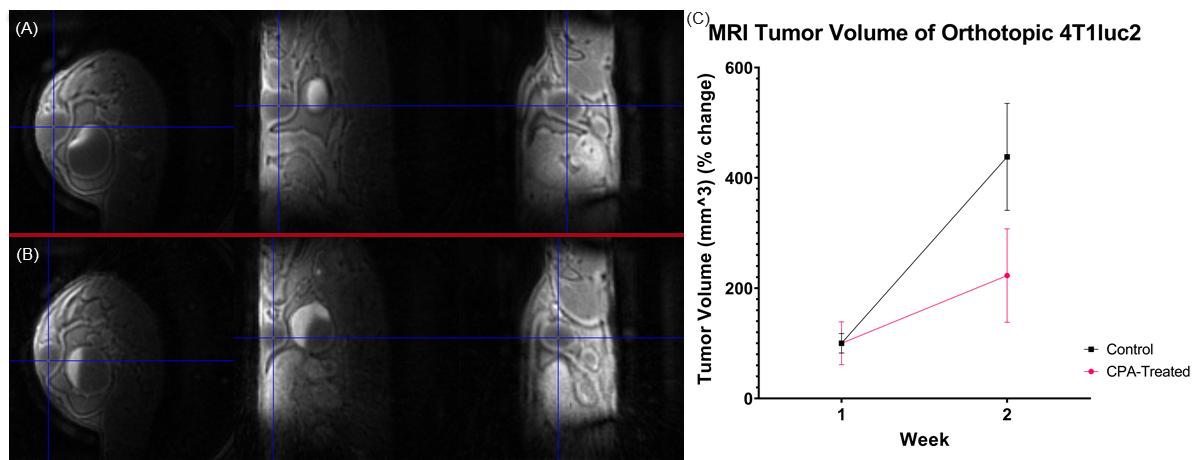
Figure 1. Representative 3D-UTE-GRASP images of tumors in three orthogonal planes.
(A) A control mouse at Week 2. (B) A treated mouse at Week 2. (C) Total tumor
volume measured using post-contrast images, i.e., the last frame of DCE-MRI (n=4
for control and n=6 for treated in Week 1 and n=3 for control and n=5 for
treated in Week 2).
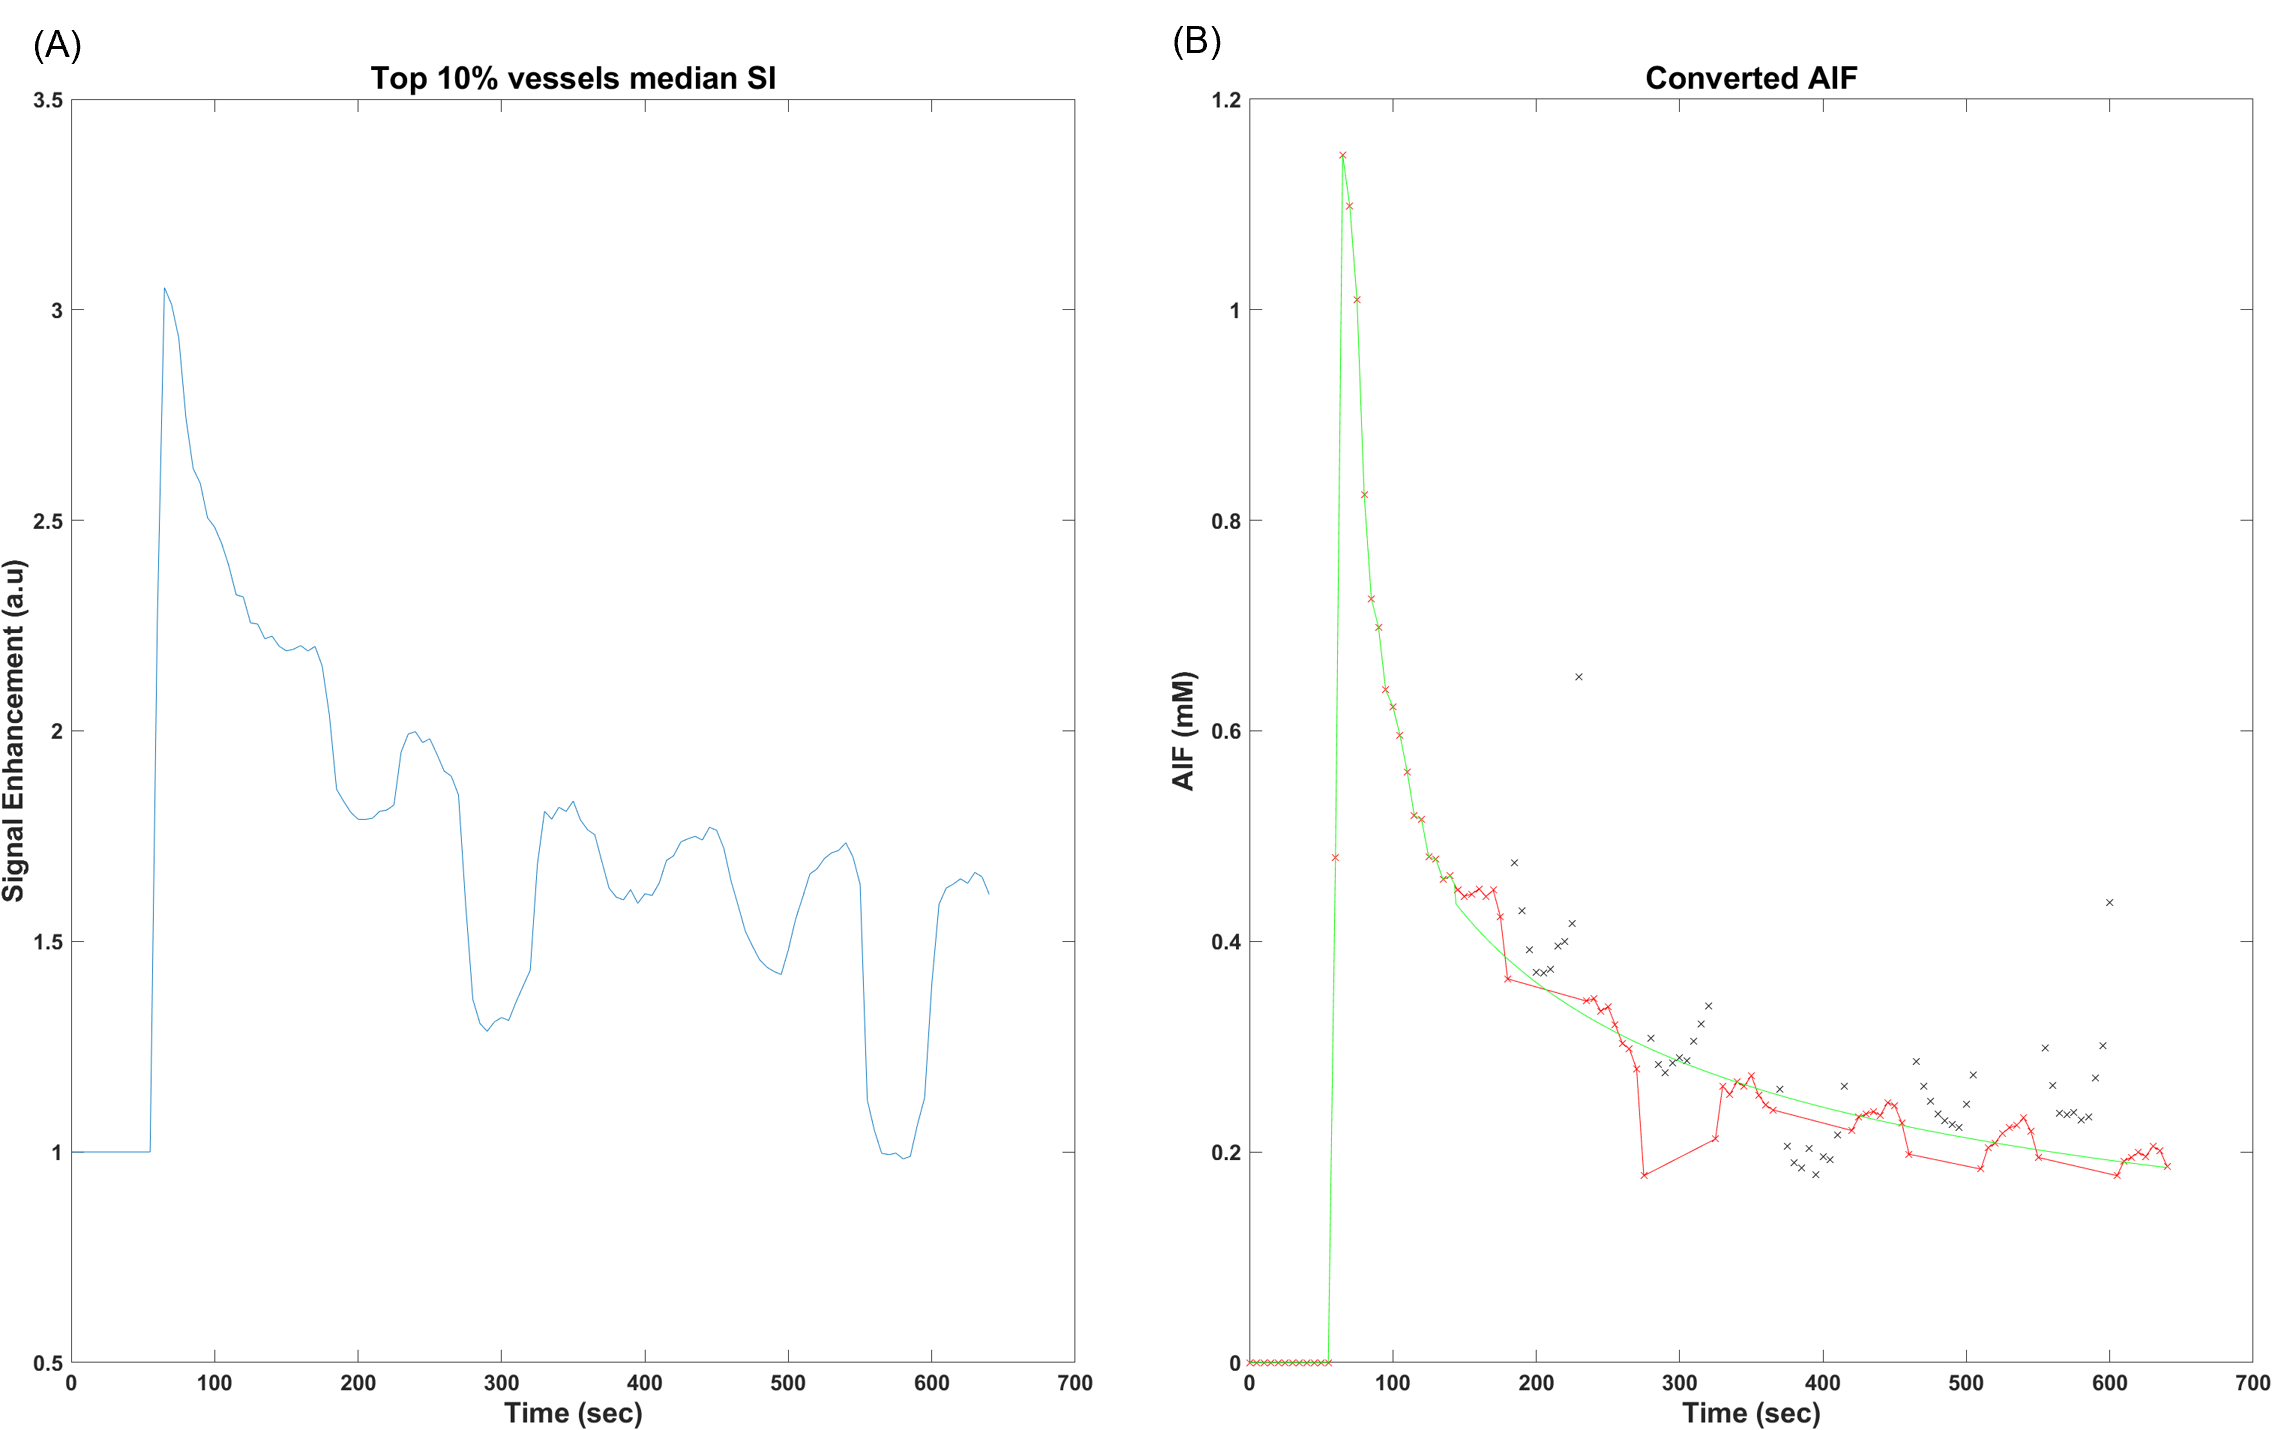
Figure 2. Measurement of the arterial input function. (A) Signal enhancement ratio curve generated from the selected voxels in an ROI for the mouse common iliac artery. Signal jumps in the washout region are due to the different flip angles used. (B) The AIF in concentration converted from the signal enhancement curve (black and red x). The data with the baseline flip angle of 10 deg (red cross) are used for fit with a log linear function (green line) which is used for the pharmacokinetic model analysis.
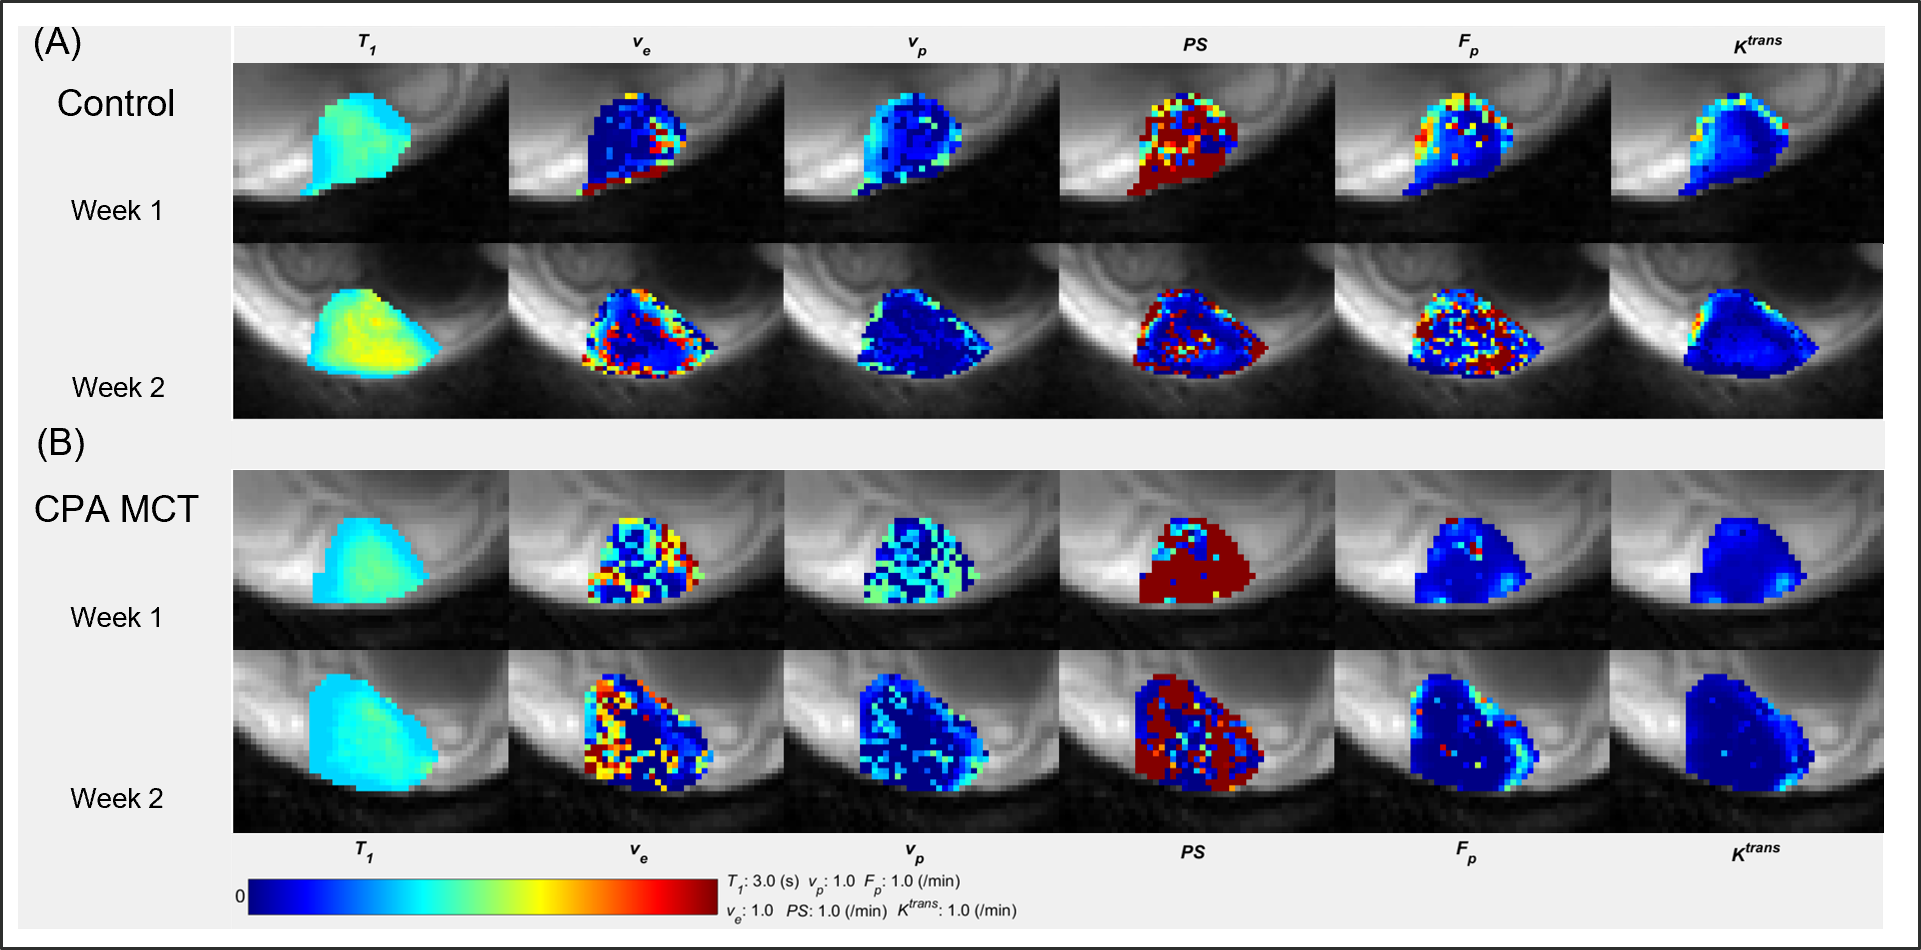
Figure 3. Pharmacokinetic parameter maps of a control tumor (A) and a treated
tumor (B).
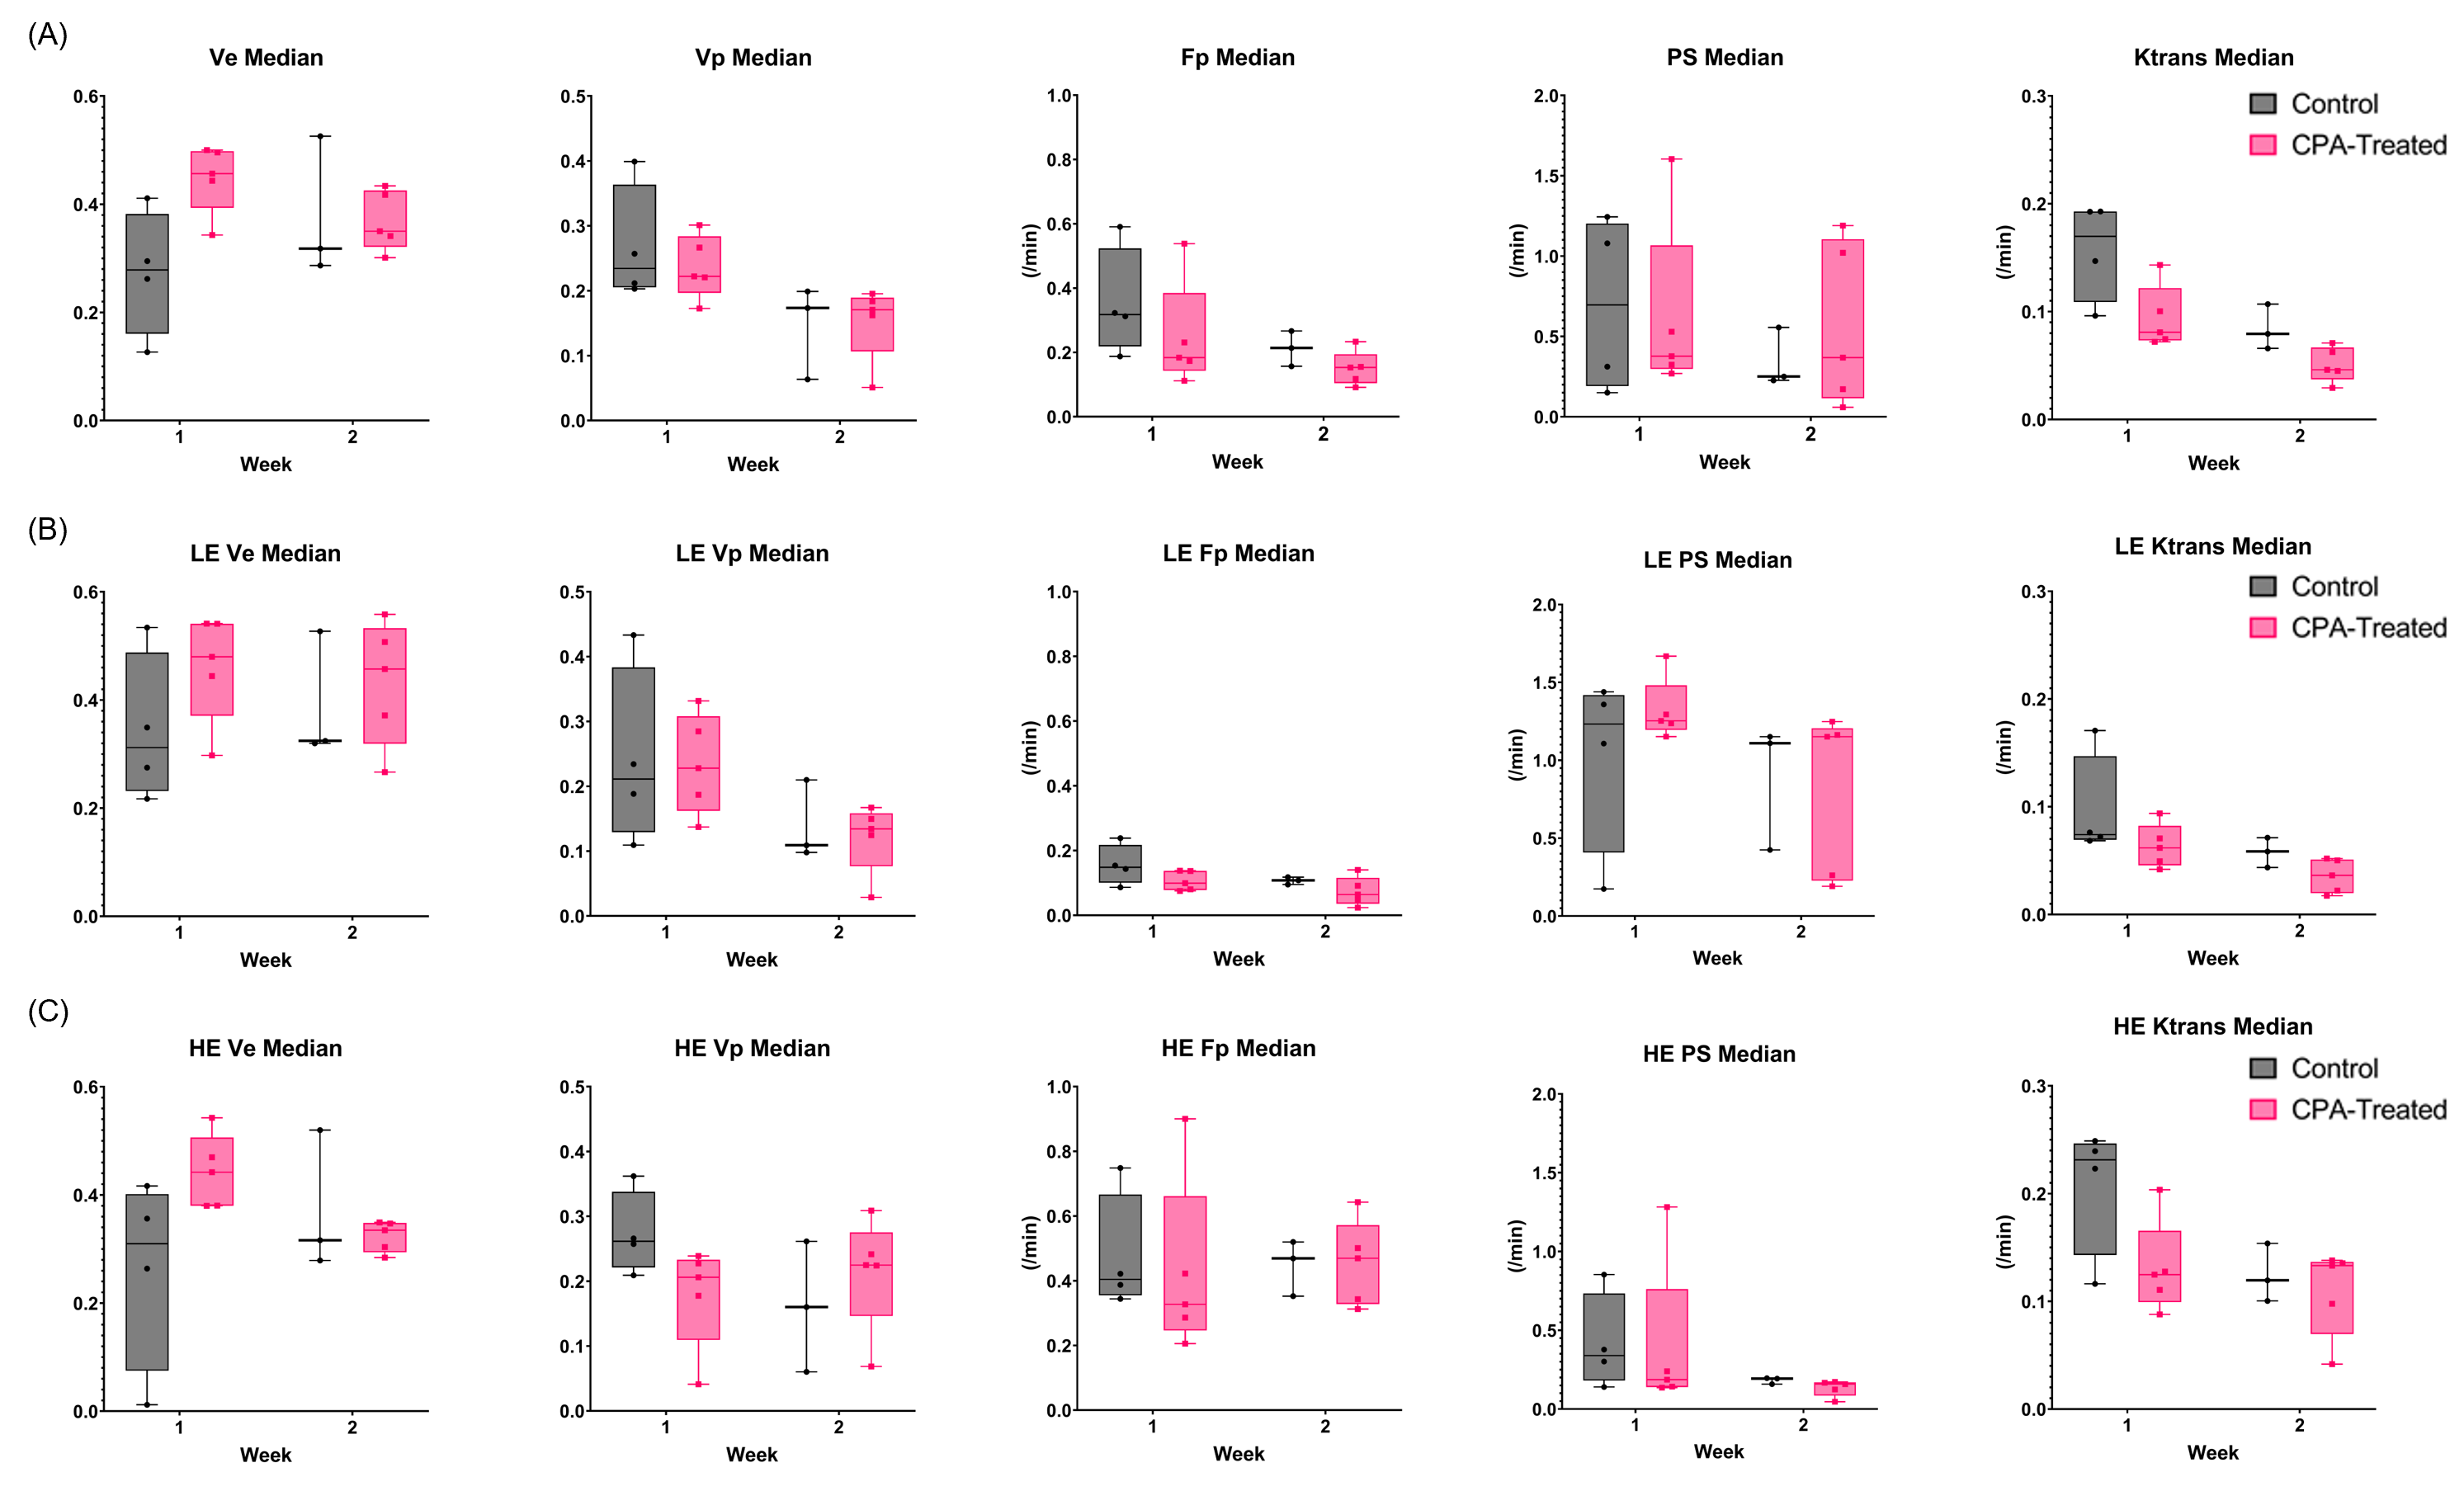
Figure 4. Box-whisker plots of pharmacokinetic parameters in the whole tumor (A),
low-enhancing (LE; IAUC < 0.4) region (B), and high-enhancing (HE; IAUC >
0.4) region (C).
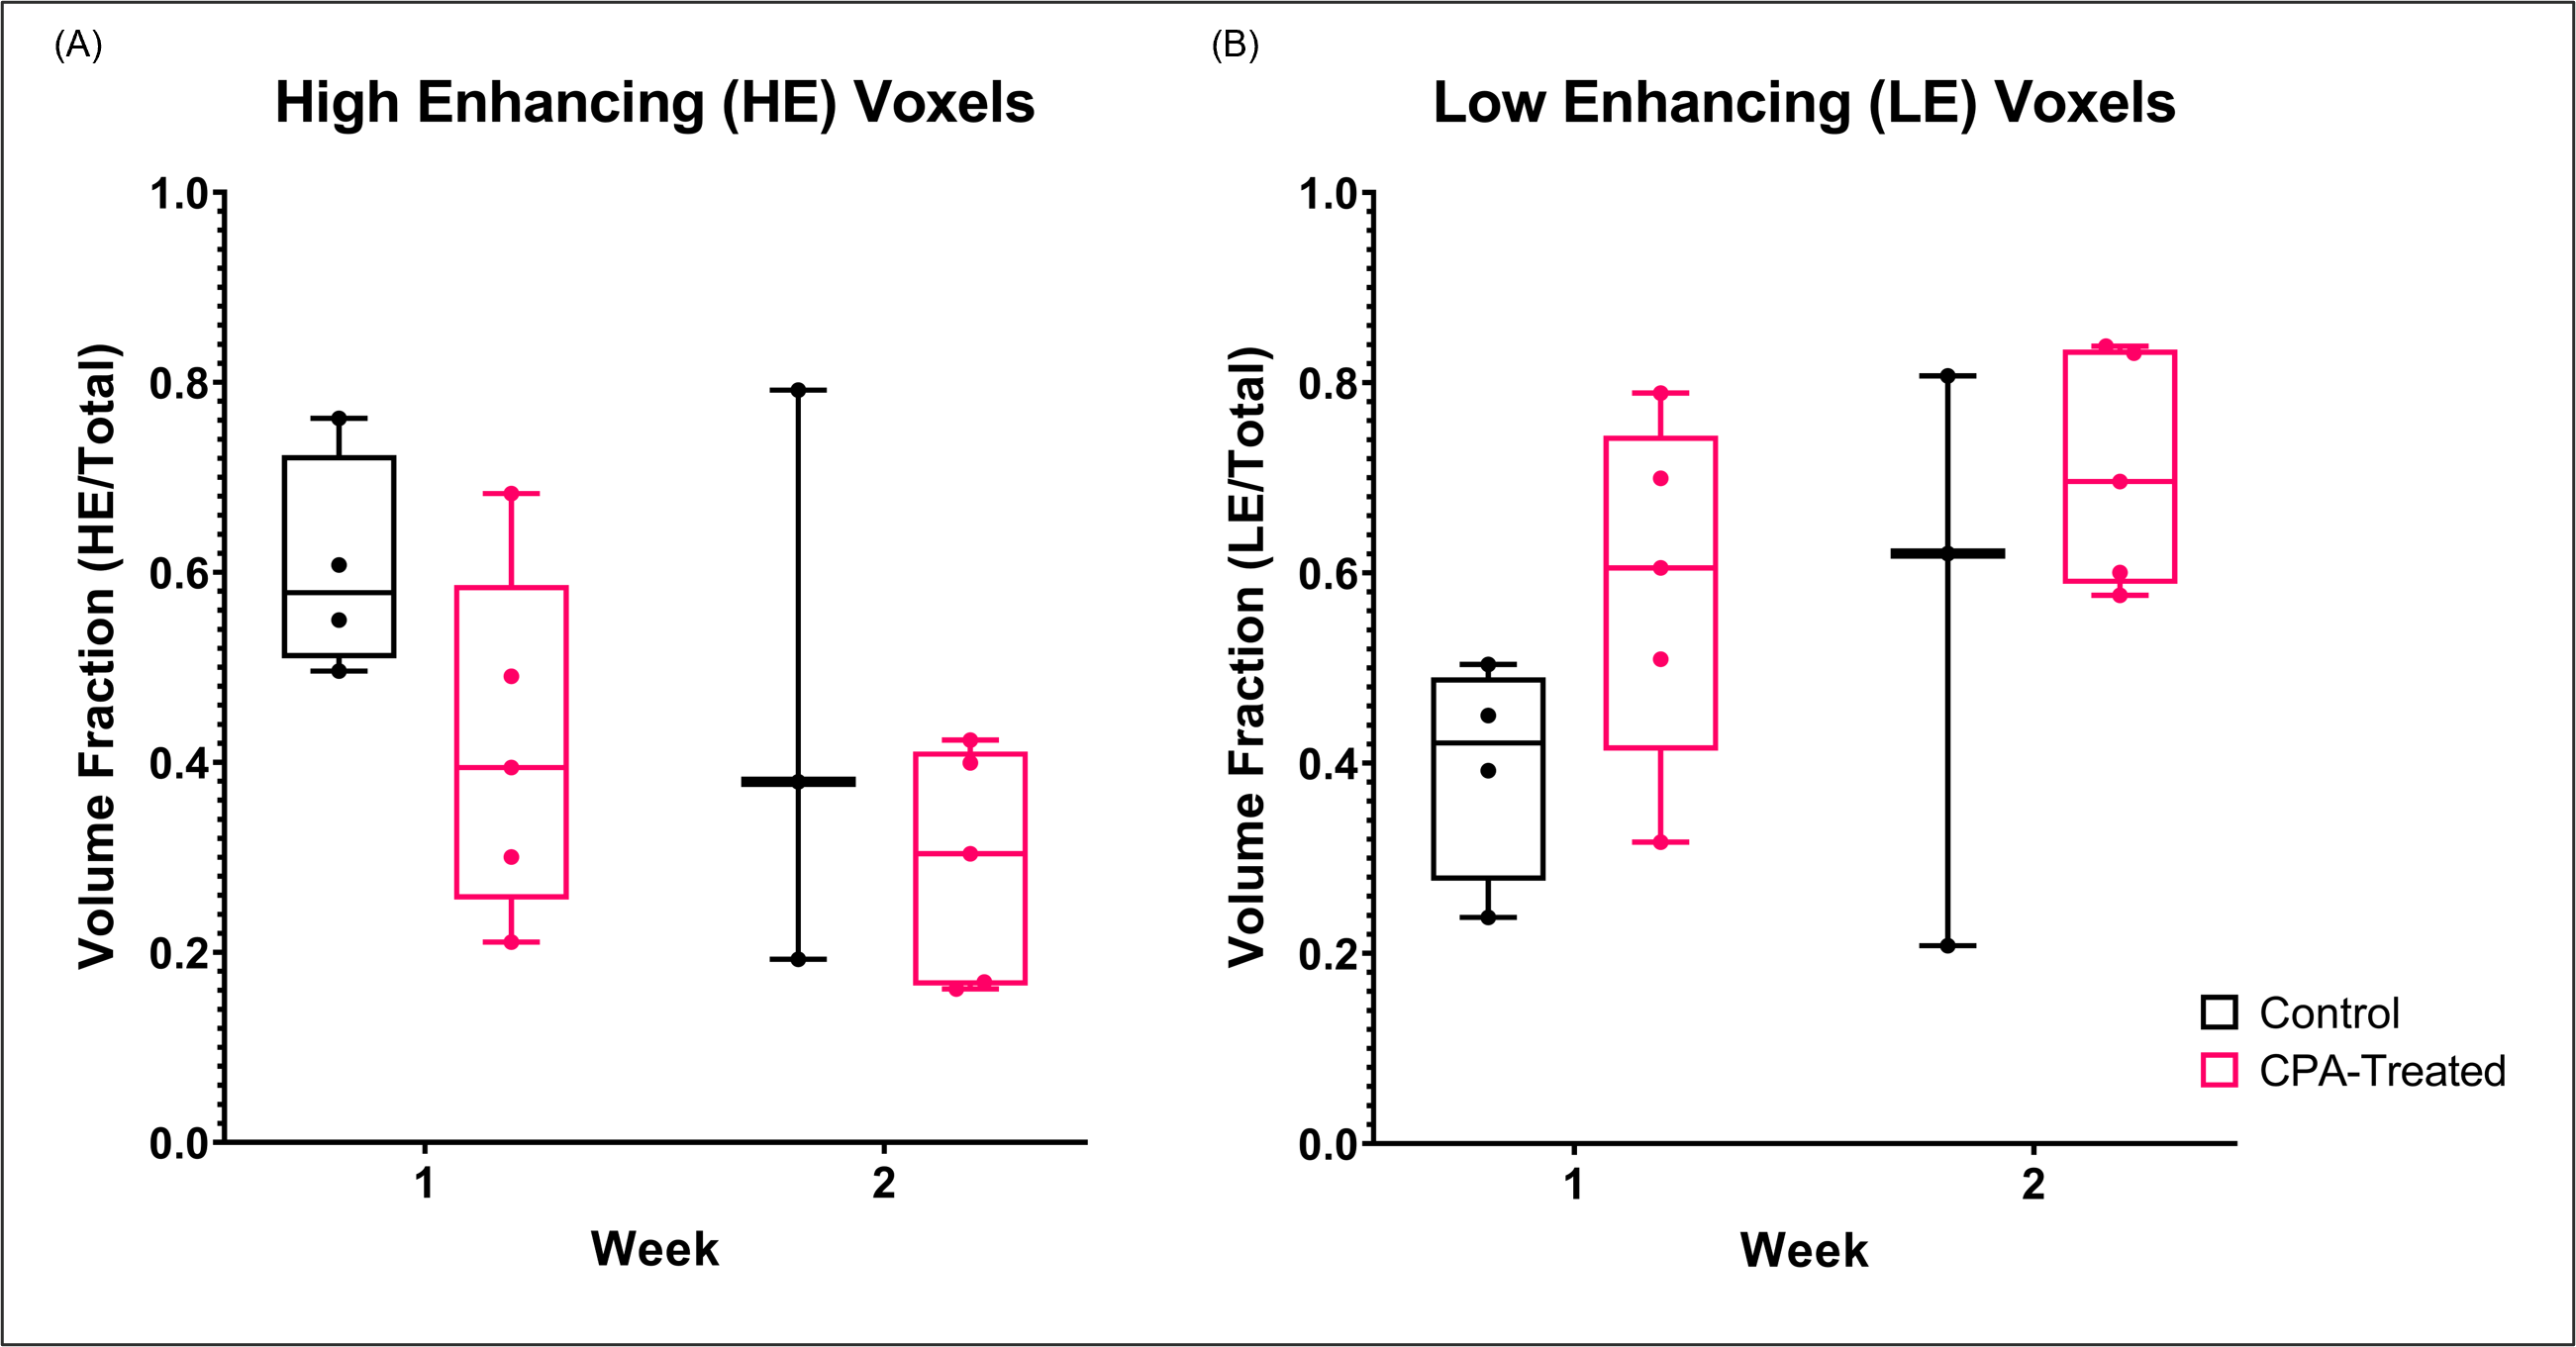
Figure 5. Volume fraction of the high-enhancing (HE) voxels (A) and low-enhancing
(LE) voxels (B) in the tumor.
DOI: https://doi.org/10.58530/2023/3395