3394
Integrated Fast High-Resolution MR Fingerprinting and Spectroscopic Imaging for Absolute Quantification of Metabolic Imaging1Radiology, A. A. Martinos Center for Biomedical Imaging, Charlestown, MA, United States, 2Radiology, Harvard Medical School, Boston, MA, United States, 3Neurology, Division of Neuro-Oncology, Boston, MA, United States, 4Neurology, Beth Israel Deaconess Medical Center, Boston, MA, United States, 5Neurology, Brigham’s and Women Hospital, Boston, MA, United States, 6Neuro-Oncology, Dana Farber Cancer Institute, Boston, MA, United States, 7Neurosurgery, Massachusetts General Hospital, Boston, MA, United States
Synopsis
Keywords: Tumors, Spectroscopy
Quantification of metabolite concentration is the primary concern in clinical MR Spectroscopic Imaging which is valuable to assess disease pathology. Absolute metabolite quantification requires correction of MRSI signal for T1/T2 relaxation and proton density, which due to time limitations are not measured in the subject of interest but assumed to be constant across all voxels based on assumed literature values. Here, we integrated 3D-Echo-Planar Time-resolved Imaging (3D-EPTI) that allows fast MR-fingerprinting of T1, T2 and PD with fast MRSI metabolic imaging in each subject. The metabolite quantification based on voxel-based MRF was compared to literature based relaxations and PD values.Introduction
In vivo proton MRSI provides quantitative measurement of multiple metabolites, including N-acetyl-aspartyl-glutamate (NAA+NAAG), choline (GPC+PCh), creatine (Cr+PCr), glutamate (Glu), glutamine (Gln), Myo-inositol (Ins) in the healthy brain, and 2-Hydroxyglutarate (2HG) in mutant IDH gliomas1. The concentration of these metabolites is a marker for the progress of several diseases, including cancer, multiple sclerosis, Alzheimer's disease, and dementia. The water signal is used as an internal reference for absolute metabolite quantification 2,3, which needs to be corrected for T1, T2 relaxation, and PD. So far, absolute quantification of MRSI corrects T1, T2, and PD using literature values, with constant values across the brain and subjects in healthy or disease conditions. This leads to inaccurate estimation of true metabolite concentration and suboptimal metabolic image contrast. Improvement in the estimation of metabolite concentrations requires voxel-based T1, T2, and PD values measured in every subject, which can be time prohibitive without efficient acquisition. To mitigate this limitation and improve our metabolite imaging quantification, we used 3D-EPTI4,5 that can acquire rapidly high-resolution whole-brain T1, T2, and PD maps by highly-accelerated k-t data sampling utilizing continuous readouts with the minimum dead time that takes advantage of spatiotemporal correlation at multiple timescales in and between continuous readouts.Method
Data acquisition: The study was approved by IRB, and all participants were provided with written consent. The scans were acquired on a Siemens 3T MRI system (Prisma, Siemens Healthcare GmbH, Erlangen, Germany) and a 32-channel head coil. A real-time navigated adiabatic spin-echo spiral whole-brain 3D MRSI sequence6 was used for metabolic imaging. The MRSI acquisition parameters were TR/TI/TE1/TE2 = 1800/210/32/65ms; FOV of 220x220x102mm3, matrix of 30x30x14, isotropic nominal voxel size 7.3x7.3x7.3 mm3, spectral window 1450 Hz, three angular interleaves, two temporal interleaves with a slew rate of 11.09 mT/m (127 mT/m/msec) per direction, and 3 weighted averages, the acquisition time of 9:50 min:s. Water unsuppressed MRSI was acquired with the same sequence with 1 average in 4 min. The 3D-EPTI were acquired with the following parameters: FOV = 220 ×176 ×210 mm3, matrix size=220×176×210, 1 mm isotropic voxel, echo spacing = 0.93ms, TR of IR-GE = 2600ms, TR of GRASE = 800ms, acquisition time 2:20 min:s. Seven subjects have been scanned so far in this study. Reconstruction: MRSI reconstruction consists of multiple steps: phase correction along spiral k-space trajectories, density compensation for the non-uniform k-space weighting of spirals, non-uniform discrete Fourier transform (NUDFT), B0-field correction, Hamming filtering in k-space and residual lipid removal with L1 norm regularization. Spectral fitting performed by LCModel v6.3-1L between 1.8 and 4.2 ppm range contained twenty metabolites. The basis set was simulated in GAMMA v4.3.3 by applying similar RF and gradient waveforms as performed by the scanner. A custom-built pipeline 5 was used to obtain super-resolution metabolic images with an upsampling factor of 3 to an isotropic voxel of 2.4 mm, which included 4 steps: 1) quality control, 2) voxel inpainting, 3) denoising and 4) feature-based super-resolution.Results
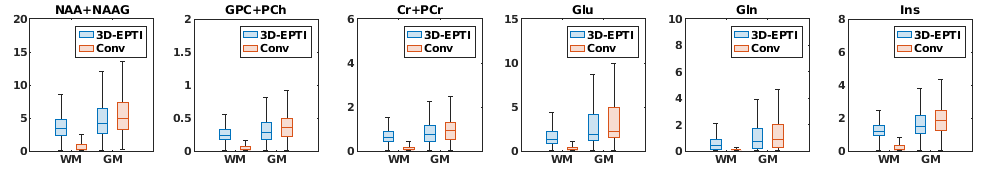
Figure 1 and 2 show representative absolute quantification maps calculated using T1, T2, and PD values from the literature (conventional) and measured by 3D-EPTI in a cancer patient (Fig 1) and healthy control (Fig 2), respectively. Figure 3 and 4 shows a box plot comparison of absolute quantification for each metabolite across the WM, GM, and tumor tissue between conventional and 3D-EPTI relaxation estimation for the patient and control, respectively.Discussion
There is higher contrast for absolute quantification metabolic images obtained using T1, T2, and PD measured by 3D-EPTI for the tumor in patients, as well for the gray-white matter in the healthy brain of normal volunteers. Significant differences are found between values of metabolite concentration obtained with the two methods. In particular, in patients, the T1, T2, and PD values deviate due to pathology from literature values measured in healthy subjects. Furthermore, regional and voxel-based differences exist within the same subject, which makes inaccurate the assumption of a constant value across the entire brain. Subject and voxel-specific measurement of MR parameters can improve the precision and accuracy of metabolite concentration, which translates into better image contrast and the ability to detect change over time. This is made feasible clinically by the fast acquisition of high-resolution MRF and MRSI data together with advanced super-resolution and quality control methods for metabolic images. Further validation and evaluation in more subjects and ground-truth phantoms are underway.Acknowledgements
This work is supported by NIH (R01 CA211080, R01 CA255479, P50 CA165962).References
1. Maudsley AA, Andronesi OC, Barker PB, et al. Advanced magnetic resonance spectroscopic neuroimaging: Experts' consensus recommendations. NMR in biomedicine. 2020(Special Issue:Advanced methodology for in vivo magnetic resonance spectroscopy):e4309.
2. Ernst T, Kreis R, Ross BD. Absolute Quantitation of Water and Metabolites in the Human Brain. I. Compartments and Water. Journal of Magnetic Resonance, Series B. 1993;102(1):1-8.
3. Kreis R, Ernst T, Ross BD. Absolute Quantitation of Water and Metabolites in the Human Brain. II. Metabolite Concentrations. Journal of Magnetic Resonance, Series B. 1993;102(1):9-19.
4. Wang F, Dong Z, Reese TG, et al. Echo planar time-resolved imaging (EPTI). Magn Reson Med. 2019;81(6):3599-3615.
5. Wang F, Dong Z, Reese TG, Rosen B, Wald LL, Setsompop K. 3D Echo Planar Time-resolved Imaging (3D-EPTI) for ultrafast multi-parametric quantitative MRI. Neuroimage. 2022 Apr 15;250:118963.
6. Li X, Strasser B, Jafari-Khouzani K, et al. Super-Resolution Whole-Brain 3D MR Spectroscopic Imaging for Mapping D-2-Hydroxyglutarate and Tumor Metabolism in Isocitrate Dehydrogenase 1–mutated Human Gliomas. Radiology. 2020;294(2):589-597.
Figures
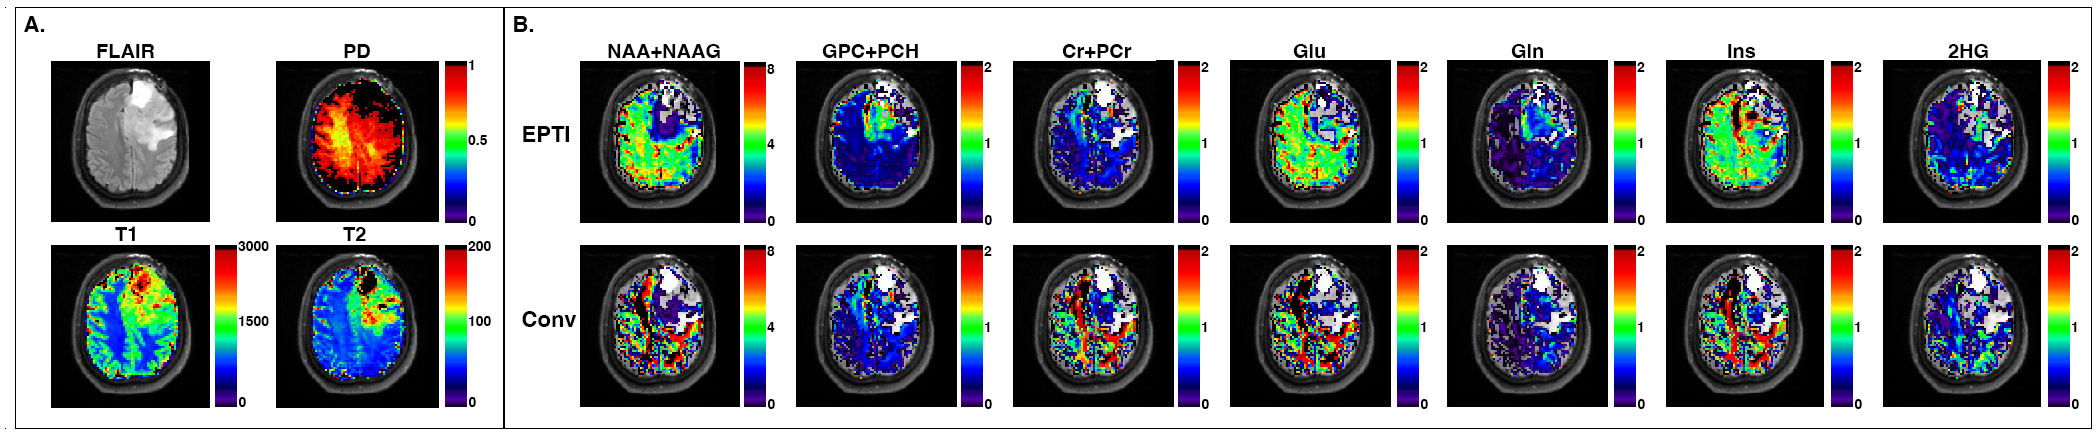
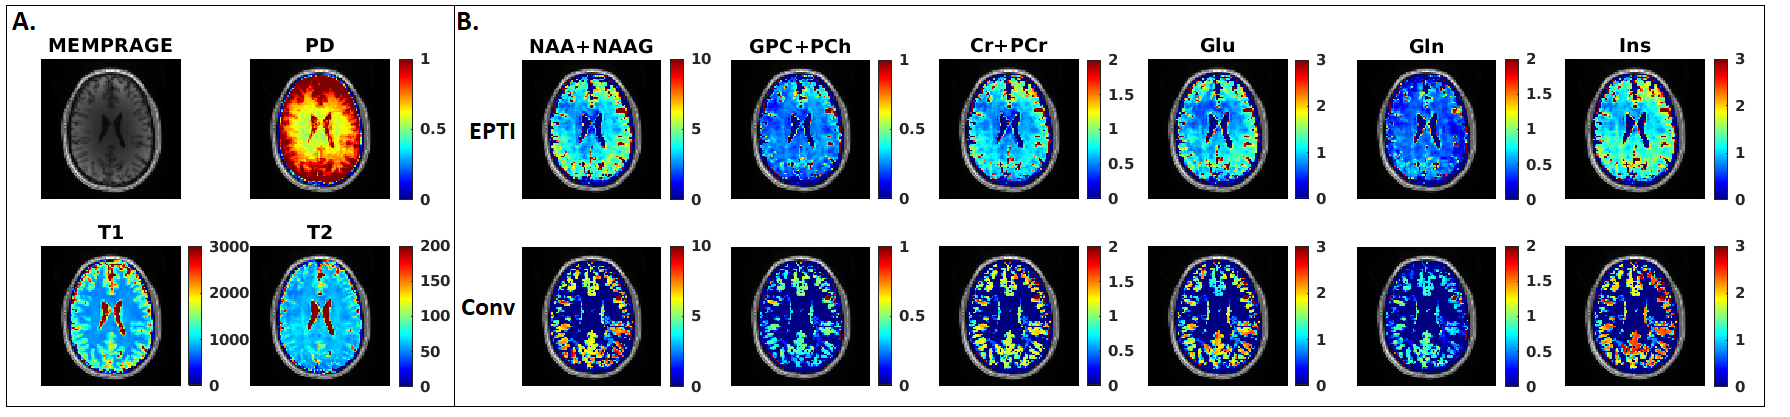
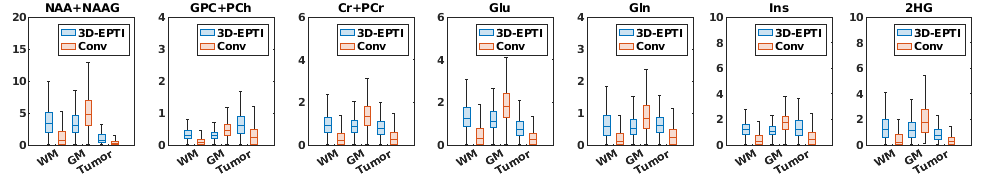
Figure 3. Boxplot comparison in mutant IDH glioma of the absolute quantification concentration (in mM) across white matter (WM), gray matter (GM), and tumor ROI using EPTI and assumed (conv.) T1, T2, PD values.