3393
Mapping changes in tissue 23Na concentration and cerebral blood flow during a visual task using ASL and functional Sodium Imaging (fNaI)
Iris Asllani1,2, Balázs Örzsik1, Samira Bouyagoub1, Joseph Woods3, Itamar Ronen1, Guillaume Madelin4, and Mara Cercignani5
1University of Sussex, Brighton, United Kingdom, 2Rochester Institute of Technology, Rochester, NY, United States, 3University of Oxford, Oxford, United Kingdom, 4New York University, New York, NY, United States, 5Cardiff University, Cardiff, United Kingdom
1University of Sussex, Brighton, United Kingdom, 2Rochester Institute of Technology, Rochester, NY, United States, 3University of Oxford, Oxford, United Kingdom, 4New York University, New York, NY, United States, 5Cardiff University, Cardiff, United Kingdom
Synopsis
Keywords: Quantitative Imaging, Neuro, Sodium MRI, fMRI, Arterial Spin Labeling, Partial Volume Correction
Sodium MRI was combined with arterial spin labeling (ASL) perfusion MRI to detect changes in total sodium concentration (TSC) and cerebral blood flow (CBF) associated with visual tast activation on 6 healthy volunteers. There was no overlap between the areas in the visual cortex where there was a significant change in CBF (~38%) and the regions where a change (~11%) in TSC was detected. Results from partial volume correction indicate that most of the changes in TSC originated in the white matter.INTRODUCTION
Sodium is involved in several vital cellular processes, including regulation of osmotic pressure, conduction of action potentials, generation of muscle contractions, and proper functioning of the glymphatic system1,2. A persistent imbalance in sodium concentration across different cellular compartments could lead to tissue dysfunction and eventually apoptosis1. Growing evidence points toward a direct link between sodium imbalance and various pathologies, including prevalent neurological disorders such as Alzheimer’s disease and multiple sclerosis1. This link, as well as advances in hardware and software, have led to a recent surge in 23Na MRI studies; the number of publications in 2022 was more than double that in 2011 (source: pubmed.gov, search query "sodium MRI"). The majority of studies to-date have use sodium MRI to test for differences in sodium concentration between two different cohorts at baseline. There has been only one study that has looked at changes in sodium concentration associated with task activation3. While investigating these changes could provide crucial insight into the physiological mechanisms of disease onset and progression, application of 23Na MRI during task-activation remains challenging owing to the relatively low SNR, which in turn leads to low spatial resolution and longer acquisition blocks. The low spatial resolution exacerbates the partial volume effect (PVE), i.e., the mixing of the 23Na signals originating from different tissues within a given voxel4. And because signal changes during task activation are thought to occur mostly at the tissue boundaries3, correcting for PVE may help in distinguishing between tissue-specific changes in sodium concentration. With these considerations in mind, we set out to measure changes in gray and white matter sodium concentration during a visual task using a PV correction (PVC) algorithm originally developed for ASL MRI4. Perfusion images, acquired with ASL, were used to map changes in cerebral blood flow associated with the task.Methods
MRI protocol: CBF pCASL5 (lab. duration 2s, lab. delay 1.8s, TE/TR=14ms/4.5s) and 23Na MRI (FLORET6, TE/TR=0.2ms/100ms) were acquired during baseline and visual task (checker-board flicker frequency 8Hz, block: 9mins ON, 9mins OFF) on 6 healthy volunteers (age range [22–60] y, mean 37±14y, 1F) on a Siemens 3T system. A T1w (resolution: 1mm3 isotropic) was also acquired on each volunteer for registration and segmentation purposes. Two agar phantoms, 65mM and 155mM NaCl, were placed inside the coil to calibrate and compute the total Na concentration at each voxel.Processing & Analysis: A description of the PVC algorithm and its application in 23Na MRI can be found in previous publications4,7. Voxelwise baseline-vs-task comparisons (SPM12 paired t-test, pcorr<0.001 for ASL, pcorr<0.01 for 23Na images) were performed on PV-uncorrected data as well as the tissue specific (GM and WM) images obtained from the PV-correction the CBF and Na images, independently. ROIs were constructed by thresholding of the T_maps (T>2.0). GM and WM conjunction masks were computed to contain voxels with PV>20% for each given tissue.
Results
Average ASL CBF and 23Na MR images acquired during visual activation are shown in Figure 1 for uncorrected and PVC data. To provide a visual sense of the voxelwise PV variability across subjects, GM- and WM PV-maps from two random subjects are shown in Figure 2. The group-level GM and WM masks (PV>70%, a typical threshold for tissue masking4), contained only ~ 66% and ~ 79% of the individual GM and WM masks, respectively. Statistical T_maps (p<0.001 for ASL and p<0.01, extended threshold=100 voxels, a=0.5) for 23Na images testing for the signal being higher during task than during baseline are shown in Figure 3. Averaged across subjects, there was a 39%±13% increase in CBF during the task activation. The total sodium concentration (TSC) increased, on average, 11%± 8% and 9%±7% in WM and GM, respectively.Discussion
Changes in TSC were measured during a visual task activation. Results indicate that most of these changes occurred in WM. There was no overlap between areas with significant change in CBF (as measured by ASL) and areas with changes in TSC. Considering the low sample size and the overall lack of published studies measuring changes in TSC during task activation, caution is warranted in interpreting these data, including the efficacity and sensitivity of the PVC algorithm in extracting tissue information from sodium MRI images.Acknowledgements
No acknowledgement found.References
1Madelin G. and Regatte R.R., J Magn Reson Imaging 38(3), 2013; 2Jessen N.A. et al., Neurochem Res., 40(12), 2015; 3Gandini Wheeler-Kingshot C. A. M., Frontiers in Neuroscience, Vol.12, 2018; 4Asllani I., et al., Mag. Res. Med., 2009; 5J G Pipe et al. MRM, 2011; 6Alsop D.C. et al., Mag. Res. Med., 2014.Figures
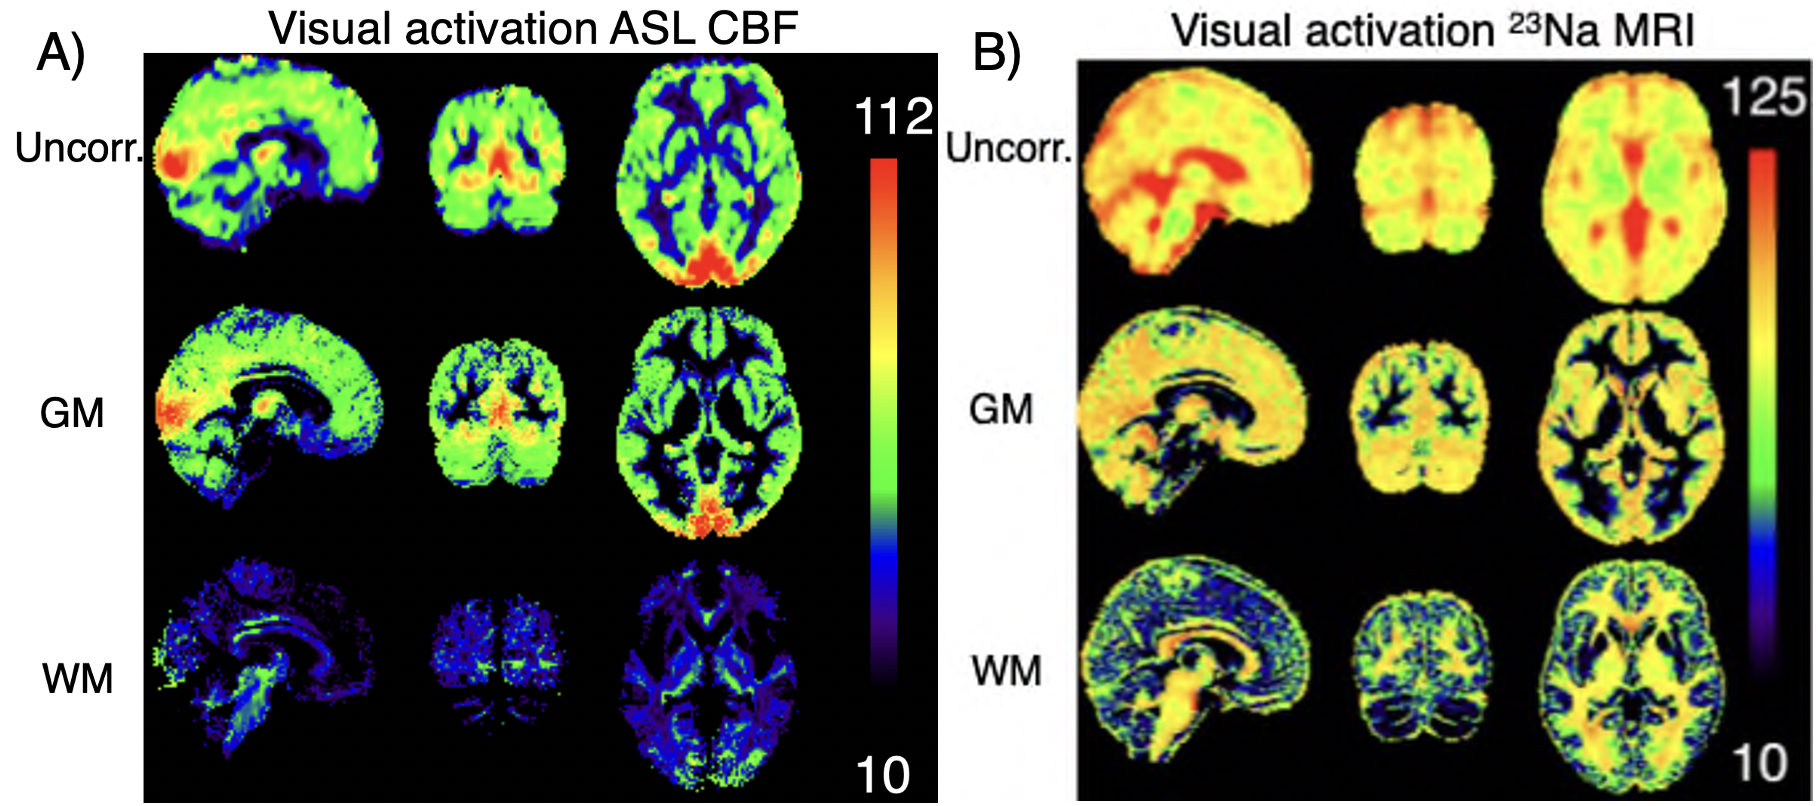
Subject-wise average of CBF ASL (A) and 23Na MRI (B) acquired during visual activation. Note that while the increase in CBF in the visual cortex is apparent in the ASL data (A), this was not the case for 23Na. Note also the overall good coregistration across subjects for both modalities. Color bar represents physiological units of (A) flow [mL/100g*min], and (B) concentration [mM].
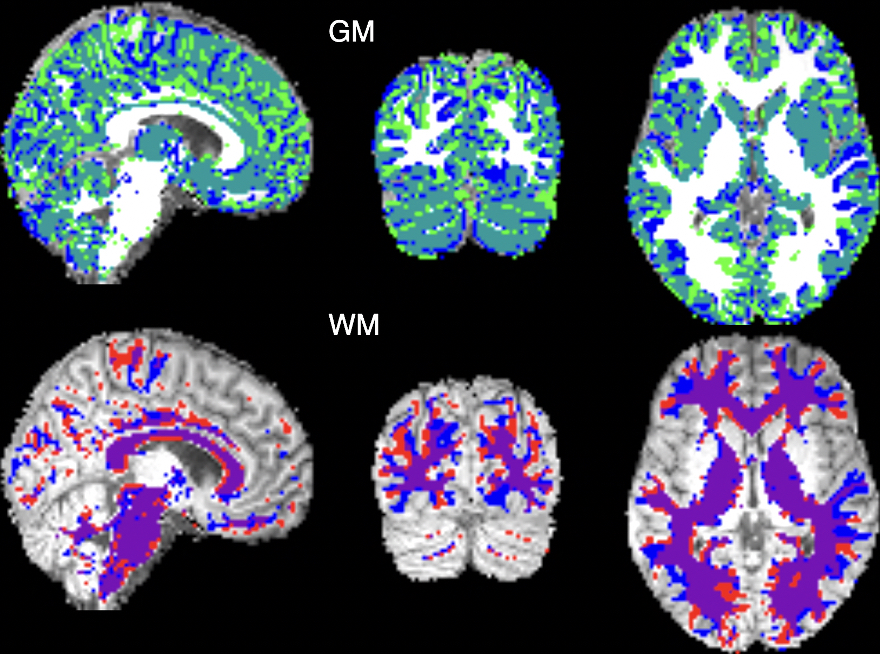
Thresholded (>70%) GM (upper row) and WM (lower row) masks from 2 randomly selected subjects are overlaid on one of the subject's T1w image. Note the discrepancy between the masks, especially at the tissue border.
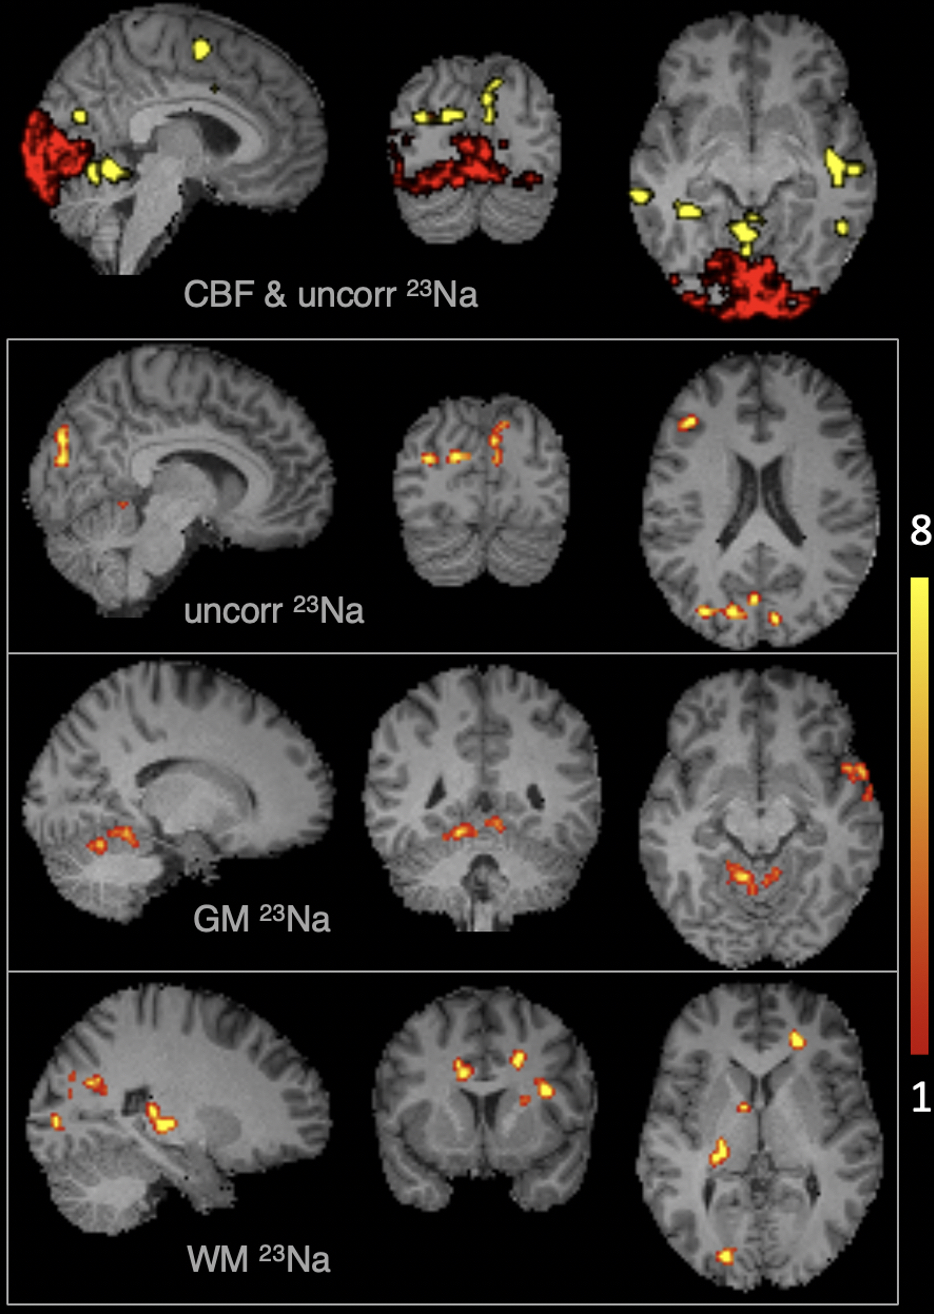
1st row: Voxels that survived the statistical threshold (p<0.01) for the task > baseline condition for GM CBF (red) and uncorrected 23Na (yellow) images. Rows 2–4: T_maps overlaid on a subject's T1w .
DOI: https://doi.org/10.58530/2023/3393