3389
Automated QSM Processing in Multiple Sclerosis
Ashley Stewart1, Po-Jui Liu2,3, Matthias Weigel2,3, Steffen Bollmann1, and Cristina Granziera2,3
1School for Information Technology and Electrical Engineering, The University of Queensland, Brisbane, Australia, 2Translational Imaging in Neurology (ThINk) Basel, Department of Biomedical Engineering, Faculty of Medicing, University Hospital of Basel and University of Basel, Basel, Switzerland, Basel, Switzerland, 3Neurological Clinic and Policlinic, MS Center and Research Center for Clinical Neuroimmunology and Neuroscience Basel (RC2NB), University Hospital Basel and University of Basel, Basel, Switzerland, Basel, Switzerland
1School for Information Technology and Electrical Engineering, The University of Queensland, Brisbane, Australia, 2Translational Imaging in Neurology (ThINk) Basel, Department of Biomedical Engineering, Faculty of Medicing, University Hospital of Basel and University of Basel, Basel, Switzerland, Basel, Switzerland, 3Neurological Clinic and Policlinic, MS Center and Research Center for Clinical Neuroimmunology and Neuroscience Basel (RC2NB), University Hospital Basel and University of Basel, Basel, Switzerland, Basel, Switzerland
Synopsis
Keywords: Multiple Sclerosis, Susceptibility
In this work, an automated and scalable processing tool for Quantitative Susceptibility Mapping (QSM), QSMxT, is applied to a large dataset of 3D echo-planar imaging (3D-EPI) acquisitions of Multiple Sclerosis (MS) patients and volunteer controls. This is used to reconstruct QSMs for all subjects and generate a group space for the study. MS lesions are depicted and compared across multiple contrasts, including FLAIR, MP2RAGE, 3D-EPI magnitude and QSM. The group space is used to generate average QSM images for the MS and control groups along with a difference image to investigate iron accumulation and demyelination patterns.Introduction
Multiple sclerosis (MS) is an autoimmune, inflammatory and degenerative disorder of the central nervous system, and is characterised by areas of focal demyelination and remyelination in white matter and grey matter, diffuse inflammation and degeneration, iron accumulation in specific lesions and cells, as well as disruption of the blood-brain barrier (BBB)1. Compared with conventional MRI and susceptibility-weighted imaging (SWI), quantitative susceptibility mapping (QSM) more accurately depicts the spatial geometry of iron deposition as well as changes in myelination. This information helps to characterise MS lesions even without the support of a contrast agent2-6.In this work, an automated and scalable QSM processing tool, QSMxT, is applied to a large dataset of 3D echo-planar imaging (3D-EPI) acquisitions of MS patients and volunteer controls. This was used to reconstruct QSMs for all subjects and generate a group space for the study. MS lesions are depicted and compared across multiple contrasts, including FLAIR, MP2RAGE, 3D-EPI magnitude and QSM. The group space is used to generate average QSM images for the MS and control groups and a difference image to investigate iron accumulation and demyelination patterns.
Methods
Prior to this experiment, approval was given by the Ethics Commission of Northwestern and Central Switzerland.Data were acquired at the University Hospital of Basel from 49 healthy volunteers and 38 MS patients using a protocol including FLAIR, MP2RAGE, and 3D-EPI for QSM. The 3D-EPI sequence was acquired with 0.67 mm3 isotropic resolution, TE=35 ms, TR=64 ms, TA=6:19, FA=10°, and pixel bandwidth = 395 Hz. Phased array channels were combined using the pre-scan normalise plus adaptive combine approach7. All data were acquired using a MAGNETOM Prisma whole-body 3T scanner (Siemens Healthcare, Erlangen, Germany) with a 64-channel head/neck coil on software version VE11C.
QSM was reconstructed for all acquisitions using QSMxT v1.1.10 running on a high-performance cluster system to process the data in parallel8,9. QSMxT uses TGV-QSM10 for the phase unwrapping, background field correction, and dipole inversion steps. The mask-filling strength was set to 1 dilation step, and all other settings were left at their defaults.
A group space was generated for the study using QSMxT, which uses ANTs for the underlying registration steps11. Average QSM images were then created for both the MS patient and control groups, along with a difference image.
Results
Differences in lesion presentation were identified across the FLAIR, MP2RAGE, 3D-EPI and QSM images, providing complementary information that may assist in lesion characterisation and their status as either active, inactive, remyelinated or chronic active lesions12 (see Figure 1).The group space generated for the study was used to generate average QSM images and difference images for the two subject groups (see Figure 2). The difference image highlights the increased magnetic susceptibility of the MS patient average in the putamen compared with the control group and in regions of normal-appearing white matter (NAWM).
Discussion and conclusions
The novel QSMxT workflow was applied to a large dataset of 3D-EPI acquisitions of MS patients and controls. The FLAIR, MP2RAGE, 3D-EPI and QSM images provide complementary information through their depiction of MS lesions, which may aid in their characterisation as either active, inactive, remyelinated or chronic active lesions. The increased magnetic susceptibility of the putamen in the MS patient group is indicative of iron accumulation13-16, whereas the increased susceptibility in NAWM may be related to demyelination processes17.The QSM results and group spaces were generated automatically using QSMxT using a cluster computing system to process them in parallel. This made the findings of this work straightforward to realise and highlights the robustness and useful capabilities of the workflow and its potential for large-scale clinical studies.
Acknowledgements
No acknowledgement found.References
- R. Dobson and G. Giovannoni, “Multiple sclerosis – a review,” European Journal of Neurology, vol. 26, no. 1, pp. 27–40, 2019, doi: 10.1111/ene.13819.
- W. Chen et al., “Quantitative Susceptibility Mapping of Multiple Sclerosis Lesions at Various Ages,” Radiology, vol. 271, no. 1, Art. no. 1, Apr. 2014, doi: 10.1148/radiol.13130353.
- C. Wisnieff, S. Ramanan, J. Olesik, S. Gauthier, Y. Wang, and D. Pitt, “Quantitative susceptibility mapping (QSM) of white matter multiple sclerosis lesions: Interpreting positive susceptibility and the presence of iron,” Magnetic Resonance in Medicine, vol. 74, no. 2, pp. 564–570, 2015, doi: 10.1002/mrm.25420.
- Y. Zhang et al., “Longitudinal change in magnetic susceptibility of new enhanced multiple sclerosis (MS) lesions measured on serial quantitative susceptibility mapping (QSM),” Journal of Magnetic Resonance Imaging, vol. 44, no. 2, pp. 426–432, 2016, doi: 10.1002/jmri.25144.
- S. Zhang, T. D. Nguyen, Y. Zhao, S. A. Gauthier, Y. Wang, and A. Gupta, “Diagnostic accuracy of semiautomatic lesion detection plus quantitative susceptibility mapping in the identification of new and enhancing multiple sclerosis lesions,” NeuroImage: Clinical, vol. 18, pp. 143–148, Jan. 2018, doi: 10.1016/j.nicl.2018.01.013.
- K. M. Gillen et al., “QSM is an imaging biomarker for chronic glial activation in multiple sclerosis lesions,” Annals of Clinical and Translational Neurology, vol. 8, no. 4, pp. 877–886, 2021, doi: 10.1002/acn3.51338.
- V. Jellúš and S. A. Kannengiesser, “Adaptive coil combination using a body coil scan as phase reference,” In Proceedings of the 22nd Annual Meeting of ISMRM, 2014. Abstract 4406.
- A. W. Stewart et al., “QSMxT: Robust masking and artifact reduction for quantitative susceptibility mapping,” Magnetic Resonance in Medicine, vol. 87, no. 3, pp. 1289–1300, 2022, doi: 10.1002/mrm.29048.
- QSMxT: A Complete QSM Processing Framework. QSMxT, 2022. Accessed: Feb. 21, 2022. [Online]. Available: https://github.com/QSMxT/QSMxT
- C. Langkammer et al., “Fast quantitative susceptibility mapping using 3D EPI and total generalized variation,” NeuroImage, vol. 111, pp. 622–630, May 2015, doi: 10.1016/j.neuroimage.2015.02.041.
- B. B. Avants, N. J. Tustison, M. Stauffer, G. Song, B. Wu, and J. C. Gee, “The Insight ToolKit image registration framework,” Frontiers in Neuroinformatics, vol. 8, p. 44, Apr. 2014, doi: 10.3389/fninf.2014.00044.
- R. Rahmanzadeh et al., “A New Advanced MRI Biomarker for Remyelinated Lesions in Multiple Sclerosis,” Annals of Neurology, vol. 92, no. 3, pp. 486–502, 2022, doi: 10.1002/ana.26441.
- C. Langkammer et al., “Quantitative Susceptibility Mapping in Multiple Sclerosis,” vol. 267, no. 2, p. 9, 2013.
- D. Cobzas, H. Sun, A. J. Walsh, R. M. Lebel, G. Blevins, and A. H. Wilman, “Subcortical gray matter segmentation and voxel-based analysis using transverse relaxation and quantitative susceptibility mapping with application to multiple sclerosis,” Journal of Magnetic Resonance Imaging, vol. 42, no. 6, pp. 1601–1610, 2015, doi: 10.1002/jmri.24951.
- E. Fujiwara et al., “Cognitive Implications of Deep Gray Matter Iron in Multiple Sclerosis,” AJNR Am J Neuroradiol, vol. 38, no. 5, pp. 942–948, May 2017, doi: 10.3174/ajnr.A5109.
- R. Zivadinov et al., “Brain Iron at Quantitative MRI Is Associated with Disability in Multiple Sclerosis,” Radiology, vol. 289, no. 2, pp. 487–496, Nov. 2018, doi: 10.1148/radiol.2018180136.
- V. Wiggermann et al., “Susceptibility-sensitive MRI of multiple sclerosis lesions and the impact of normal-appearing white matter changes,” NMR in Biomedicine, vol. 30, no. 8, p. e3727, 2017, doi: 10.1002/nbm.3727.
Figures
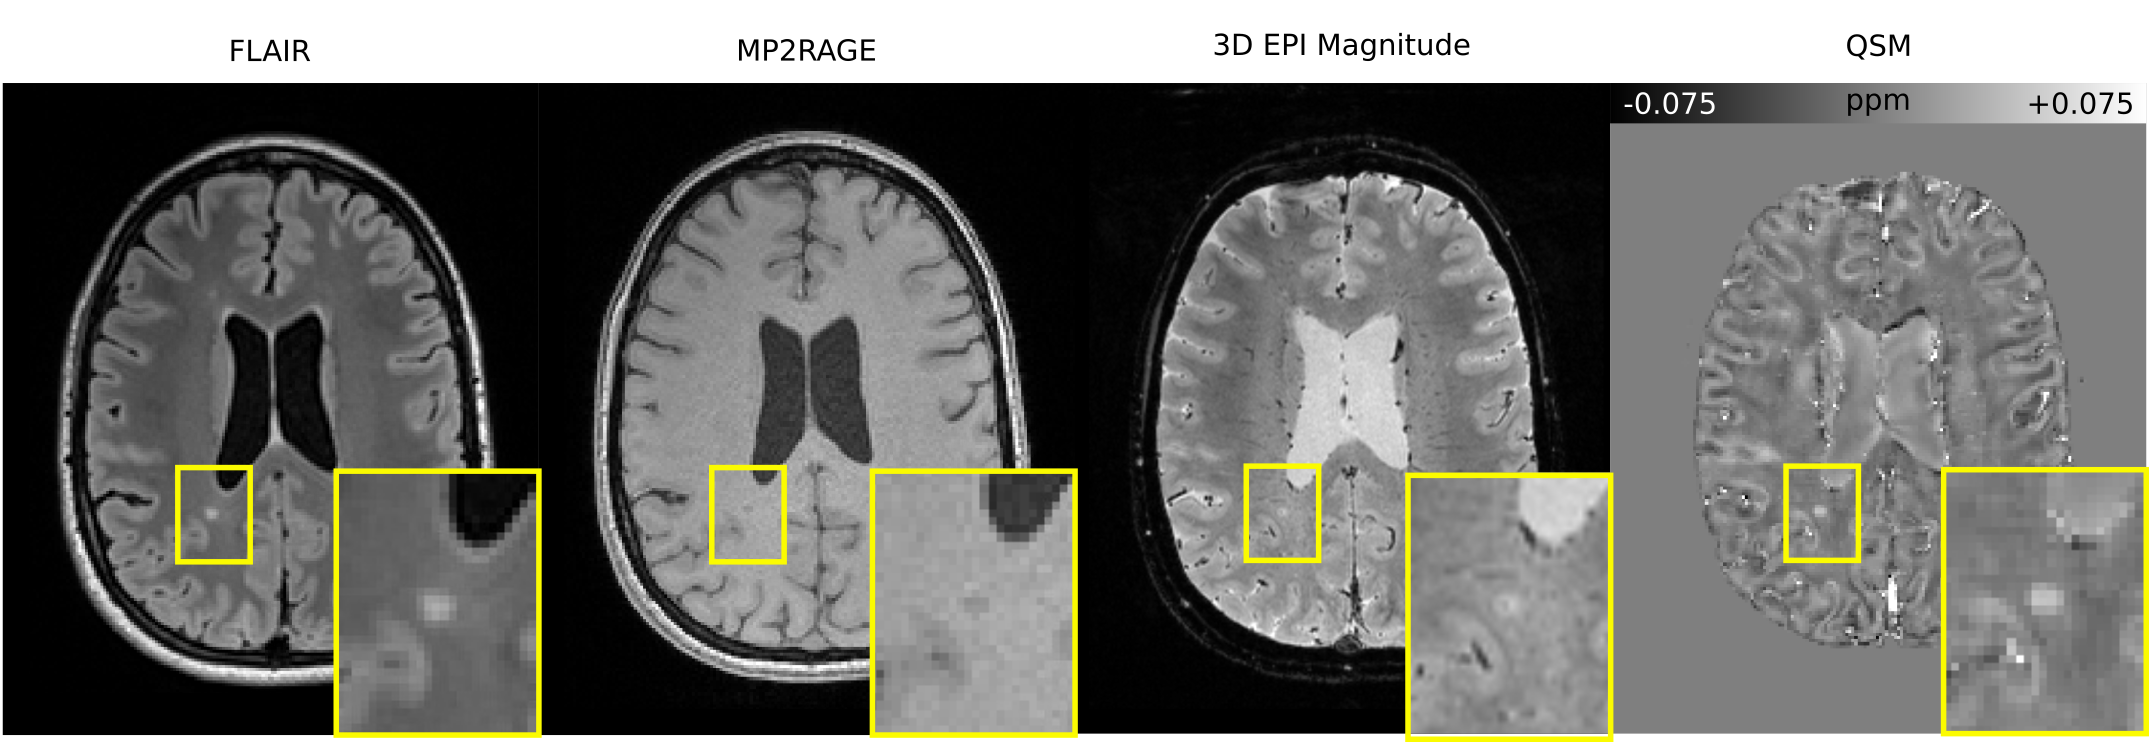
MS patient brain visualised using several MRI contrasts including FLAIR, MP2RAGE, 3D-EPI magnitude and QSM, axial slice. The yellow box indicates a zoomed-in region containing an MS lesion. The MP2RAGE image shows a hypointensity in the vicinity of the lesion, whereas the other contrasts show hyperintensities.
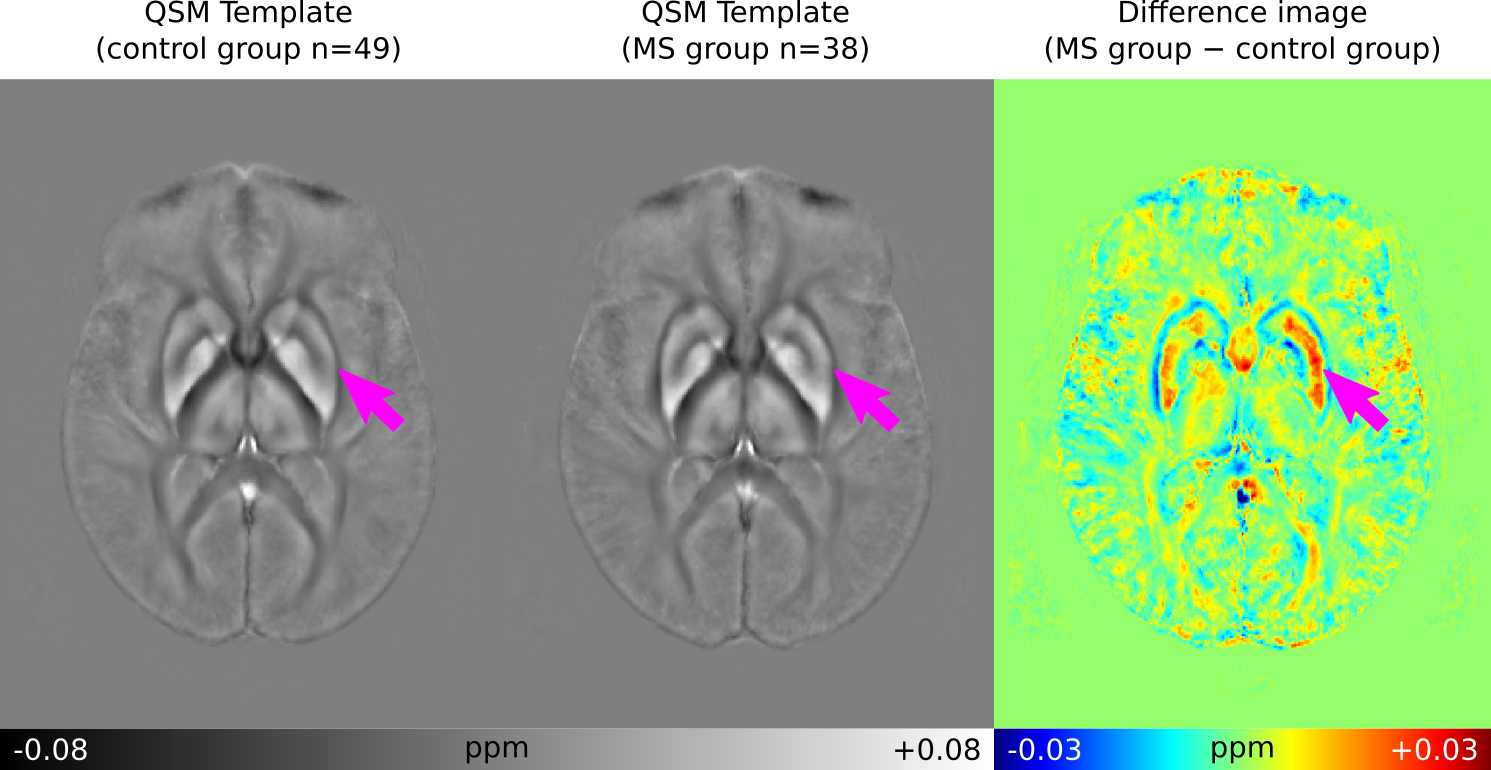
QSM averages generated using QSMxT for the control group (n=49) and the MS patient group (n=38), along with a difference image, axial slice. The magenta arrows indicate the putamen, which shows increased susceptibility in the MS group.
DOI: https://doi.org/10.58530/2023/3389