3388
Investigation of cerebrovascular reactivity of multiple sclerosis patients using multi-modal EEG-fMRI study in hypercapnia condition1Radiology, Cleveland Clinic, Cleveland, OH, United States, 2Eplepsy, Cleveland Clinic, Cleveland, OH, United States, 3Mellen Center for Multiple Sclerosis, Cleveland Clinic, Cleveland, OH, United States
Synopsis
Keywords: Multiple Sclerosis, Multimodal, EEG
We investigated the change of EEG power, BOLD and CBF contrast during visual stimulation in multiple sclerosis patients and healthy controls. The result shows that cerebrovascular reactivity is disrupted in MS patients compared to controls.Introduction
Altered blood oxygenation level dependent (BOLD) activation has been consistently reported in fMRI studies of multiple sclerosis (MS) patients in comparison to age and sex matched healthy control subjects 1-3. These altered findings are widely interpreted to be evidence of plasticity, or functional reorganization in response to the disease. However, it is also known that MS patients have impaired cerebral hemodynamics when compared to healthy controls 4-6. In this study, we assess the cerebrovascular reactivity of MS patients and compare with age-matched normal-controls using simultaneous EEG-fMRI studies during a simple visual task.Methods
Study Population: Eleven MS patients (age = 53±6 year, 7F) and 15 controls (53±9 year, 9F) satisfied the study inclusion criterion. The age and gender of the two populations were not statistically different (p > 0.05).MRI Data collection: fMRI data were collected using a custom multi-slice (SMS) excited double echo pseudo-continuous tagging arterial spin labeling sequence at 3T (TR=4s, TEs=13.4ms/37ms, 3.8x3.8x5mm3, 18 slices, MB=3, tagging=1.5s, PD=2s) 7. Four blocks of 4 Hz flashing checkerboard was projected during 2 scans. 5% of CO2 mixed gas was delivered 2 times in each 2 mins.
MRI analysis: The activated region-of-interest (ROI) was defined with p < 0.01 using cerebral blood flow (CBF) images during VT. The percent change in CBF and BOLD during VT and HC was calculated within the ROI. In addition, resting state (rs-)fMRI data were collected with a single shot EPI sequence, and resting state fluctuation amplitude (RSFA) was calculated 8.
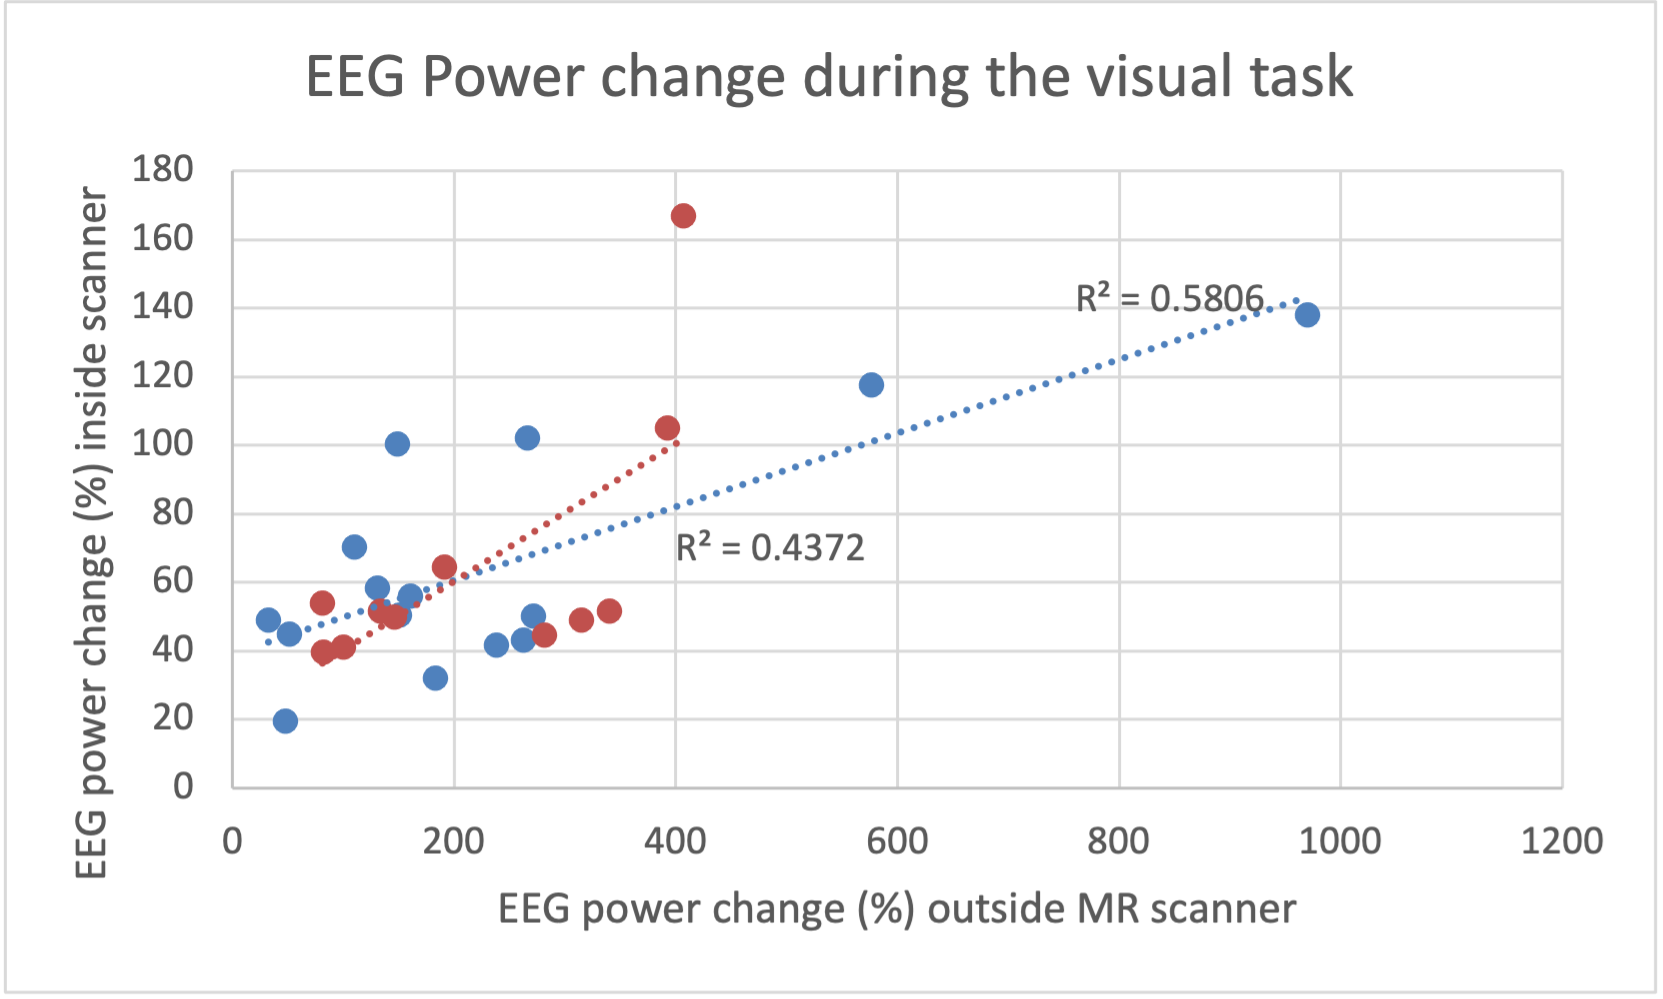
EEG acquisition and analysis: We acquired simultaneous EEG-fMRI using 64 channel electrodes. We recorded EEG both inside and outside the scanner during VT. We used template subtraction to remove MR gradient artifacts 9, then removed cardioballistic, eye blink, vibration, and residual scanner artifacts. We performed spectral decomposition of EEG data acquired during VT and estimated the normalized power changes at 4 Hz, compared to baseline.
Statistical analysis: We analyzed the relationship between different fMRI measures and EEG power in both groups. Using a step-wise regression approach, different models were tested, progressively including all combinations of predictors (i.e. regressors) with age and gender. We report only statistically significant regression models (p<0.05).
Result
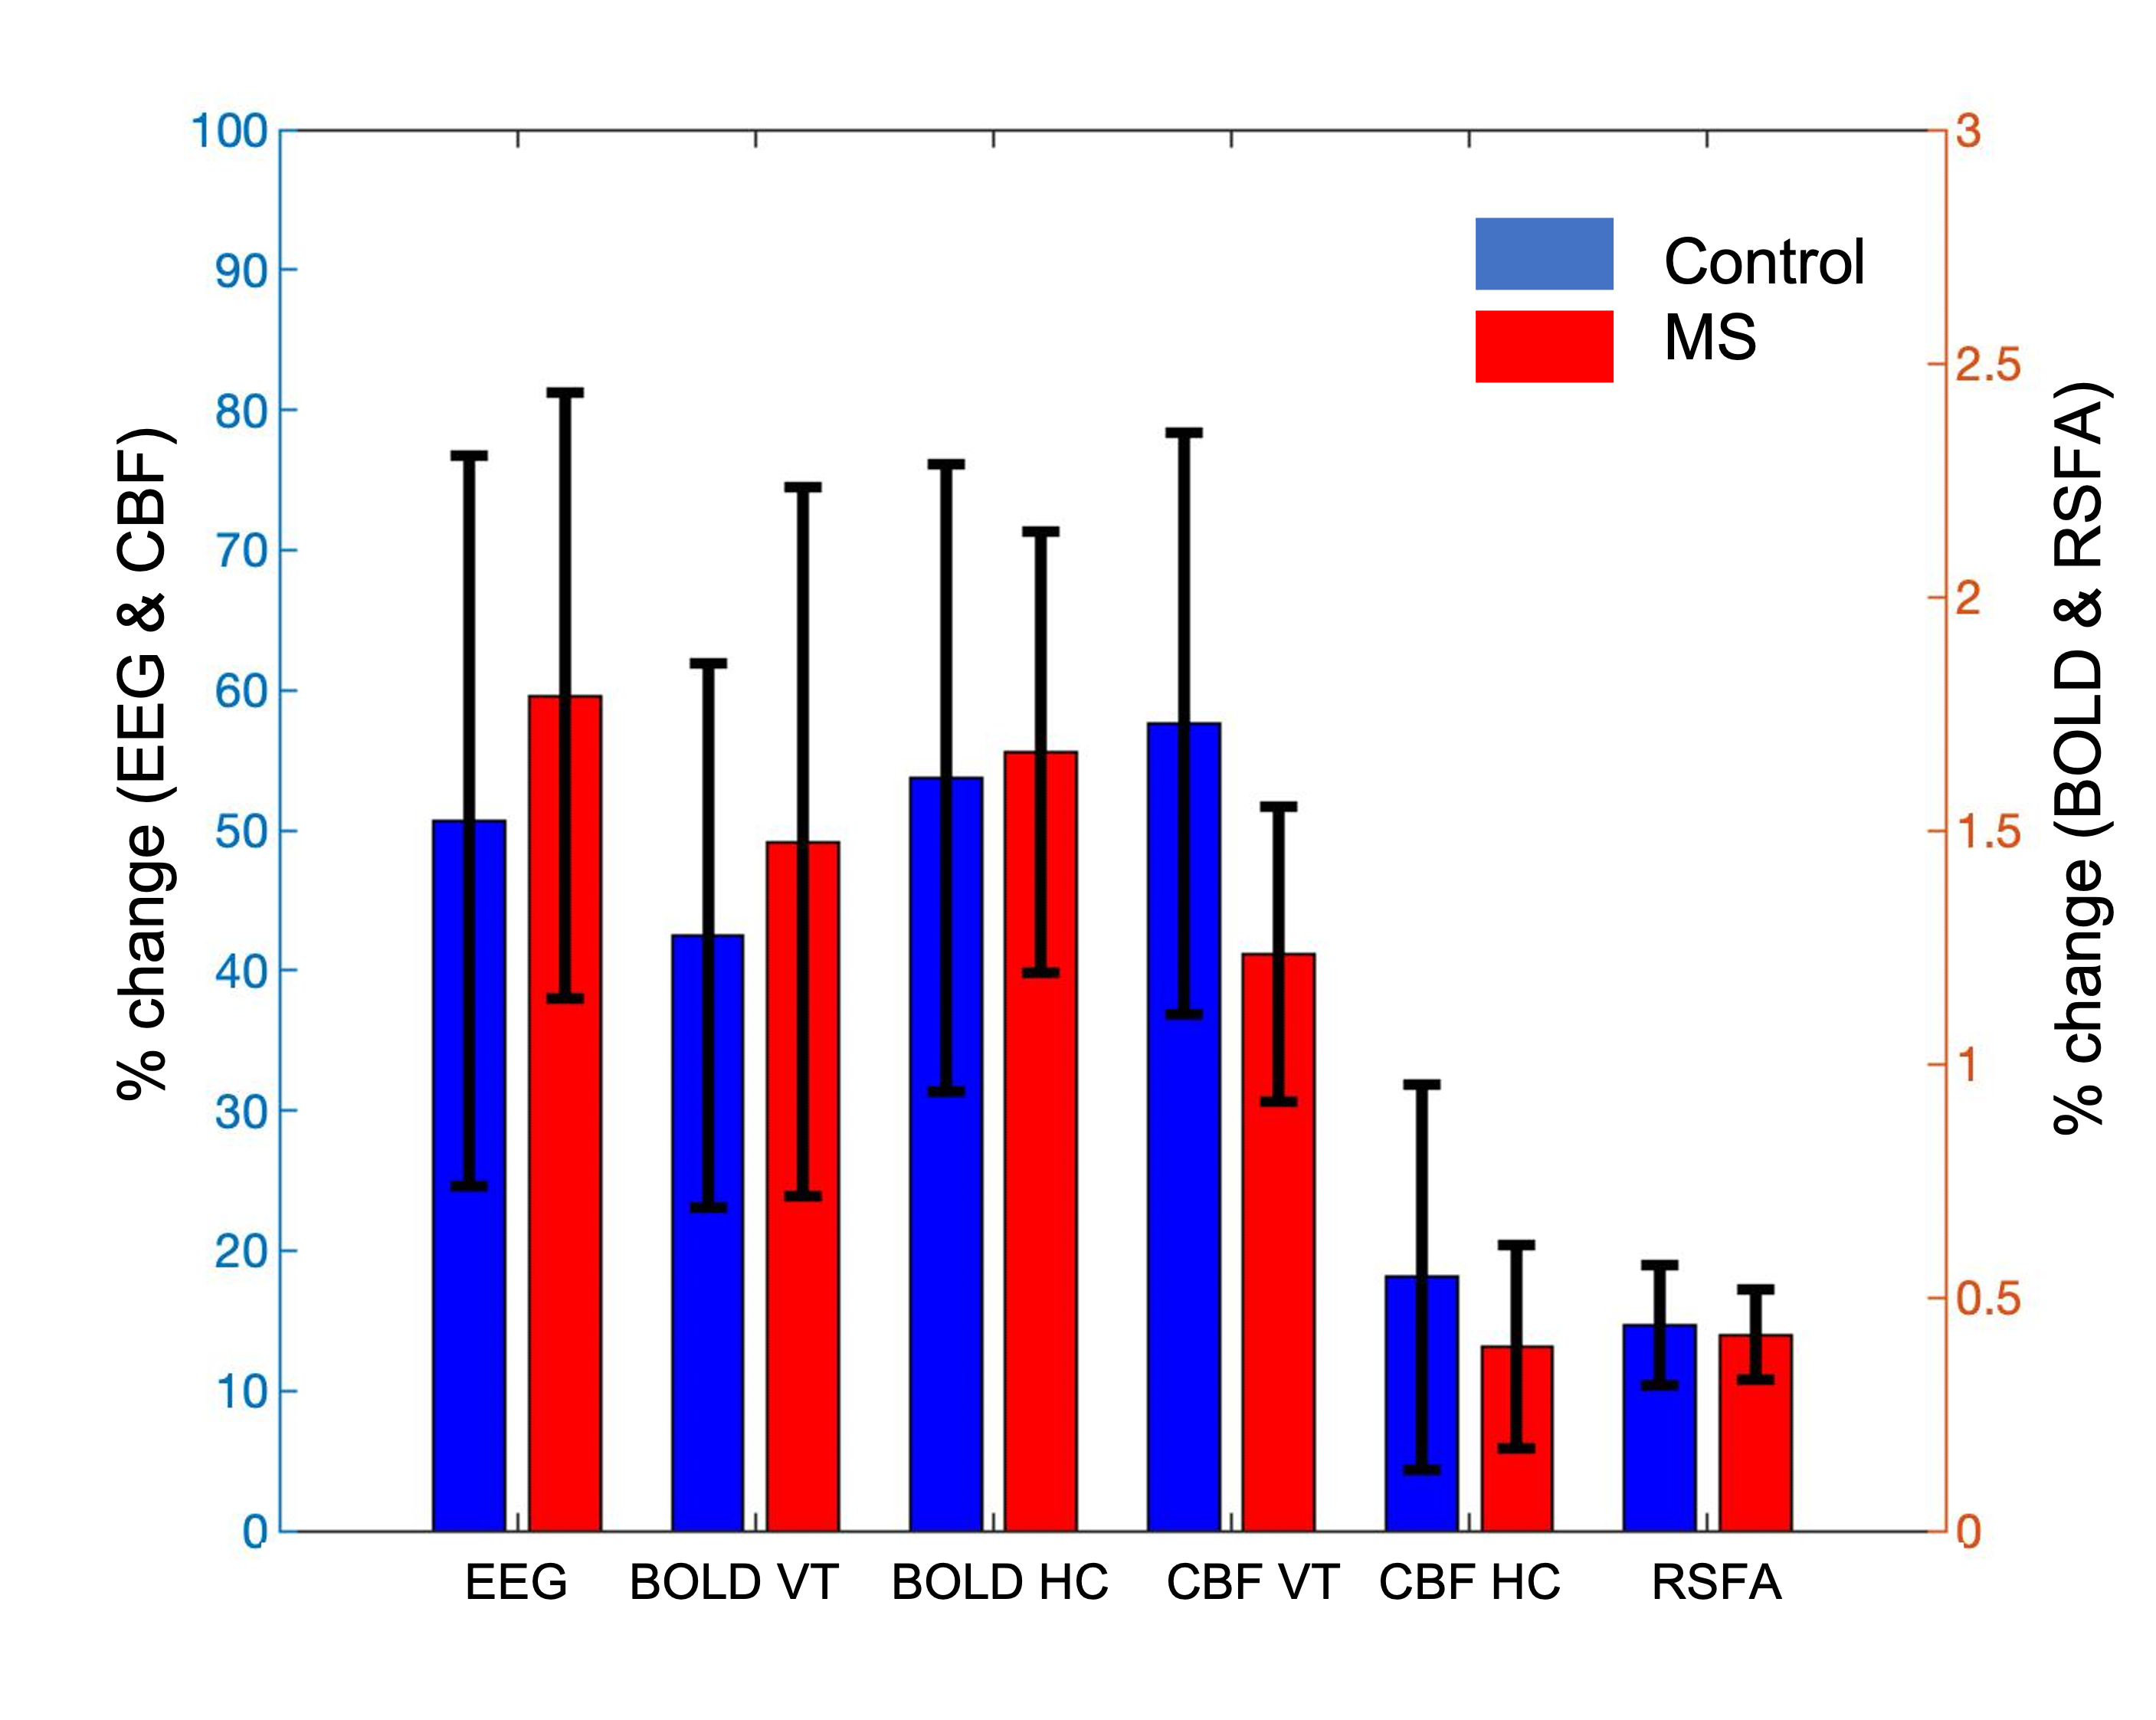
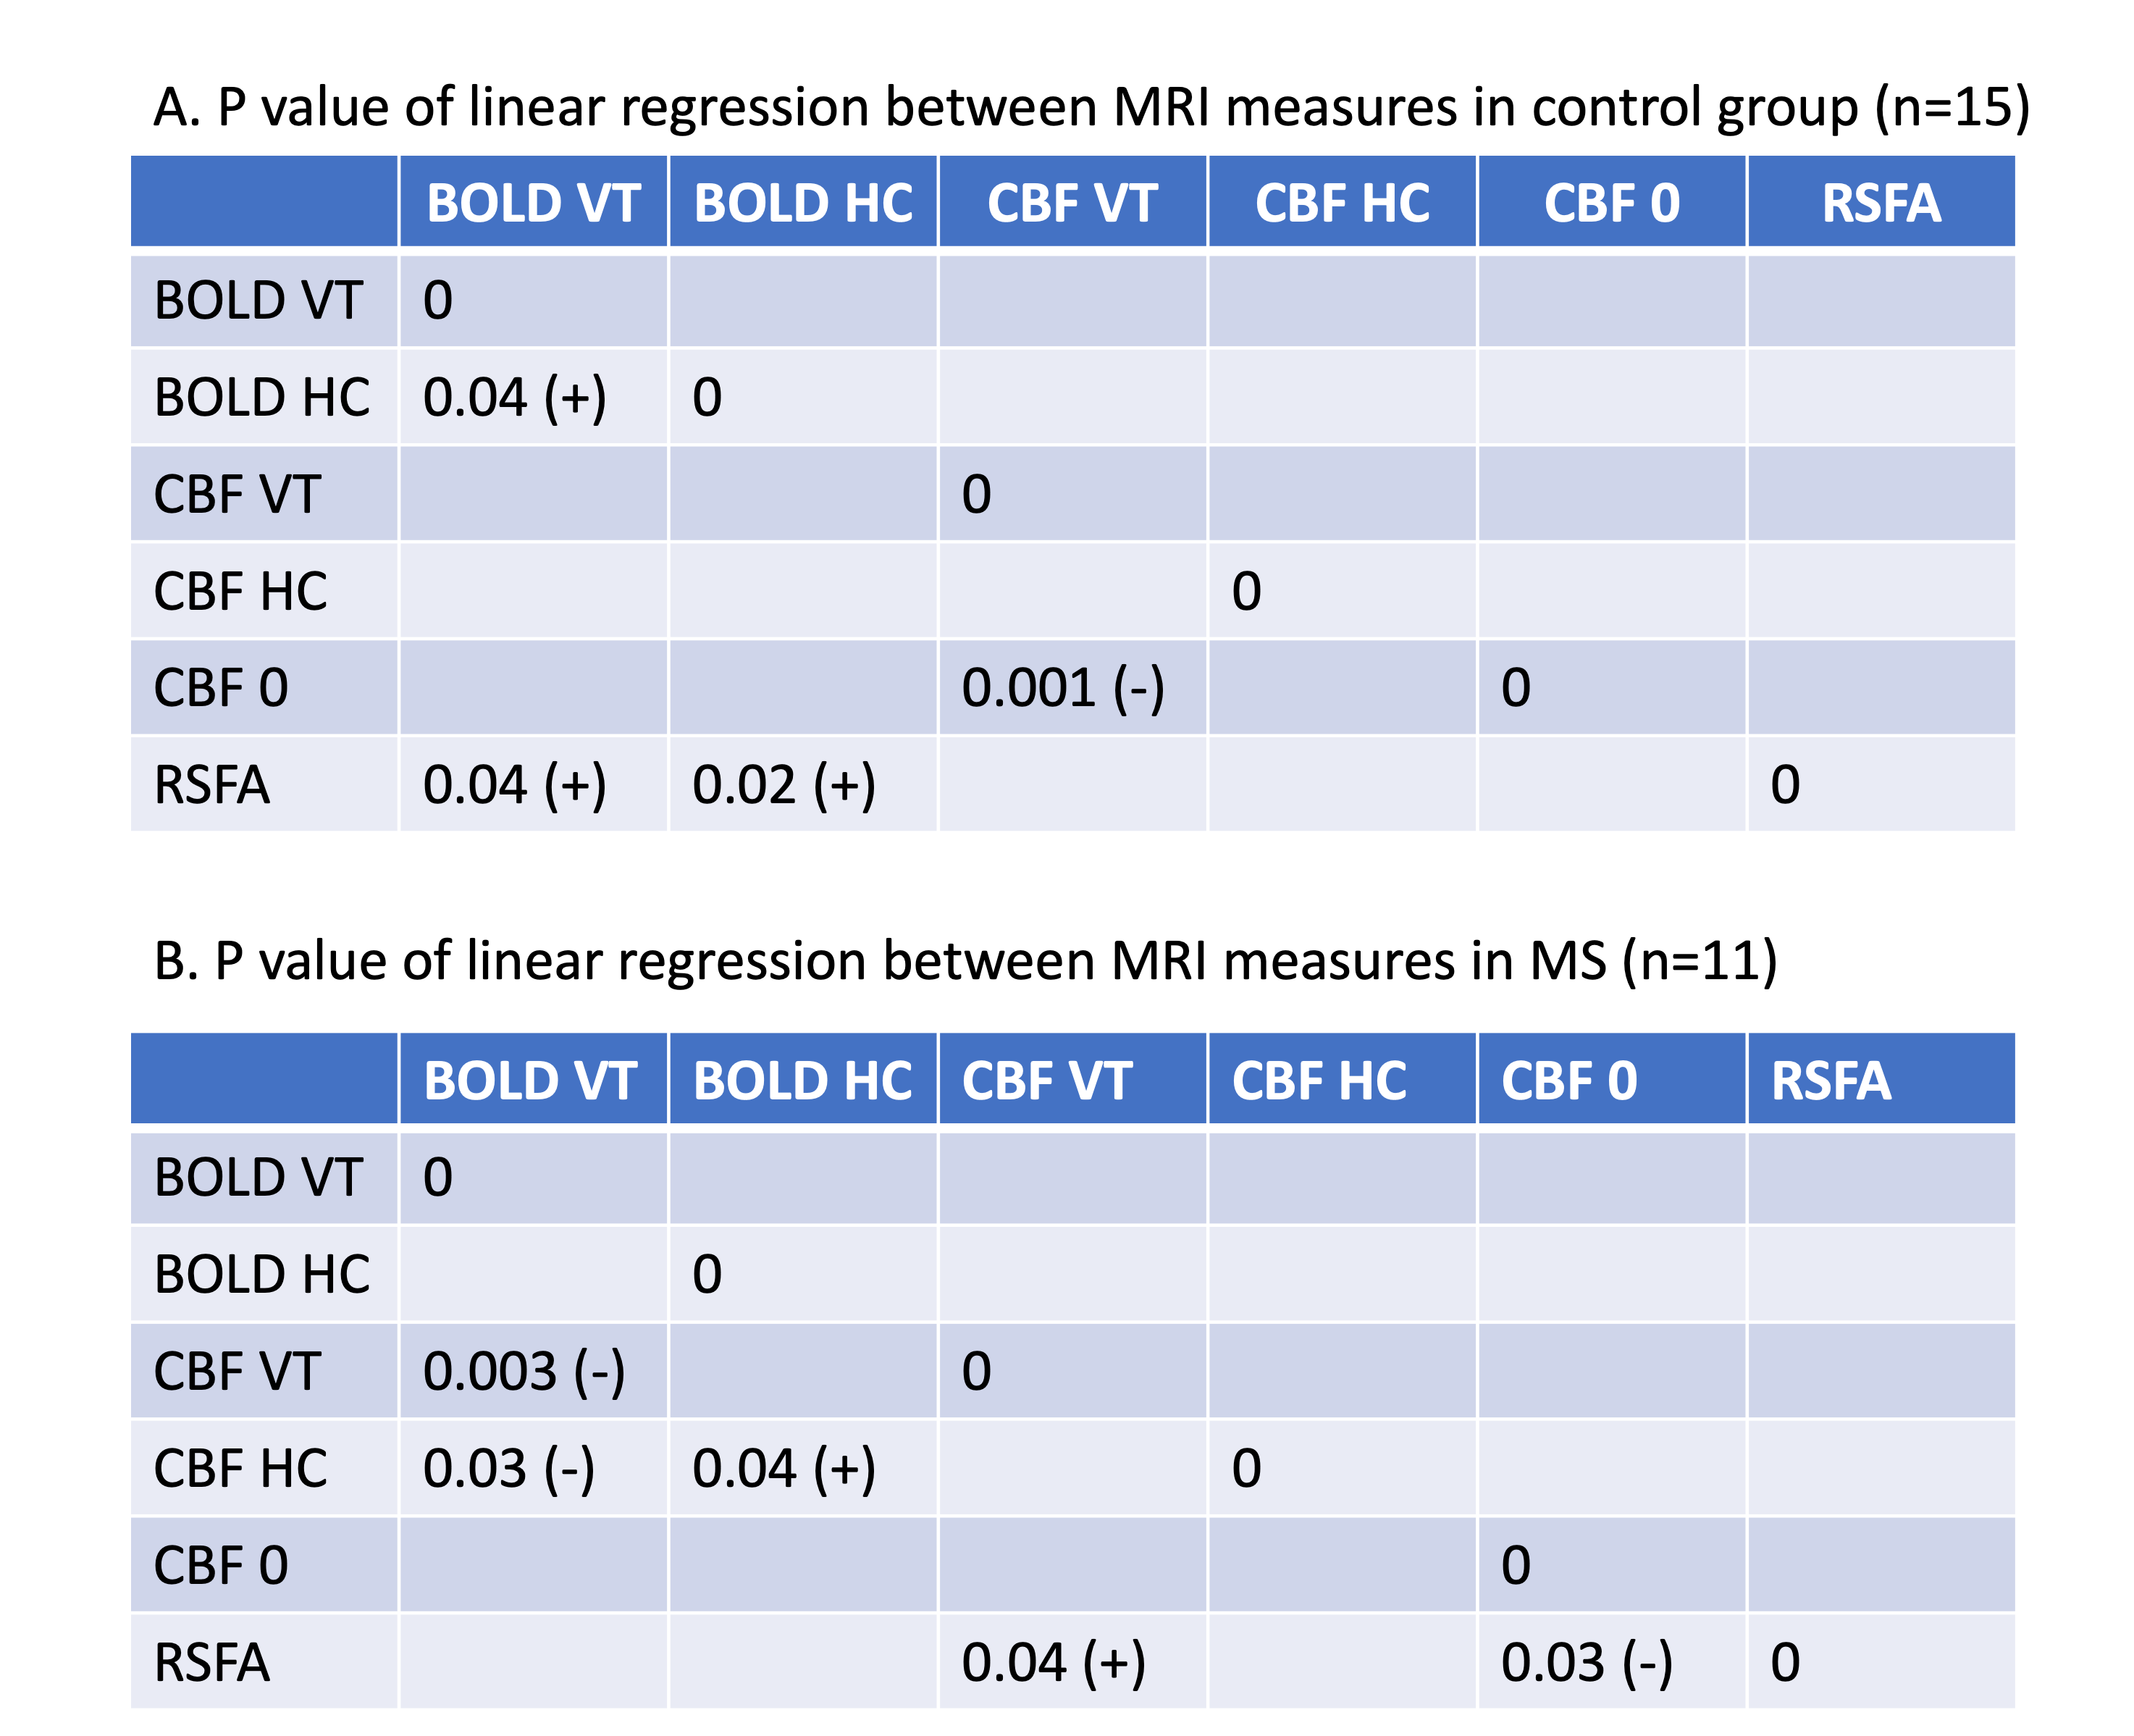
The highest power was detected in the O1 and O2 contacts, and averaged for the analysis (Figure 1). We found a higher increase in averaged EEG power and BOLD contrast change during VT and HC in the MS patients when compared to control group. The CBF change during VT and HC and RSFA are smaller in MS group when compared to the control group. However, these differences were not statistically significant. Age and/or sex did not predict the change of (1) EEG power during VT, (2) BOLD and CBF during VT and HC, and (3) RSFA in either controls or patients (p > 0.05).Table 1 shows a positive correlation between (1) BOLD during VT and BOLD during HC, (2) BOLD during VT and RSFA, (3) BOLD during HC and RSFA. For MS patients, we found a positive correlation between (1) BOLD and CBF during VT, (2) BOLD during VT and CBF during HC, (3) BOLD and CBF during HC, and (3) RSFA and CBF during VT.
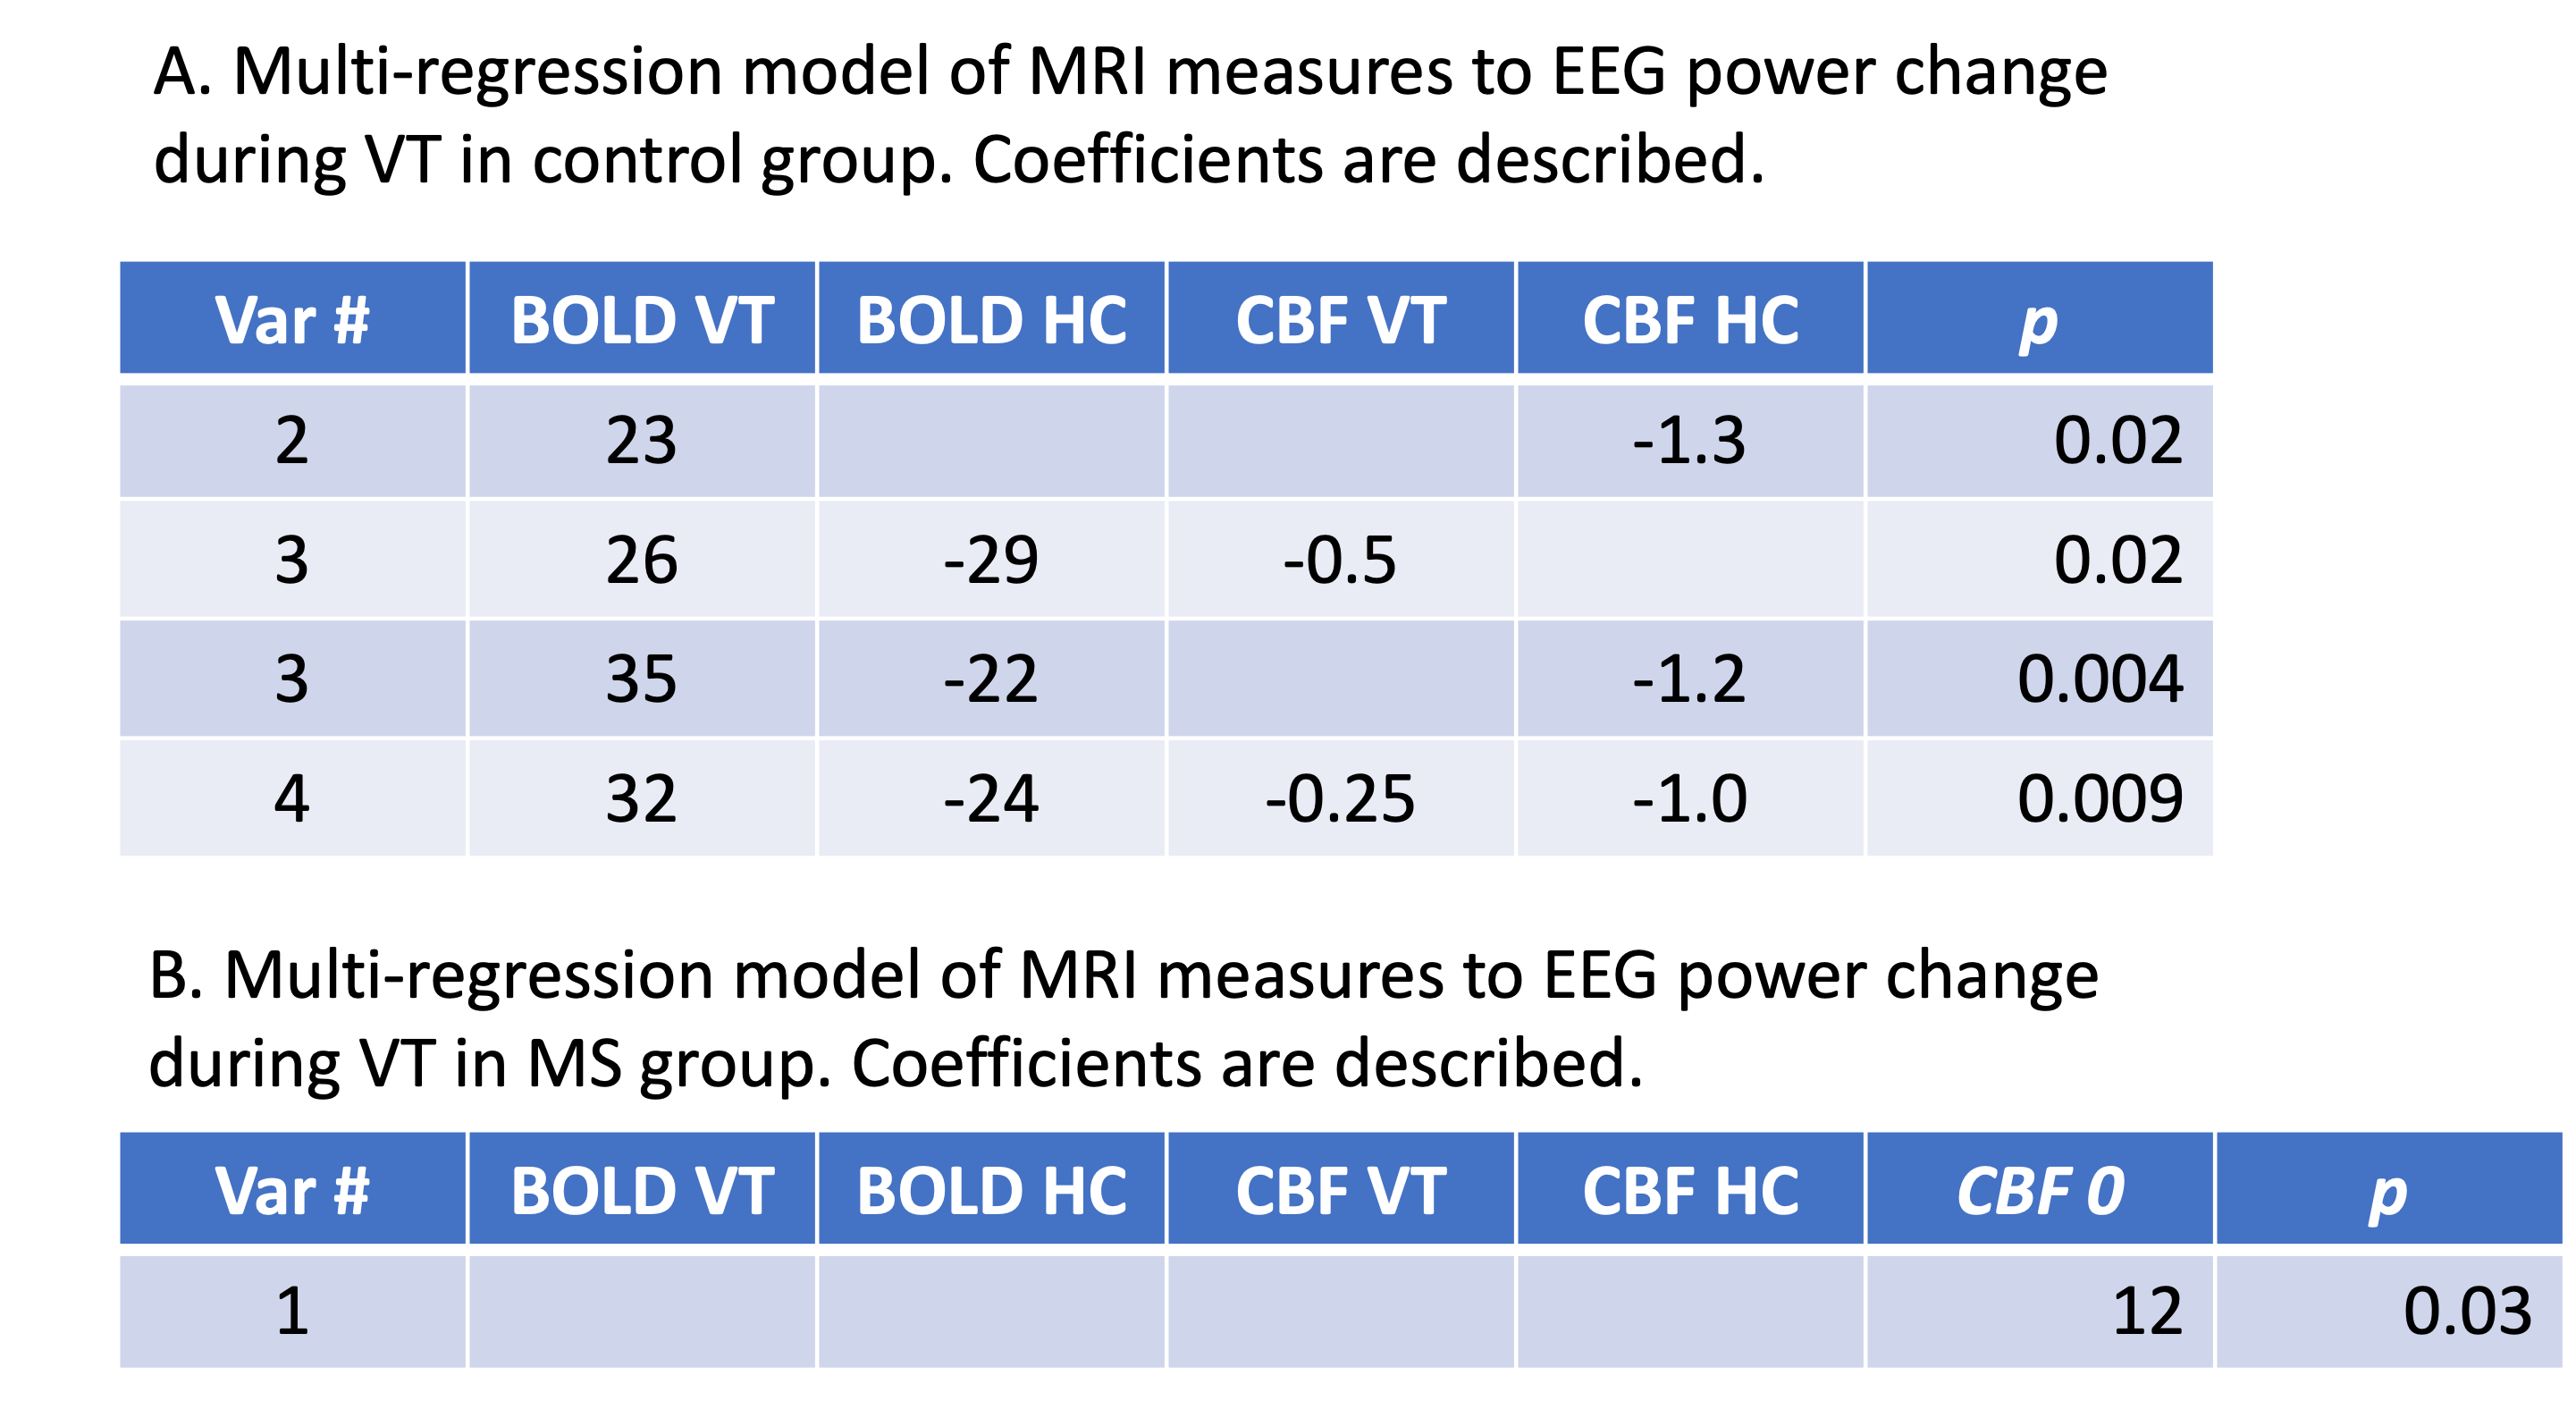
Table 2 shows that The regression model did not improve when RSFA was included (result now shown). For the control group, we found a significant association (p=0.004) between the EEG power change during VT and the change of (1) BOLD during VT (2) BOLD during HC, and (3) CBF during HC. We also found a significant association (p=0.009) between all 4 fMRI measures and EEG power change in control group. Table 2 describes the coefficients of four models to predict EEG power. In contrast, we found that EEG power change in the MS patients is predicted only by the baseline of CBF.
Discussion
A hypercapnia challenge has been employed to “calibrate” BOLD contrast in fMRI to normalize intra-subject variation 10 or to solve the complex function form of BOLD contrast with cerebral blood volume (CBV), CBF and oxygen consumption rate, known as Davis’ model 11. Cerebrovascular reactivity (CVR) is introduced with units of %BOLD signal change/mmHg of end-tidal CO2 12. In this study, we have tested the Davis model and find that none of the regression models that include CMRO2 were significantly predictive of EEG. This could be related to the regional variation of the model constraints between CBV and CBF, beta 13. In addition, the discomfort and complexity of the multi-modal EEG/MRI experimental setting to the subject might induce the larger bias on MRI measures than is typical in experiments utilizing MR experiments.We observed a positive slope and shift between BOLD response and BOLD during HC in control group, and the negative correlation between CBF during VT and the baseline CBF, which agrees with previous studies 14. The positive correlation between BOLD response and RSFA also agrees with previous work8. Our study finds that these relationships were absent in the MS group.
Conclusion
Our study finds that cerebrovascular reactivity during visual activity is disrupted in MS patients. Further investigation using a larger population study is necessary to understand the mechanisms of the potential vascular reactivity breakdown in MS patients.Acknowledgements
This work was supported by National Multiple Sclerosis Society grant RG4931A1/1. We appreciate the technical support from SiemensReferences
1. Lowe MJ, Beall EB, Sakaie KE, et al. Resting state sensorimotor functional connectivity in multiple sclerosis inversely correlates with transcallosal motor pathway transverse diffusivity. Hum Brain Mapp2008;29:818-827
2. Mainero C, Caramia F, Pozzilli C, et al. fMRI evidence of brain reorganization during attention and memory tasks in multiple sclerosis. Neuroimage 2004;21:858-867
3. Wishart HA, Saykin AJ, McDonald BC, et al. Brain activation patterns associated with working memory in relapsing-remitting MS. Neurology 2004;62:234-238
4. Brooks DJ, Leenders KL, Head G, et al. Studies on regional cerebral oxygen utilisation and cognitive function in multiple sclerosis. J Neurol Neurosurg Psychiatry 1984;47:1182-1191
5. Inglese M, Adhya S, Johnson G, et al. Perfusion magnetic resonance imaging correlates of neuropsychological impairment in multiple sclerosis. J Cereb Blood Flow Metab 2008;28:164-171
6. Inglese M, Park SJ, Johnson G, et al. Deep gray matter perfusion in multiple sclerosis: dynamic susceptibility contrast perfusion magnetic resonance imaging at 3 T. Archives of neurology 2007;64:196-202
7. Kim T, Shin W, Zhao T, et al. Whole brain perfusion measurements using arterial spin labeling with multiband acquisition. Magn Reson Med 2013;70:1653-1661
8. Kannurpatti SS, Rypma B, Biswal BB. Prediction of Task-Related BOLD fMRI with Amplitude Signatures of Resting-State fMRI. Front Syst Neurosci 2012;6:7
9. Allen PJ, Josephs O, Turner R. A method for removing imaging artifact from continuous EEG recorded during functional MRI. Neuroimage 2000;12:230-239
10. Bandettini PA, Wong EC. A hypercapnia-based normalization method for improved spatial localization of human brain activation with fMRI. NMR Biomed 1997;10:197-203
11. Davis TL, Kwong KK, Weisskoff RM, et al. Calibrated functional MRI: mapping the dynamics of oxidative metabolism. Proceedings of the National Academy of Sciences of the United States of America 1998;95:1834-1839
12. Yezhuvath US, Lewis-Amezcua K, Varghese R, et al. On the assessment of cerebrovascular reactivity using hypercapnia BOLD MRI. NMR Biomed 2009;22:779-786
13. Shu CY, Sanganahalli BG, Coman D, et al. Quantitative beta mapping for calibrated fMRI. Neuroimage2016;126:219-228
14. Liau J, Liu TT. Inter-subject variability in hypercapnic normalization of the BOLD fMRI response. Neuroimage 2009;45:420-430
Figures