3386
Signal variability of multiple sclerosis (MS) lesions on 3D IR-UTE MRI correlates with patient’s disability1University of California San Diego, San Diego, CA, United States
Synopsis
Keywords: Multiple Sclerosis, Neurodegeneration, UTE, MPRAGE, FLAIR, EDSS
We found a significant correlation between the signal variability of MS lesions on IR-UTE / MPRAGE sequences and the EDSS, while the IR-UTE sequence is superior. By using direct myelin imaging, the grade of disability in MS patients could be estimated more accurately. The signal variability of MS lesions on IR-UTE could be used as a novel imaging biomarker for patient’s disability.Introduction
Multiple sclerosis (MS) is a chronic autoimmune disease of the central nervous system (CNS) that is characterized by demyelination and axonal loss1. Magnetic resonance imaging (MRI) has gained significant importance in diagnosing MS and predicting disease progression2. The most popular grading system for the evaluation of the severity of disability in MS patients is the expanded disability status scale (EDSS)3,4. Unfortunately, correlations between MRI features of T2- or T1-lesions and the EDSS only showed poor to moderate results5. With the introduction of ultrashort echo time (UTE) MRI sequences, which have 100–1000 times shorter echo times than conventional sequences, myelin and its specific changes of demyelination and remyelination can potentially be visualized directly6-8. In this study, we assessed the signal variability of multiple sclerosis (MS) lesions on three-dimensional (3D) inversion recovery ultrashort echo time (IR-UTE), T2-weighted fluid-attenuated inversion recovery (T2-FLAIR), and T1-weighted magnetization prepared rapid acquisition gradient echo (T1-MPRAGE) MRI sequences, and correlated the signal variabilities to the grade of patient’s disability.Methods
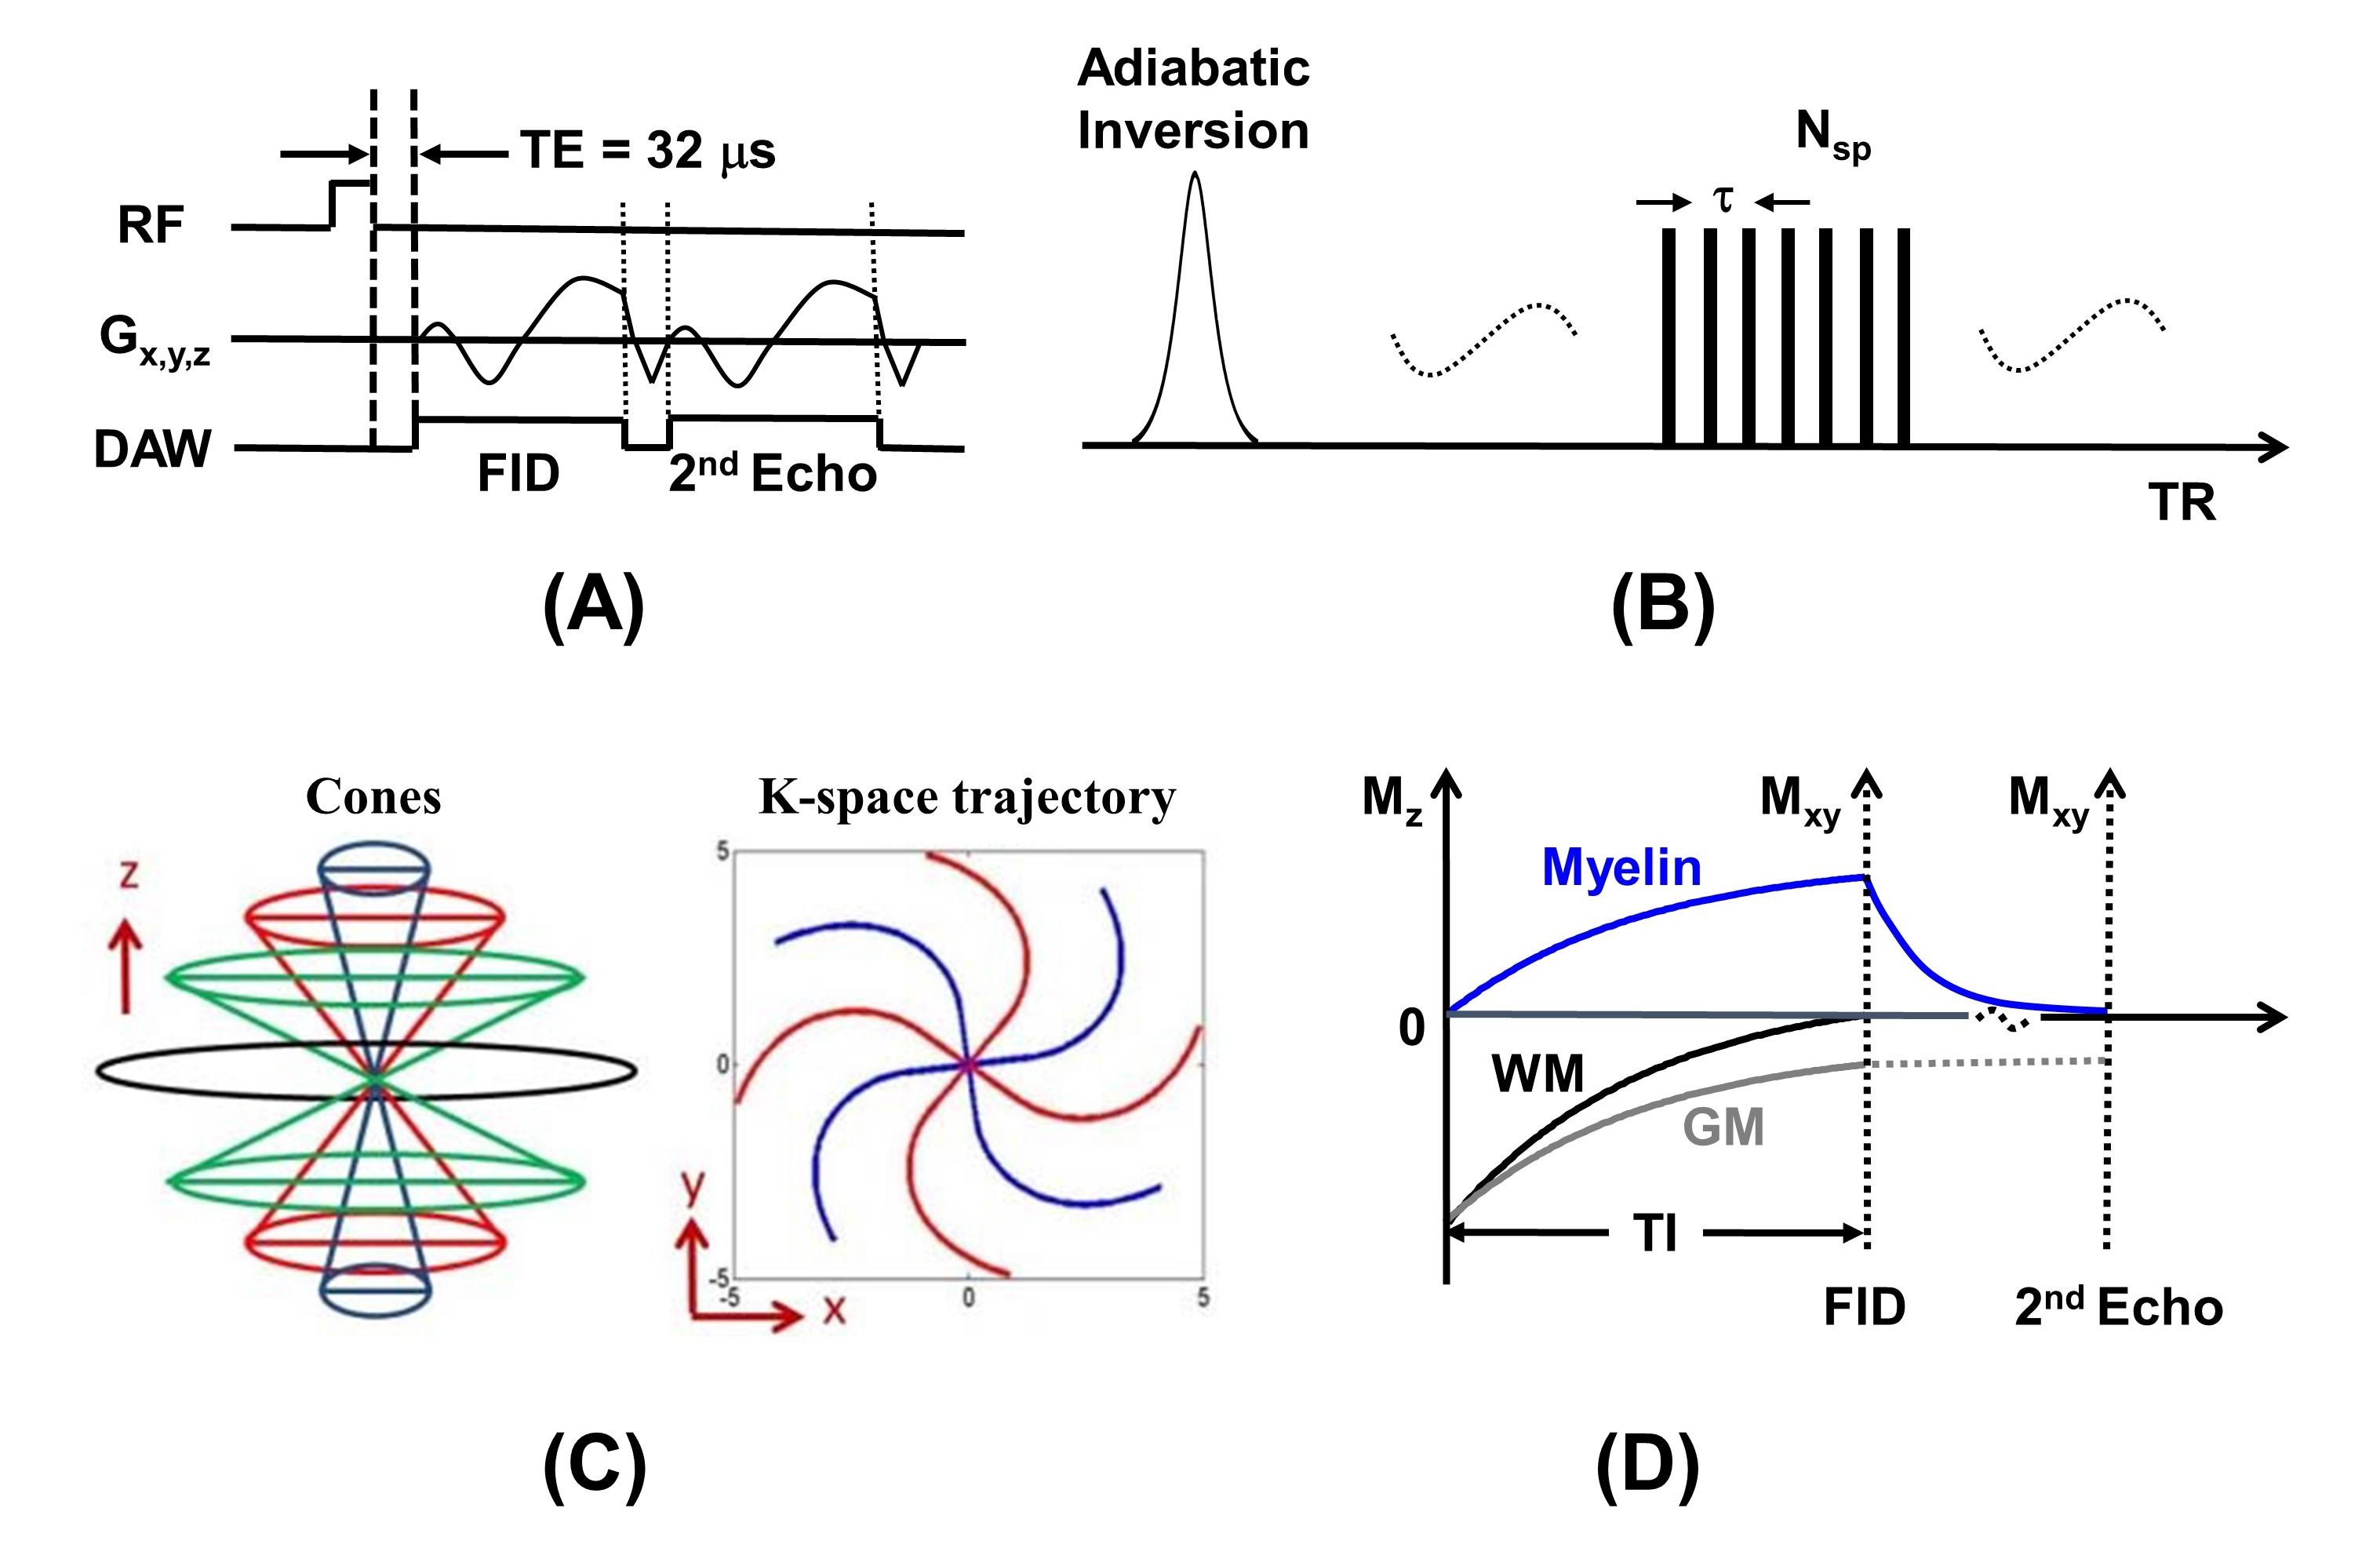
36 MS patients were recruited for this study after the institutional review board (IRB) approval. Written informed consent was obtained from each participant. 3D IR-UTE (Figure 1), T2-FLAIR, and T1-MPRAGE sequences were employed on a 3T scanner. Standardized regions of interest (ROIs) were drawn both within the MS lesions and the cerebrospinal fluid (CSF) on each sequence. The signal intensity ratio (SIR) between each lesion and the CSF was calculated. Standard deviations (SD) and absolute differences (AD) of the SIRs were calculated and used for variability analysis. Cortical, infratentorial, and spinal lesions were excluded.Results
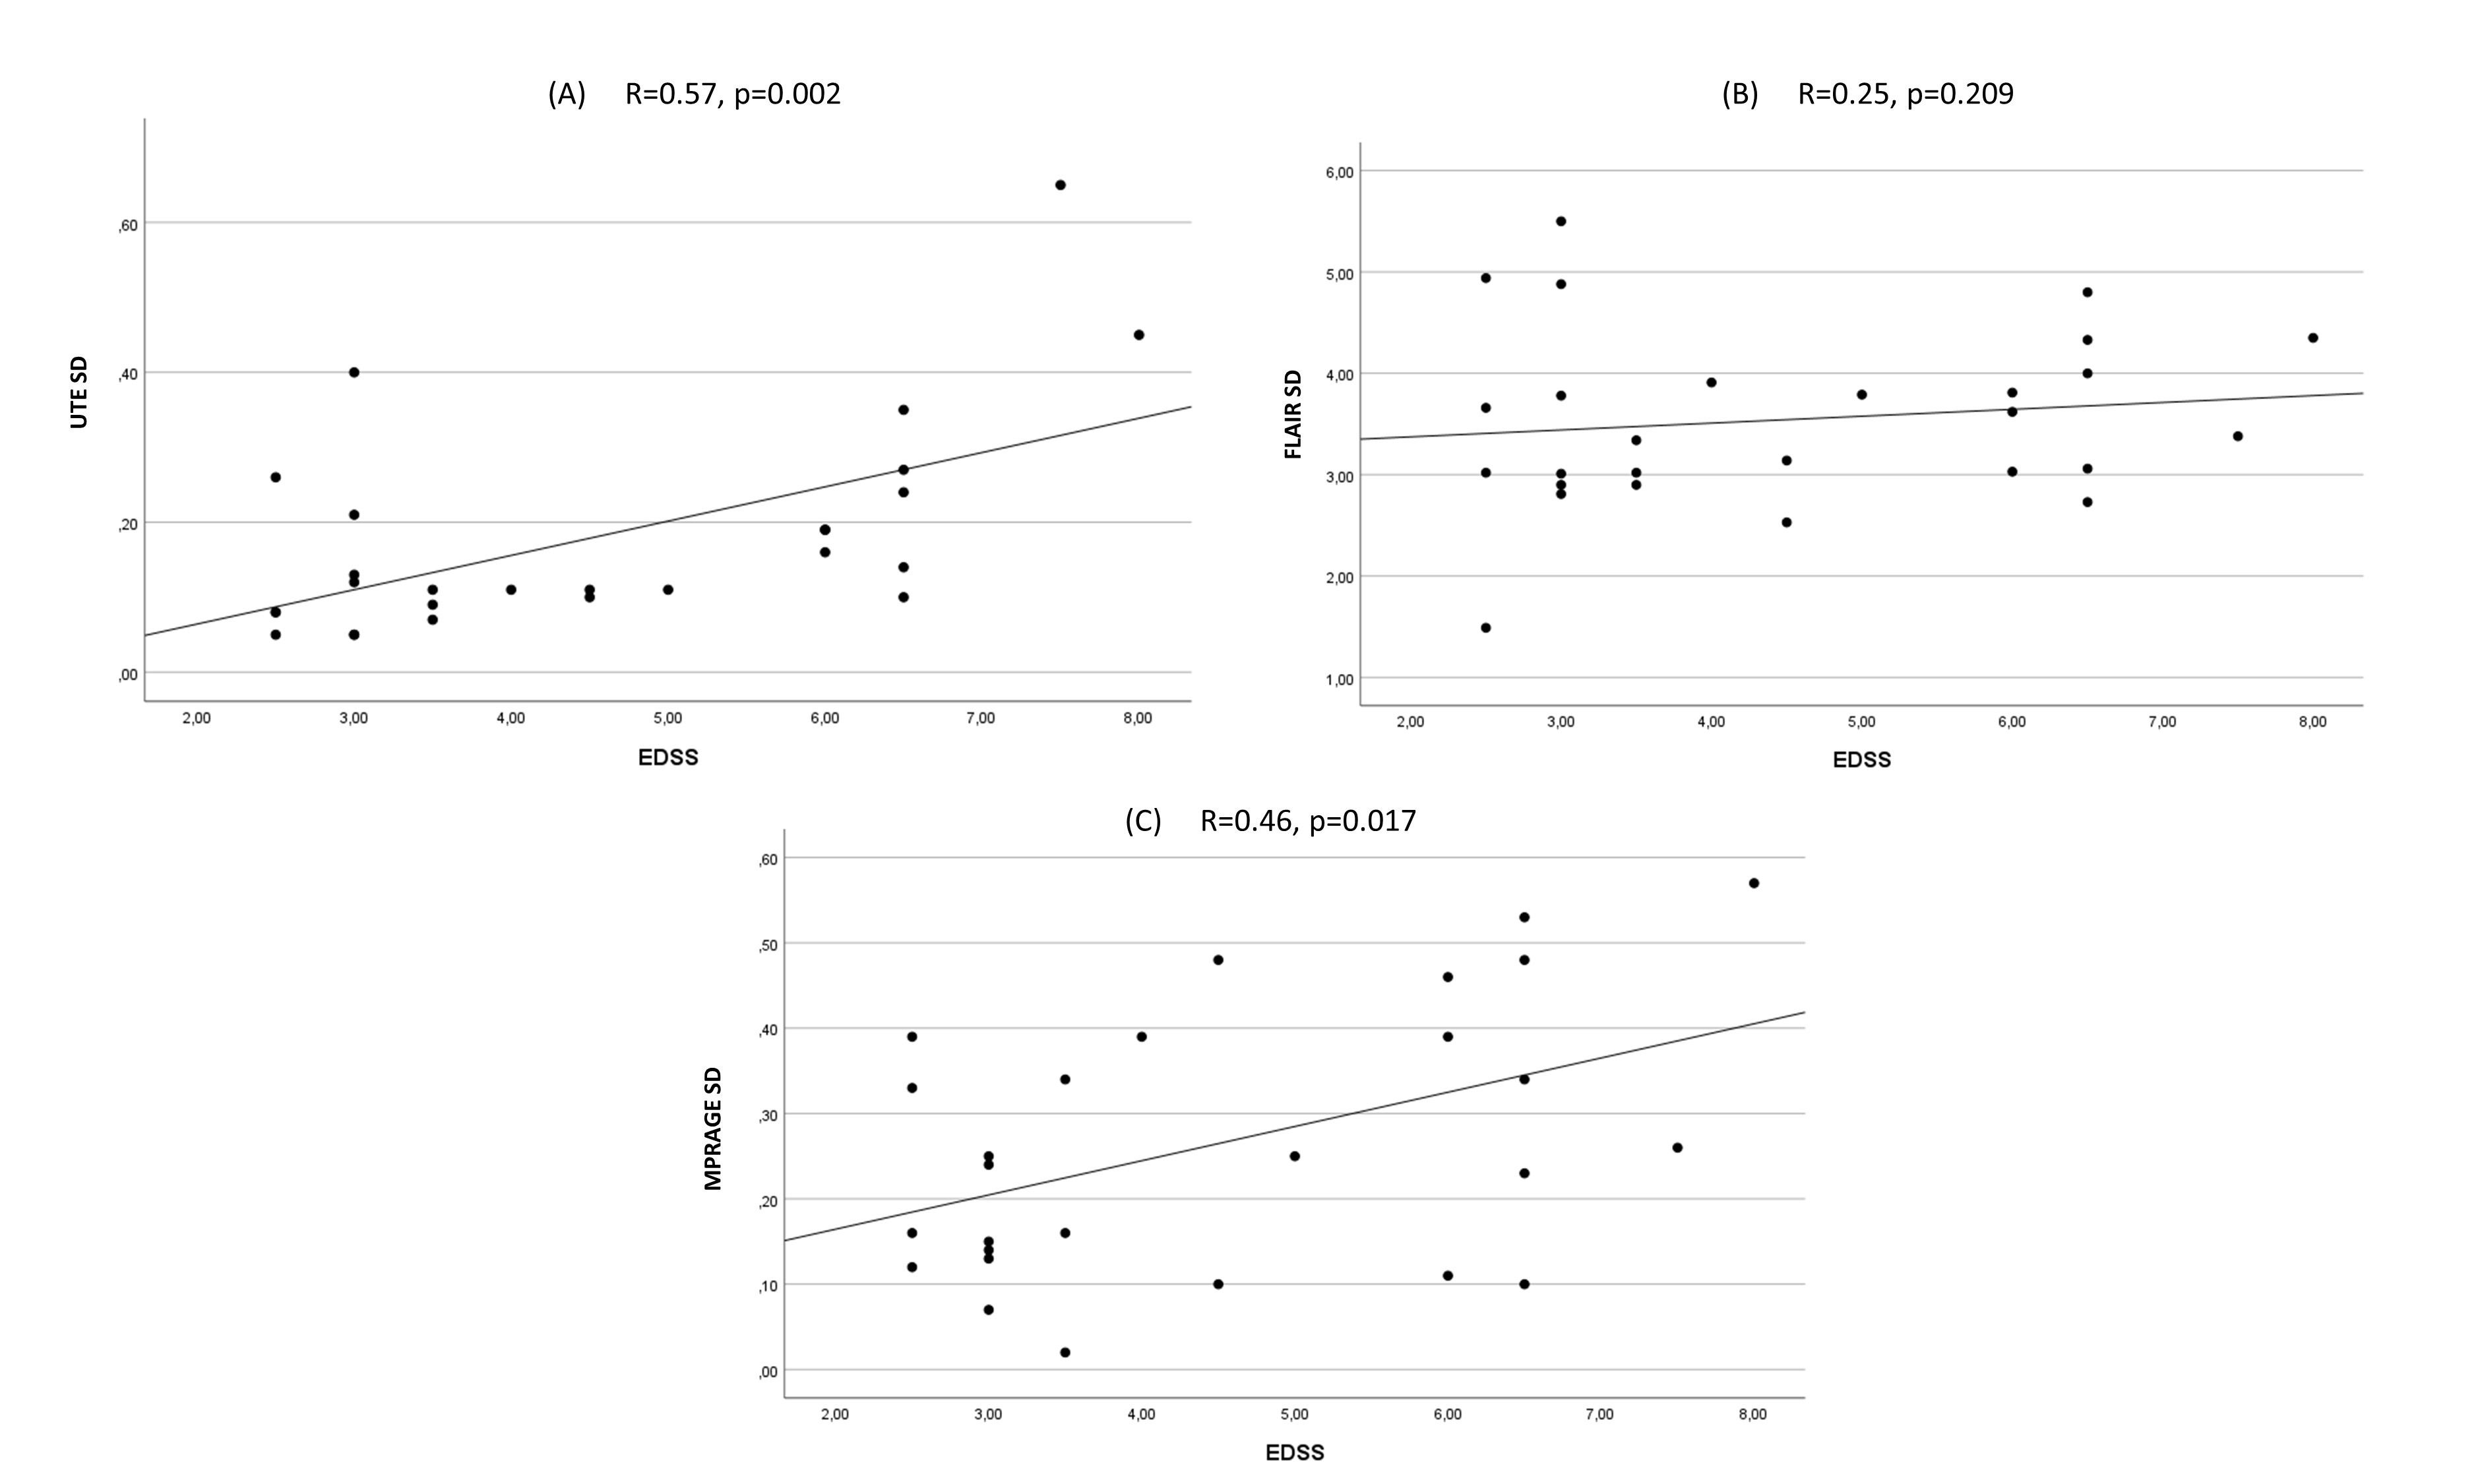
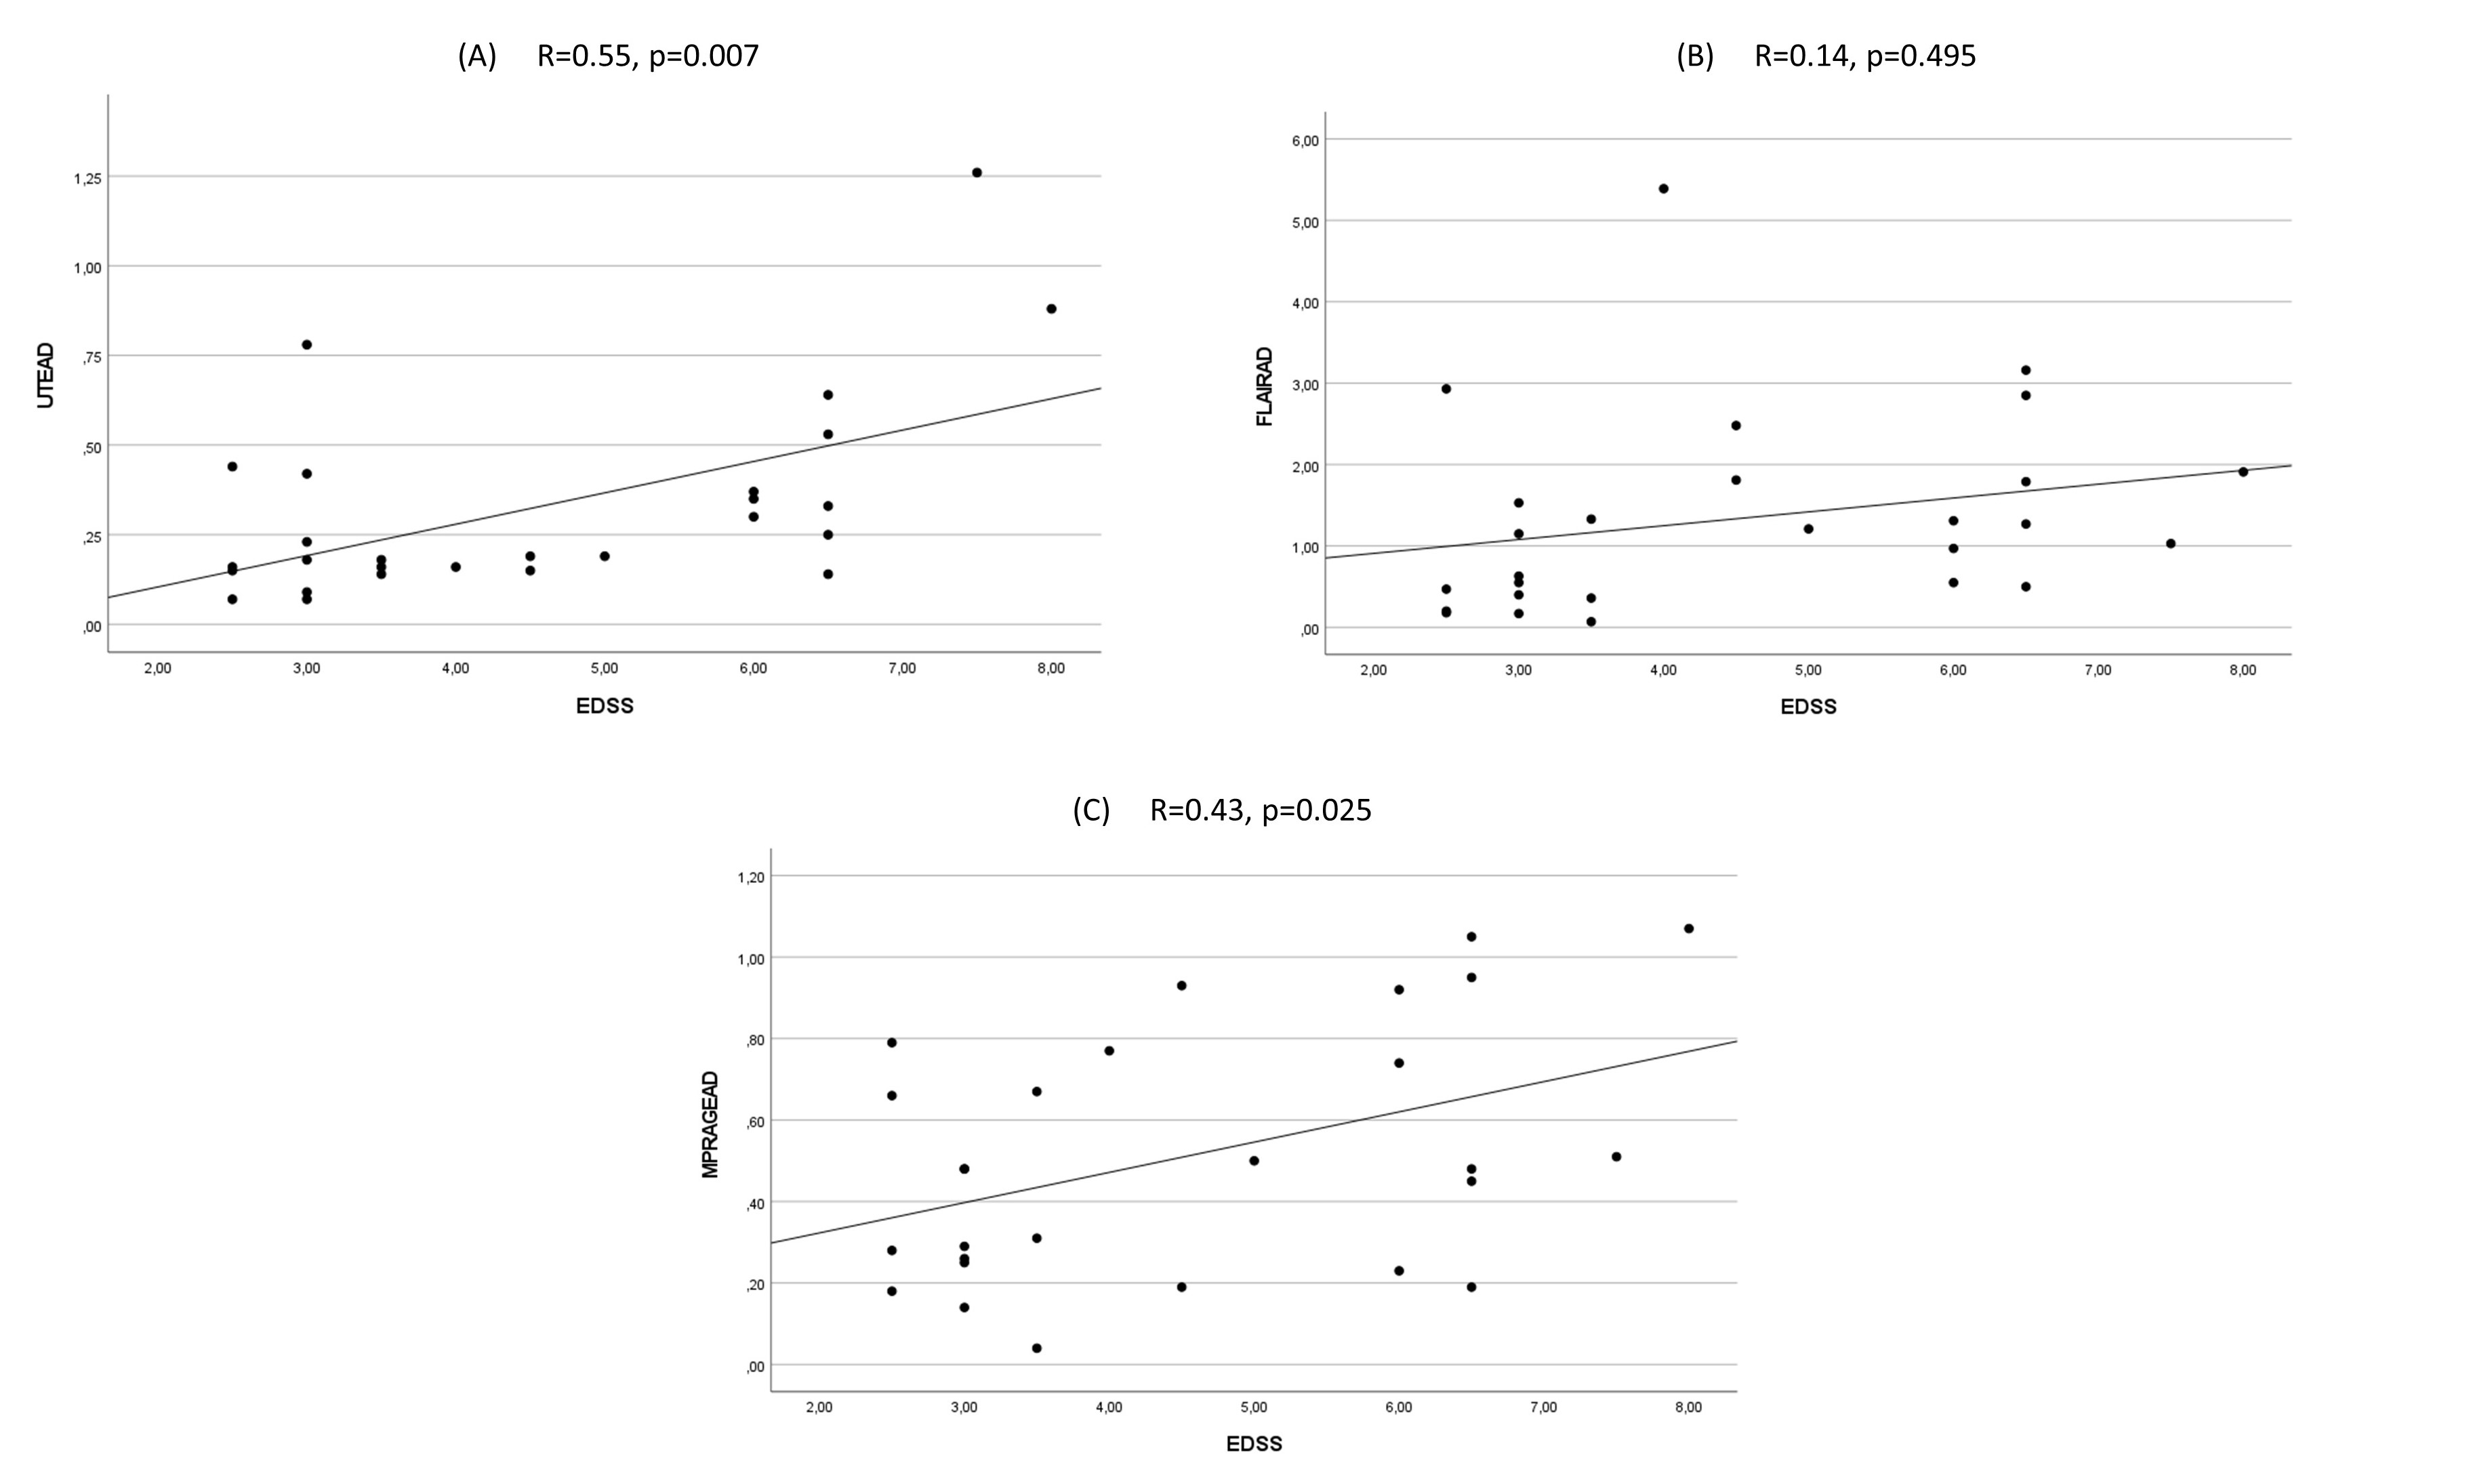
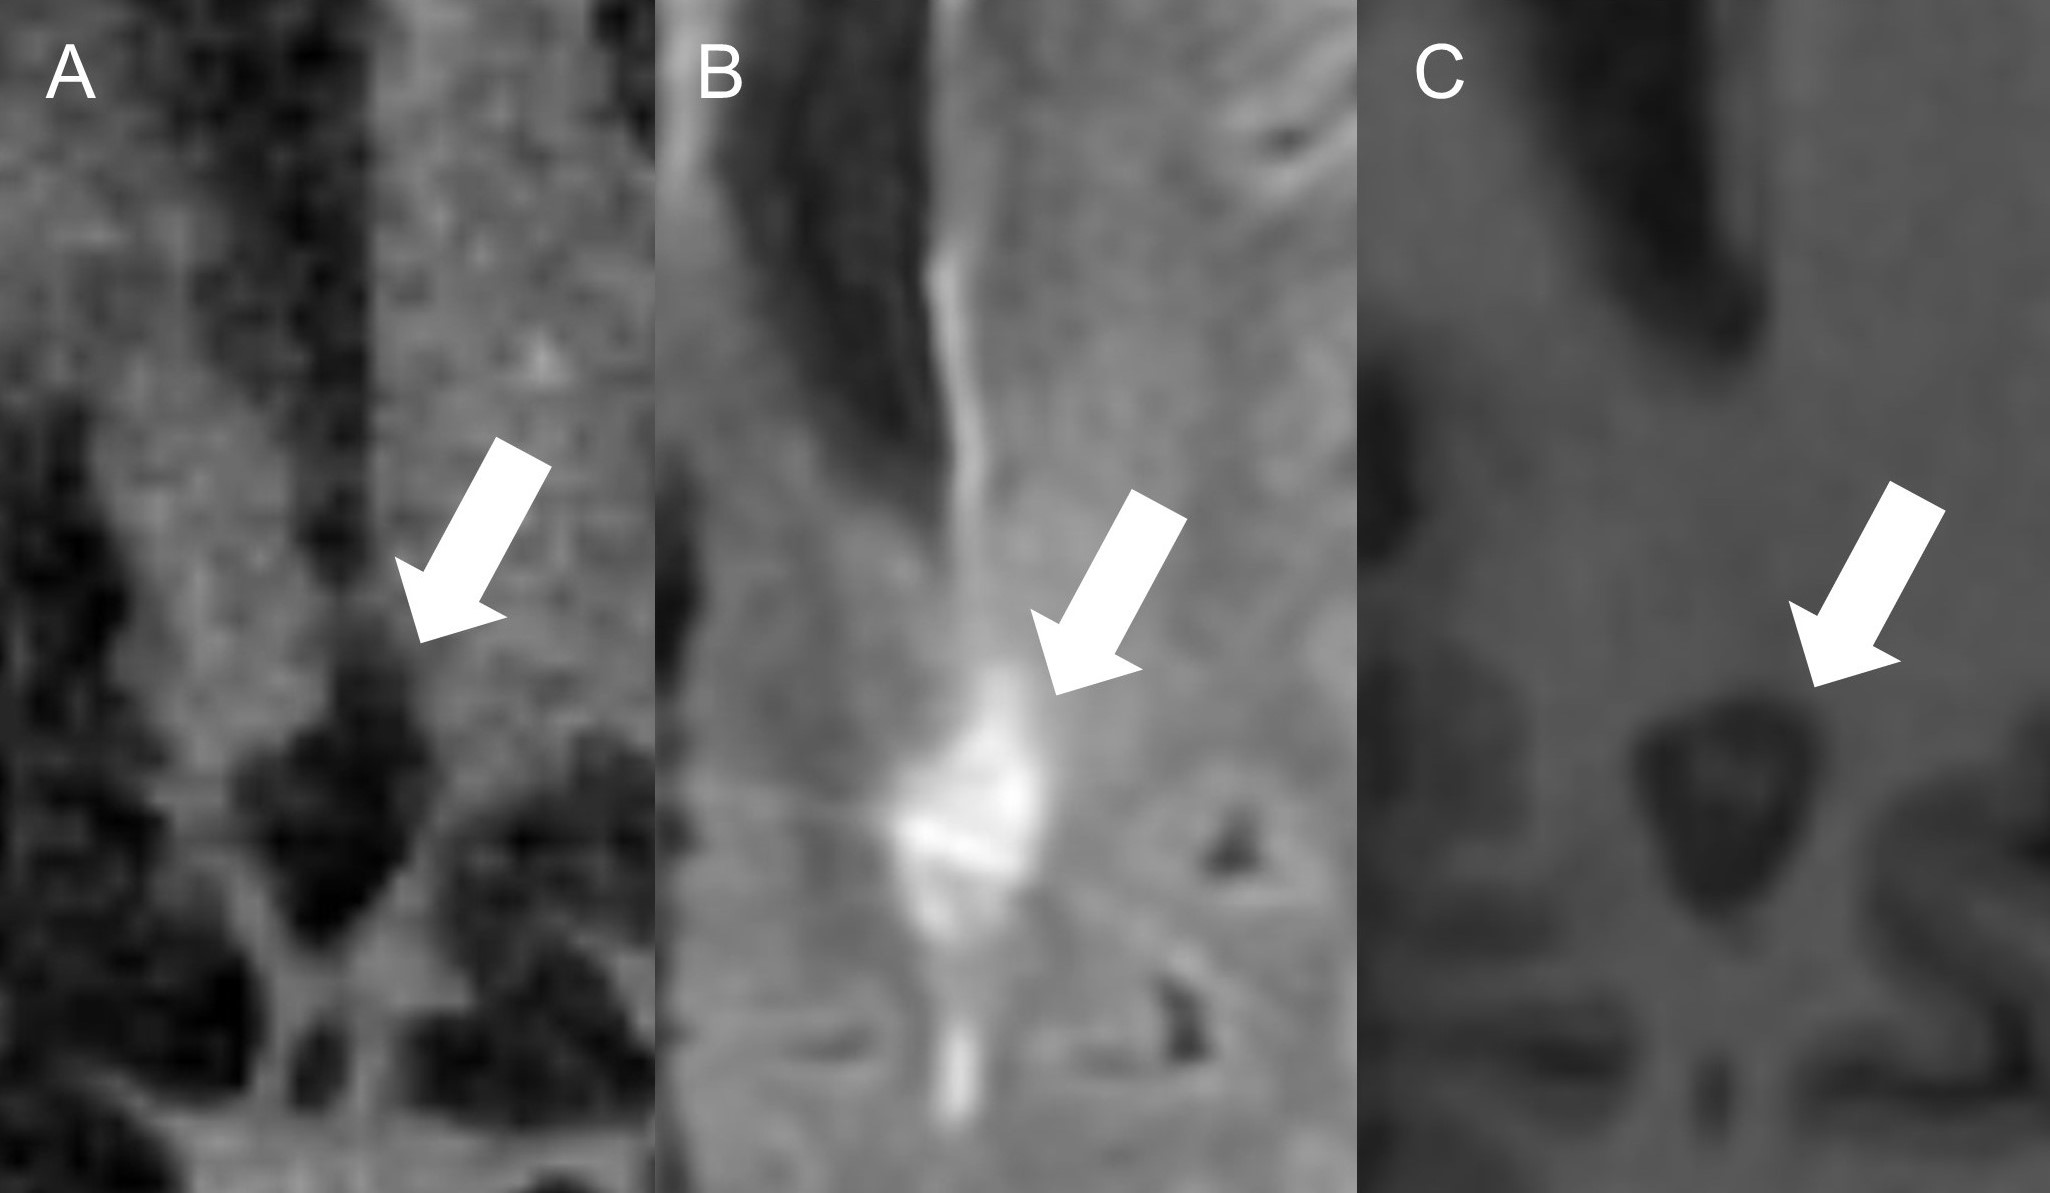
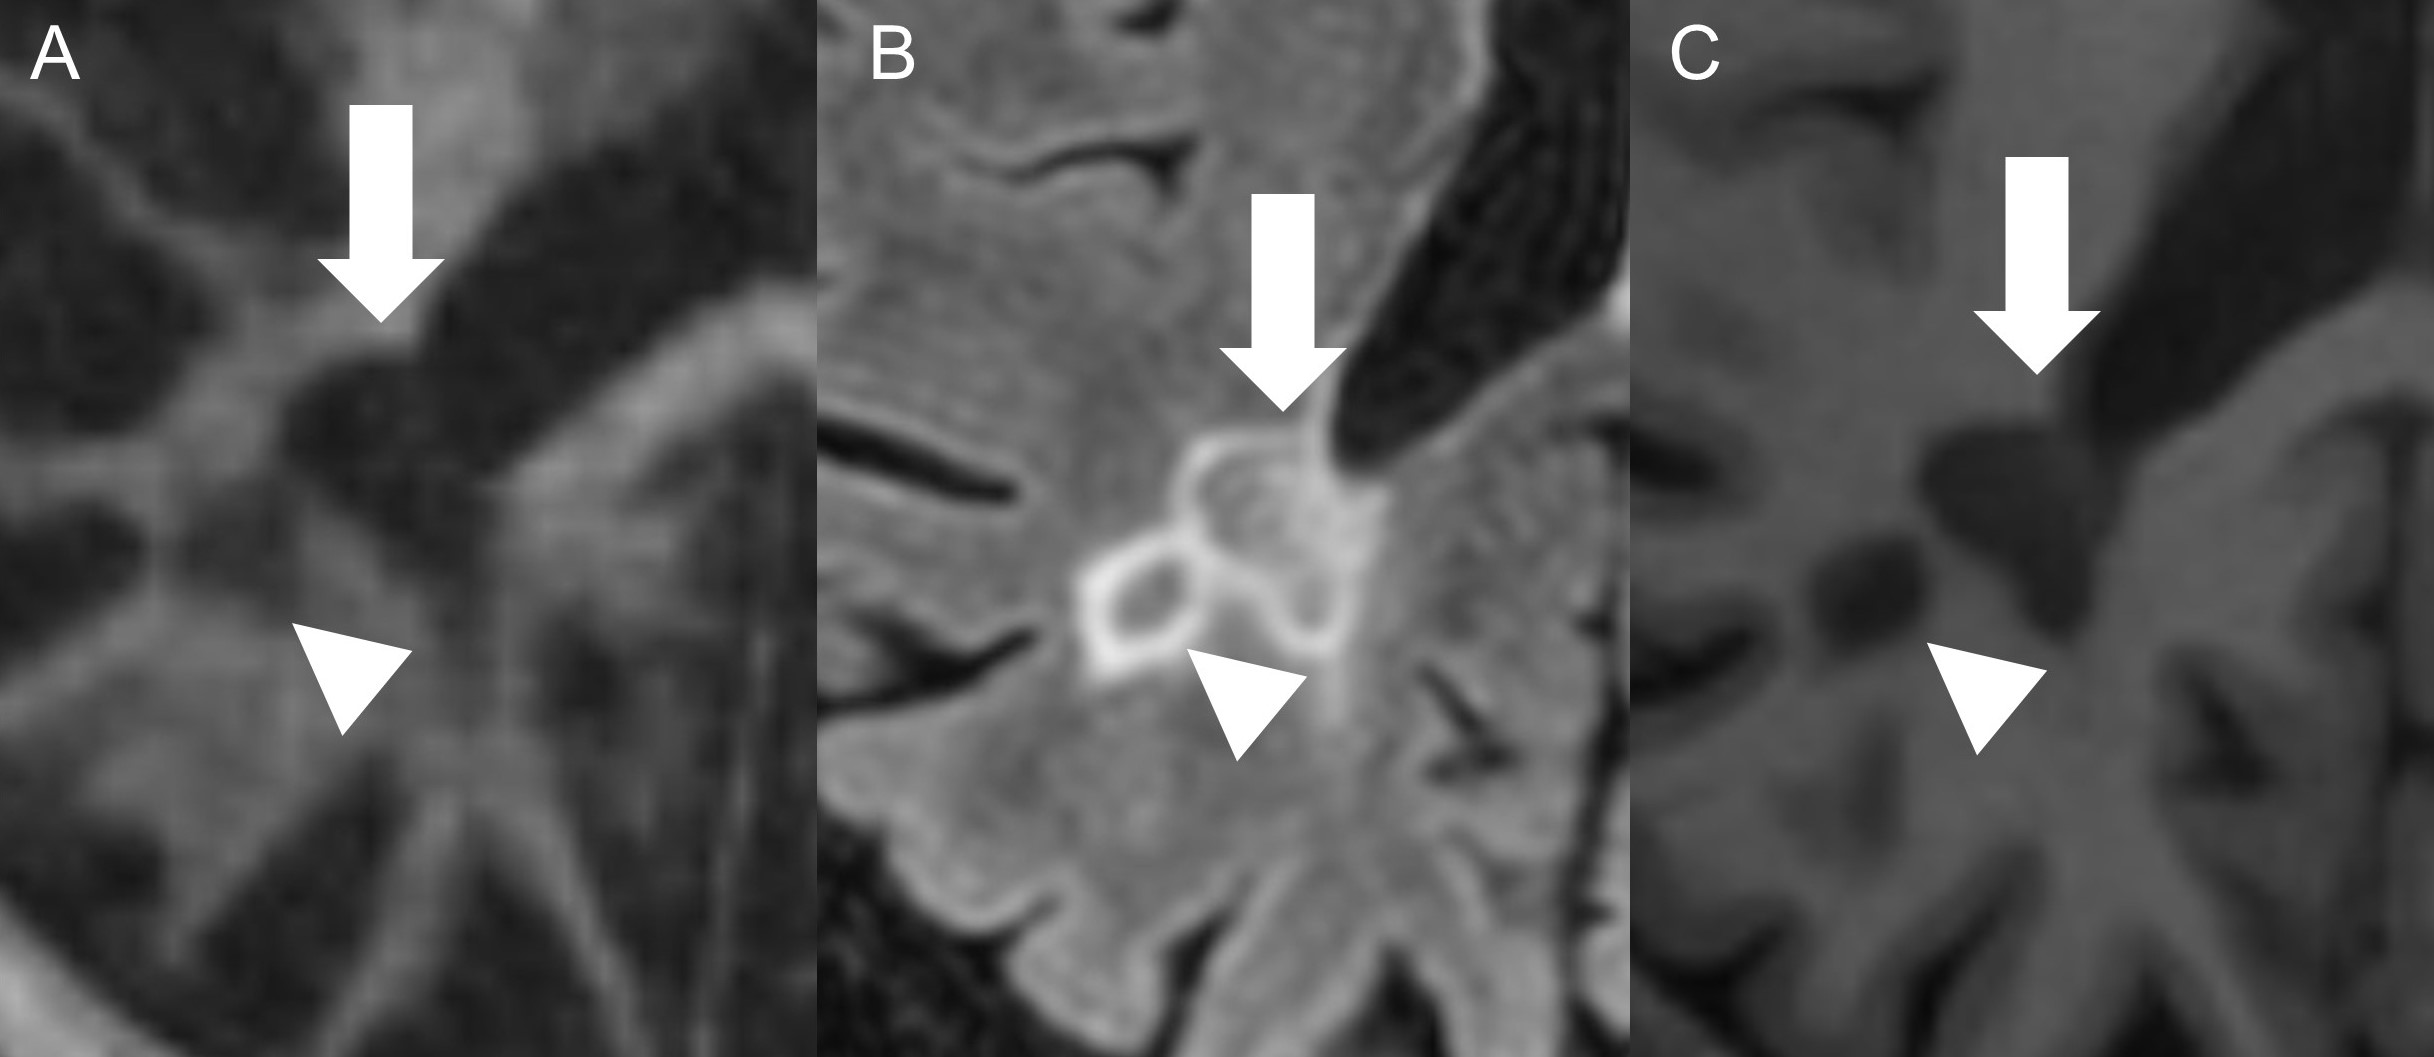
27 patients remained for the subsequent analysis. The mean size of the lesions was 7.8 mm (Min.: 5 mm, Max.: 15 mm, SD: 1.97). 85% of the lesions were periventricular. The mean EDSS score was 4.5 (Min.: 2.5, Max.: 8, SD: 1.73). We found moderate correlations between the EDSS and the SD/AD on IR-UTE and MPRAGE (Figure 2 and 3). Accordingly, the Pearson’s correlations for SD/AD on IR-UTE and MPRAGE were R=0.57 (p=0.002) / R=0.55 (p=0.003) and R=0.46 (p=0.017) / R=0.43 (p=0.025), respectively. For FLAIR, the Pearson’s correlations for SD and AD were much lower: R=0.14 (p=0.495) and R=0.25 (p=0.209), respectively (Figure 2 and 3). There was a significant difference between patients with an EDSS of <5 and those with ≥5 regarding SD and AD on IR-UTE (p=0.004 and p=0.007, respectively). For MPRAGE and FLAIR, such a significant difference was not found. Figure 4 and 5 present examples of MS lesions on 3D IR-UTE, 3D FLAIR, and 3D MPRAGE sequences, respectively.Discussion
We found moderate correlations between SD and AD values on IR-UTE and MPRAGE images with the EDSS, while SD and AD values on FLAIR images showed no significant correlations. Nevertheless, the signal variability on IR-UTE images proved more reliable in differentiating patients with a lower from those with a higher EDSS. For decades, scientists tried to establish a robust correlation between MRI findings and the EDSS of MS patients presenting at admission. Most previous studies found no reliable correlation between these two features9-11. Also, the distinctive evaluation of T2 and T1 lesions couldn’t bring reliable correlations to the severity of disability12-14. Our findings suggest that the higher the EDSS of the patients, the more variability is seen in the SI of MS lesions on IR-UTE and MPRAGE sequences. As SD and AD on the IR-UTE sequence significantly differ between an EDSS<5 and ≥5, these two parameters on the 3D IR-UTE are preferred biomarkers to estimate the EDSS in MS patients. Our study suggests that the signal intensity variability of MS lesions, normalized by a CSF ratio, could predict the severity of the disability assessed by the EDSS.Conclusion
Our findings suggest that the signal variability on IR-UTE images is directly correlated to patient’s disability, and can robustly separate patients with lower disability (EDSS<5) and those with higher disability (EDSS≥5). The IR-UTE sequence proved more effective than the clinical MPRAGE and FLAIR sequences in evaluating patient’s disability, thereby emphasizing the value of direct myelin imaging.Acknowledgements
The authors acknowledge grant support from the Deutsche Forschungsgemeinschaft, the National Institutes of Health and the VA Clinical Science Research & Development Service.References
1. Oh J, Vidal-Jordana A, Montalban X. Multiple sclerosis: clinical aspects. Current opinion in neurology 2018;31(6):752–759.
2. Kaunzner UW, Gauthier SA. MRI in the assessment and monitoring of multiple sclerosis: an update on best practice. Therapeutic advances in neurological disorders 2017;10(6):247–261.
3. Meyer-Moock S, Feng Y-S, Maeurer M, Dippel F-W, Kohlmann T. Systematic literature review and validity evaluation of the Expanded Disability Status Scale (EDSS) and the Multiple Sclerosis Functional Composite (MSFC) in patients with multiple sclerosis. BMC neurology 2014;14(1):1–10.
4. Kurtzke JF. Rating neurologic impairment in multiple sclerosis: an expanded disability status scale (EDSS). Neurology 1983;33(11):1444.
5. Brex PA, Ciccarelli O, O'Riordan JI, Sailer M, Thompson AJ, Miller DH. A longitudinal study of abnormalities on MRI and disability from multiple sclerosis. New England Journal of Medicine 2002;346(3):158–164.
6. Ma Y-J, Searleman AC, Jang H, et al. Whole-brain myelin imaging using 3D double-echo sliding inversion recovery ultrashort echo time (DESIRE UTE) MRI. Radiology 2020;294(2):362.
7. Wilhelm MJ, Ong HH, Wehrli SL, et al. Direct magnetic resonance detection of myelin and prospects for quantitative imaging of myelin density. Proceedings of the National Academy of Sciences 2012;109(24):9605–9610.
8. Horch RA, Gore JC, Does MD. Origins of the ultrashort‐T2 1H NMR signals in myelinated nerve: a direct measure of myelin content? Magnetic resonance in medicine 2011;66(1):24–31.
9. Filippi M, Paty DW, Kappos L, et al. Correlations between changes in disability and T2‐weighted brain MRI activity in multiple sclerosis: a follow‐up study. Neurology 1995;45(2):255–260.
10. Gass A, Barker GJ, Kidd D, et al. Correlation of magnetization transfer ration with clinical disability in multiple sclerosis. Annals of Neurology: Official Journal of the American Neurological Association and the Child Neurology Society 1994;36(1):62–67.
11. Nijeholt GJ, van Walderveen MA, Castelijns JA, et al. Brain and spinal cord abnormalities in multiple sclerosis. Correlation between MRI parameters, clinical subtypes and symptoms. Brain: a journal of neurology 1998;121(4):687–697.
12. Barkhof F. The clinico-radiological paradox in multiple sclerosis revisited. Current opinion in neurology 2002;15(3):239–245.
13. Barkhof F, Scheltens P. Imaging of white matter lesions. Cerebrovascular Diseases 2002;13(Suppl. 2):21–30.
14. Wattjes MP, Steenwijk MD, Stangel M. MRI in the Diagnosis and Monitoring of Multiple Sclerosis: An Update. Clin Neuroradiol. 2015; 25 Suppl 2: 157–165.
Figures