3385
Quantification of Thalamic Volume in Multiple Sclerosis: From the Multicenter INNI Dataset Towards the Clinical Application
Loredana Storelli1, Elisabetta Pagani1, Patrizia Pantano2,3, Gioacchino Tedeschi4, Nicola De Stefano5, Maria Assunta Rocca1,6,7, and Massimo Filippi1,6,7,8,9
1Neuroimaging Research Unit, Division of Neuroscience, IRCCS San Raffaele Scientific Institute, Milan, Italy, 2Department of Human Neurosciences, Sapienza University of Rome, Rome, Italy, 3IRCCS NEUROMED, Pozzilli, Italy, 4Department of Advanced Medical and Surgical Sciences, and 3T MRI-Center, University of Campania “Luigi Vanvitelli”, Naples, Italy, 5Department of Medicine, Surgery and Neuroscience, University of Siena, Siena, Italy, 6Neurology Unit, IRCCS San Raffaele Scientific Institute, Milan, Italy, 7Vita-Salute San Raffaele University, Milan, Italy, 8Neurorehabilitation Unit, IRCCS San Raffaele Scientific Institute, Milan, Italy, 9Neurophysiology Service, IRCCS San Raffaele Scientific Institute, Milan, Italy
1Neuroimaging Research Unit, Division of Neuroscience, IRCCS San Raffaele Scientific Institute, Milan, Italy, 2Department of Human Neurosciences, Sapienza University of Rome, Rome, Italy, 3IRCCS NEUROMED, Pozzilli, Italy, 4Department of Advanced Medical and Surgical Sciences, and 3T MRI-Center, University of Campania “Luigi Vanvitelli”, Naples, Italy, 5Department of Medicine, Surgery and Neuroscience, University of Siena, Siena, Italy, 6Neurology Unit, IRCCS San Raffaele Scientific Institute, Milan, Italy, 7Vita-Salute San Raffaele University, Milan, Italy, 8Neurorehabilitation Unit, IRCCS San Raffaele Scientific Institute, Milan, Italy, 9Neurophysiology Service, IRCCS San Raffaele Scientific Institute, Milan, Italy
Synopsis
Keywords: Multiple Sclerosis, Neuroinflammation
Thalamic atrophy has been found since the earliest phases of multiple sclerosis (MS). However, this measure is not included in clinical practice, due to the time-consuming manual segmentation and technical challenges. By comparing thalamic segmentations from three available automatic methods in a multicenter dataset, we found that the inclusion of fractional anisotropy maps facilitated the automatic identification of thalamic boundaries increasing robustness of the results. In particular, the multimodal approach (FSL-MIST) showed a better capability to detect small longitudinal variations of thalamic volumes in MS patients and a better correlation with another relevant MRI measure such as the lesion volume.Introduction
The thalamus is a highly organized gray matter (GM) structure that has a critical role in linking cortical and subcortical circuits which subserve many neurological functions. Several studies reported a volume reduction of thalamus not only in all clinical multiple sclerosis (MS) phenotypes, but also in the early phase of the disease. Thalamic atrophy has been reported in patients with clinically isolated syndrome,1 early relapsing-remitting2 and primary progressive MS3 and even in pediatric MS.4 Thalamic atrophy is related to both the presence of thalamic lesions and to the extent of brain T2 and T1 lesions. Moreover, the thalamus is an informative region about disease evolution,5,6 being included as secondary endpoint in clinical trials.7 In the clinics, this measure is however still not obtained, mainly because of the time-consuming procedure required for the manual segmentation. On the other hand, the existing automatic methods do not provide a good enough reproducibility that allows monitoring atrophy changes at single patient level.8,9 Recently a multimodal approach for subcortical nuclei segmentation was included in the FSL library encouraging the inclusion of fractional anisotropy map (FA) for a better delineation of this structure.10 The Italian Neuroimaging Network Initiative (INNI) supports the creation of a repository where MRI, clinical and neuropsychological data from MS patients and healthy controls (HC) are collected from four Italian Research Centers with internationally-recognized expertise in MRI applied to MS. Using a large multicenter MRI dataset from INNI, we aimed to obtain a reliable, automatic segmentation of the thalamus in MS and to compare the results with existing automatic approaches.Methods
141 relapsing-remitting (RR) MS (Center A: 35, Center B: 34, Center C: 36, Center D: 36) and 69 HC (Center A: 20, Center B: 14, Center C: 20, Center D: 15) with baseline and 1-year 3D T1-weighted, T2-weighted and diffusion weighted (DW) MRI were collected from INNI repository. Demographic information were collected for all subjects, while for MS patients the Expanded Disability Status Scale (EDSS) and disease duration were also obtained. The selected approaches were applied on the whole dataset both cross-sectionally and longitudinally (for those with follow-up): (a) FSL-MIST toolbox, that included DWI-derived FA and 3D T1-weighted images as input for thalamic segmentation, allowing multimodal segmentation of subcortical nuclei; (b) FSL-FIRST (version 5.0.9) which required 3D T1-weighted images as single input for thalamic segmentation, as well as FreeSurfer (version 6.0). The agreement among the results of the pipelines and the effect sizes in differentiating between patients and HC both at baseline and at follow-up were assessed. Comparison between methods was performed by evaluating also correlations with age and clinical variables (EDSS, disease duration) at baseline. Then, the variability of the results of the longitudinal changes of thalamic volumes in HC at follow-up for the different pipelines was also evaluated.Results
MS patients and HC were age- and sex-matched, with a higher prevalence of females in both groups. As expected, T2-hyperintense lesion volume was significantly higher in RRMS group compared to HC. At baseline, all software (Figure 1) showed a good agreement in the results of thalamic volume, with the highest between FSL-FIRST and FSL MIST (R=0.87, p<0.001). FSL-MIST showed the highest effect size (Cohen’s d=1.11) and the lowest variability (SD for the thalamic volume distribution in HC=1.36 ml, in MS=1.48 ml) at baseline. Pearson’s correlation at baseline among the results of the different pipelines and subjects’ age was significant and similar among the pipelines (R=[-0.36:-0.35], all p<0.001): at baseline, partial correlations (adjusted for age) with EDSS (R=-0.3, p<0.001 for FSL-FIRST, R=-0.17, p=0.04 for Freesurfer and R=-0.16, p=0.06 for FSL-MIST) and disease duration (R=-0.2, p=0.02 for FSL-FIRST, R=-0.12, p=0.1 for Freesurfer and R=-0.10, p=0.3 for FSL-MIST) for MS patients were low for all the compared tools and in some cases (i.e. disease duration) not significant. Considering the results of the percentage thalamic volume change in HC (Figure 2), FSL-MIST showed the lowest variability (SD=1.07%) in comparison to the other pipelines and a better capability to significantly differentiate between patients and HC (Cohen’s d=0.21, p=0.04).Discussion
At baseline, we found a significant agreement among the software for automatic thalamic segmentation, with the highest effect size in differentiating between HC and MS and the lowest variability for FSL-MIST toolbox, both at baseline and for longitudinal volume changes. The inclusion of FA contrast increased robustness of the results and a better capability to detect small longitudinal variations of thalamic volumes, as shown by FSL-MIST results. The correlations with clinical scores did not show significant differences among the pipelines and need further investigations. Due to the lack of data on accuracy and precision, in the selection of the appropriate pipeline for automatic thalamic segmentation, it would be important to take into account the application context in a balance between ease of use (FIRST) and better longitudinal reproducibility (FSL-MIST).Conclusions
We found that the inclusion of FA contrast increased robustness of the longitudinal results and a better capability to detect small variations of thalamic volumes, as shown by MIST results. The advantage of a multimodal approach is also shown by the results of correlations with lesion volume changes for FSL-MIST.Acknowledgements
The authors present this work on behalf the INNI Network.
Funding. Partially supported by Fondazione Italiana Sclerosi Multipla (research fellowship FISM 2019/BR/009 and research grant FISM2018/S/3), and financed or co-financed with the ‘5 per mille’ public funding.
References
1. Audoin B, Ranjeva JP, Au Duong MV, et al. Voxel-based analysis of MTR images: a method to locate gray matter abnormalities in patients at the earliest stage of multiple sclerosis. Journal of magnetic resonance imaging : JMRI. 2004;20(5):765-71. 2. Audoin B, Davies GR, Finisku L, Chard DT, Thompson AJ, Miller DH. Localization of grey matter atrophy in early RRMS : A longitudinal study. Journal of neurology. 2006;253(11):1495-501. 3. Sepulcre J, Sastre-Garriga J, Cercignani M, Ingle GT, Miller DH, Thompson AJ. Regional gray matter atrophy in early primary progressive multiple sclerosis: a voxel-based morphometry study. Archives of neurology. 2006;63(8):1175-80. 4. Mesaros S, Rocca MA, Absinta M, et al. Evidence of thalamic gray matter loss in pediatric multiple sclerosis. Neurology. 2008;70(13 Pt 2):1107-12. 5. Rocca MA, Mesaros S, Pagani E, Sormani MP, Comi G, Filippi M. Thalamic damage and long-term progression of disability in multiple sclerosis. Radiology. 2010;257(2):463-9. 6. Mesaros S, Rocca MA, Pagani E, et al. Thalamic damage predicts the evolution of primary-progressive multiple sclerosis at 5 years. AJNR American journal of neuroradiology. 2011;32(6):1016-20. 7. Filippi M, Rocca MA, Pagani E, et al. Placebo-controlled trial of oral laquinimod in multiple sclerosis: MRI evidence of an effect on brain tissue damage. Journal of neurology, neurosurgery, and psychiatry. 2014;85(8):851-8. 8. Meijerman A, Amiri H, Steenwijk MD, et al. Reproducibility of Deep Gray Matter Atrophy Rate Measurement in a Large Multicenter Dataset. AJNR American journal of neuroradiology. 2017. 9. Velasco-Annis C, Akhondi-Asl A, Stamm A, Warfield SK. Reproducibility of Brain MRI Segmentation Algorithms: Empirical Comparison of Local MAP PSTAPLE, FreeSurfer, and FSL-FIRST. Journal of neuroimaging : official journal of the American Society of Neuroimaging. 2017. 10. Visser E, Keuken MC, Forstmann BU, Jenkinson M. Automated segmentation of the substantia nigra, subthalamic nucleus and red nucleus in 7T data at young and old age. NeuroImage. 2016;139:324-36.Figures
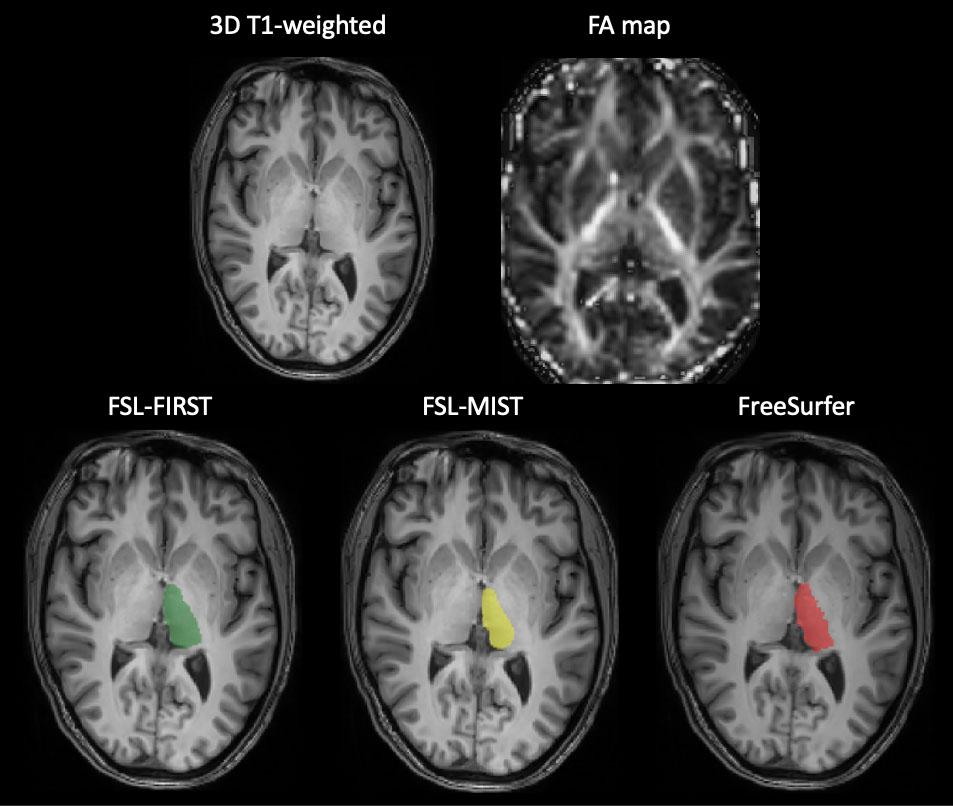
Figure 1. An example of thalamic segmentations for the
FSL-FIRST (in green), FSL-MIST (in yellow) and Freesurfer (in red) for a healthy
volunteer. The two axial slices in the first row represent the 3D T1-weighted
and FA map for the same subject, respectively, used as inputs by the pipelines.
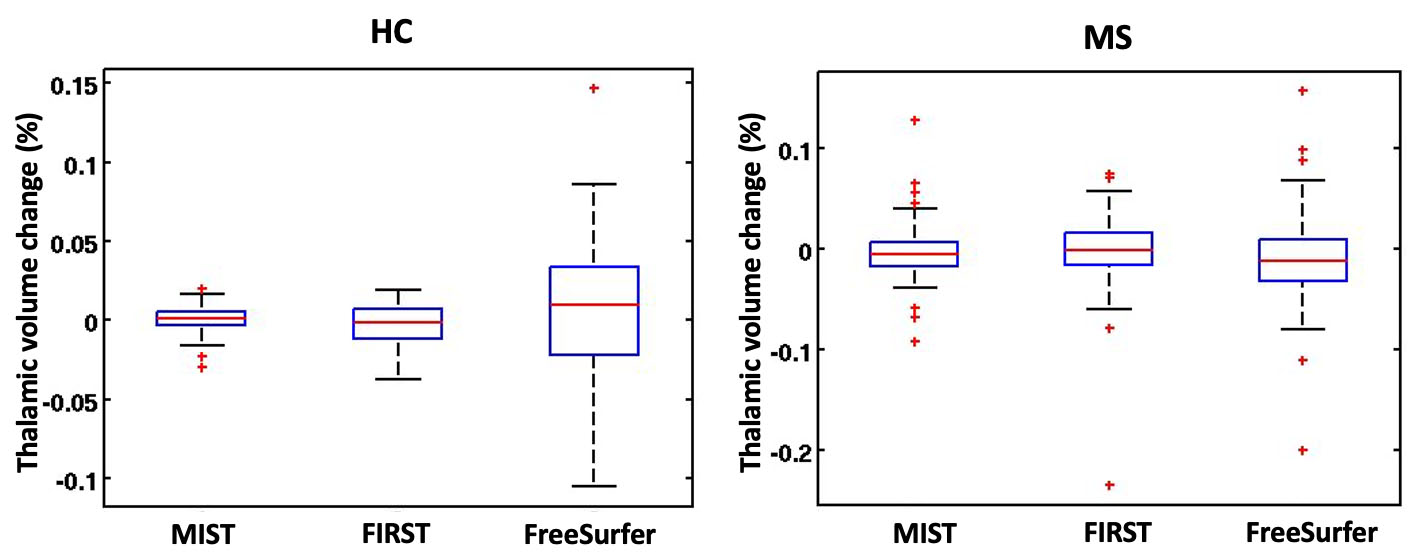
Figure 2. Thalamic percentage volume change
distributions for a healthy controls (on the left) and multiple sclerosis
patients (on the right) for the three compared software.
DOI: https://doi.org/10.58530/2023/3385