3384
Fixel Based Analysis detection of peri-lesion and NAWM abnormalities in Relapsing Remitting Multiple Sclerosis1Medical Physics, University of British Columbia, Kelowna, BC, Canada, 2Icahn School of Medicine at Mount Sinai, New York, NY, United States, 3University of Cambridge, Cambridge, United Kingdom
Synopsis
Keywords: Multiple Sclerosis, Diffusion/other diffusion imaging techniques, fixed based analysis, DTI, brain, lesions, peri-lesion, normal appearing white matter
Diffusion Tensor Imaging and Fixel Based Analysis (FBA) techniques were used to analyze microstructural properties of multiple sclerosis (MS) lesions and normal appearing white matter (NAWM) in relapsing-remitting multiple sclerosis (RRMS) subjects. FBA metric values were similar in peri-lesion white matter and MS lesions compared with bulk NAWM which may indicate FBA metric sensitivity to the infiltration of RRMS lesion pathology into surrounding NAWM. FBA fibre density in bulk NAWM was significantly different between subjects treated with Copaxone vs. Tysabri, which may indicate FBA metric sensitivity to NAWM differences between disease modifying therapies.Introduction
Relapsing-Remitting Multiple Sclerosis (RRMS) is a chronic inflammatory autoimmune disorder characterized by the presence of demyelinating lesions in the central nervous system1,2. RRMS disease activity can be reduced by using disease modifying therapies (DMTs)3. Tissue microstructure abnormalities that occur in RRMS can be probed using diffusion MRI4.Diffusion Tensor Imaging (DTI) provides metrics of fractional anisotropy (FA) and mean diffusivity (MD). DTI is limited in its ability to characterize complex fibre bundle geometries such as crossing fibres5. Other diffusion MRI analysis methods have been developed that perform better in regions of complicated fibre geometries.
Fixel Based Analysis (FBA) takes into consideration complex fibre geometries and allows for the characterization of fibre density (FD), fibre-bundle cross-section (FC), and fibre density and cross-section (FDC) for fibres within a given voxel (i.e., fixel)6,7. Past work has illustrated the sensitivity of FBA in MS with comparisons of metrics between lesions and whole brain normal appearing white matter (NAWM)2,8,9. However, whole brain NAWM analysis does not capture regional variations in FBA metrics, including NAWM in close proximity to lesions. FBA of peri-lesion NAWM may provide insight into the extent of microstructural damage beyond lesion boundaries. Additionally, FBA metrics may be sensitive to changes in tissue microstructure that occur in patients receiving DMTs.
Objective: Investigate DTI and FBA metrics in RRMS subjects within MS lesions, peri-lesion NAWM, and whole brain NAWM. Differences in FBA and DTI metrics between RRMS subjects on various DMTs were also investigated.
Methods
Acquisition: T2 fluid attenuation inversion recovery (FLAIR) and diffusion MRI from the Reserve against Disability in Early MS (RADIEMS) cohort study were analyzed for 98 patients diagnosed with RRMS (including those receiving no DMT, and those treated with Tecfidera, Tysabri, Gilenya, or Copaxone) and 20 healthy controls. Subjects were scanned on a 3T Skyra (Siemens, Erlangen) scanner and both anatomical (T2-FLAIR, resolution 1x1x1mm3) and diffusion (diffusion-weighted SE EPI, TR/TE=4100/91ms, resolution 2x2x2mm3, single shell b=1200, 64 directions) images were obtained.Diffusion processing: An overview of the imaging pipeline is given in Figure 1. Pre-processing included EPI-distortion10, eddy-current, motion correction11, bias field correction12, and global intensity normalization13. Single-shell 3-Tissue Constrained Spherical Deconvolution was performed14 using MRtrix3Tissue. A population-averaged template was constructed from all RRMS subjects and controls13,15,16 and used to create a fixel mask17. DTI and FBA metrics for each subject’s whole brain were calculated. The log(FC) was taken as it gives values centred at zero.
Brain Masking: Lesions were segmented from T2-FLAIR images using a lesion prediction algorithm18. MS subject lesion masks were dilated using a 2mm spherical kernel19. For each MS subject, the original lesion masks were subtracted from the dilated masks and whole brain NAWM masks to create bulk NAWM and peri-lesion masks, respectively (Figure 2). DTI and FBA metrics were extracted for each MS patient’s MS lesions, peri-lesion NAWM, and bulk NAWM masks.
Statistical analysis: Average values of FBA and DTI metrics for each subject’s masks were compared between RRMS subjects and the average across healthy controls and between different RRMS tissue masks using paired t-tests. A Kruskal-Wallis test with post-hoc Bonferroni correction was applied to test for differences between DMT groups in FD, log(FC), FDC, and MD metrics (FA was not included due to significant correlation between FD and FA R2 = 0.83).
Results
DTI: Increased MD and decreased FA was observed in RRMS subjects compared to healthy controls for all tissue masks (Figure 3). Significant differences in FA were observed between the three tissue masks in RRMS subjects (Table 1).FBA: FD, log(FC), and FDC were decreased in RRMS subjects compared to healthy controls in all tissue masks (Figure 3). Values in peri-lesion NAWM were significantly different from values in bulk NAWM (Table 1). A significant difference between DMT groups was found only for FD in NAWM. Bonferroni corrected post-hoc analysis found a significant 4.2% increase in the FD of bulk NAWM between subjects treated with Copaxone vs. Tysabri (Table 2).
Discussion
In this study DTI and FBA techniques were used to investigate differences between RRMS subjects and healthy controls. We observed increased MD and decreased FA in MS lesions, peri-lesion NAWM, and bulk NAWM of RRMS subjects, in agreement with previous literature4,20. The observed decreased FD, FC, and FDC in RRMS subjects relative to controls also agrees with previous reports8.The significant difference in FBA metrics for peri-lesion NAWM vs bulk NAWM may indicate FBA sensitivity to tissue microstructure changes in MS lesions extending into nearby NAWM, which has not been reported in previous studies for FBA-FD21. Comparing FBA metric values between DMT groups found a significant difference in NAWM FD between subjects treated with Copaxone vs. Tysabri. This may indicate FBA techniques are able to distinguish changes in NAWM between drug treatments.
Conclusion
Using DTI and FBA we detected significant differences between bulk and peri-lesional NAWM; The FBA technique was also sensitive to differences detected in subjects treated with disease-modifying therapies (Copaxone and Tysabri). FBA is a promising technique which yields complementary information to existing analysis methods.Acknowledgements
We acknowledge the support of the National Institutes of Health (R01 HD082176, Sumowski), the Natural Sciences and Engineering Research Council of Canada (NSERC DG).References
[1] Filippi M. and Rocca M. A., "MR Imaging of Multiple Sclerosis," Radiology vol. 259(3), pp. 659-681, 2011.
[2] Gajamange S. et al, "Fibre-specific white matter changes in multiple sclerosis patients with optic neuritis," NeuroImage Clinical, vol. 17, pp. 60-68, 2018.
[3] Hart F.M. and Bainbridge J. “Current and emerging treatment of multiple sclerosis,” The American journal of managed care, vol. 22(6), pp. s159-s170, 2016.
[4] Rovaris M et al, "Diffusion MRI in multiple sclerosis," Neurology, vol. 65, (10), pp. 1526-1532, 2005.
[5] O’Donnell L.J. and Westin C.F., “An introduction to diffusion tensor image analysis,” Neurosurgery clinics of North America, vol. 22(2), pp. 185-196.
[6] Raffelt D.A. et al, "Investigating white matter fibre density and morphology using fixel-based analysis," NeuroImage, vol. 144, pp. 58-73, 2017.
[7] Dhollander T., et al., “Fixel-based analysis of diffusion MRI: Methods, applications, challenges and opportunities,” NeuroImage, vol. 24, pp. 1184, 2021.
[8] Carandini T., et al., “Disruption of brainstem monoaminergic fibre tracts in multiple sclerosis as a putative mechanism for cognitive fatigue: a fixel-based analysis,” NeuroImage clinical, vol. 30, pp. 102587, 2021.
[9] Storelli L., et al., “Measurement of white matter fiber-bundle cross-section in multiple sclerosis using diffusion-weighted imaging,” Multiple sclerosis, vol. 27(6), pp. 818-826, 2021.
[10] Holland D., Kuperman J.M. and Dale A.M., "Efficient correction of inhomogeneous static magnetic field-induced distortion in Echo Planar Imaging," NeuroImage, vol. 50, (1), pp. 175-183, 2010.
[11] Anderss J. L. R. and Sotiropoulos S. N., “An integrated approach to correction for off resonance effects and subject movement in diffusion MR imaging,” Neuroimage, vol. 125, pp. 1063–1078, 2016.
[12] Tustison N. J., et al., “N4ITK: improved N3 bias correction,” IEEE Trans. Med. Imaging, vol. 29, pp. 1310–20, 2010.
[13] Tournier J. D,, et al., “MRtrix3: A fast, flexible and open software framework for medical image processing and visualisation,” NeuroImage, vol. 202, pp 116137, 2019.
[14] Dhollander T., and Connelly A. (2016). A novel iterative approach to reap the benefits of multi-tissue CSD from just single-shell (+b=0) diffusion MRI data.
[15] Raffelt D. et al, "Symmetric diffeomorphic registration of fibre orientation distributions," NeuroImage, vol. 56, (3), pp. 1171-1180, 2011.
[16] Raffelt D. et al, "Reorientation of fiber orientation distributions using apodized point spread functions," Magnetic Resonance in Medicine, vol. 67, (3), pp. 844-855, 2012.
[17] Raffelt D. et al, “Apparent Fibre Density: a novel measure for the analysis of diffusion-weighted magnetic resonance images,” Neuroimage, vol. 59, (4), pp 3976-94, 2012.
[18] Schmidt P., "Bayesian inference for structured additive regression models for large-scale problems with applications to medical imaging," Chapter 6.1, 2017.
[19] Jenkinson M., Beckmann C.F., Behrens T.E., Woolrich M.W., Smith S.M., “FSL.” NeuroImage, vol. 62, pp. 782-90, 2012
[20] Ge Y., Law M., and Grossman R. I., “Applications of diffusion tensor mr imaging in multiple sclerosis,” Annals of the New York Academy of Sciences, vol. 1064(1), pp. 202-219, 2015.
[21] van der Weijden C. W. J., et al., “Diffusion-derived parameters in lesions, peri-lesion and normal-apperaing white matter in multiple sclerosis using tensor, kurtosis, and fixel-based analysis,” Journal of Cerebral Blood Flow and Metabolism, vol. 42, pp. 2095-2106, 2022.
Figures
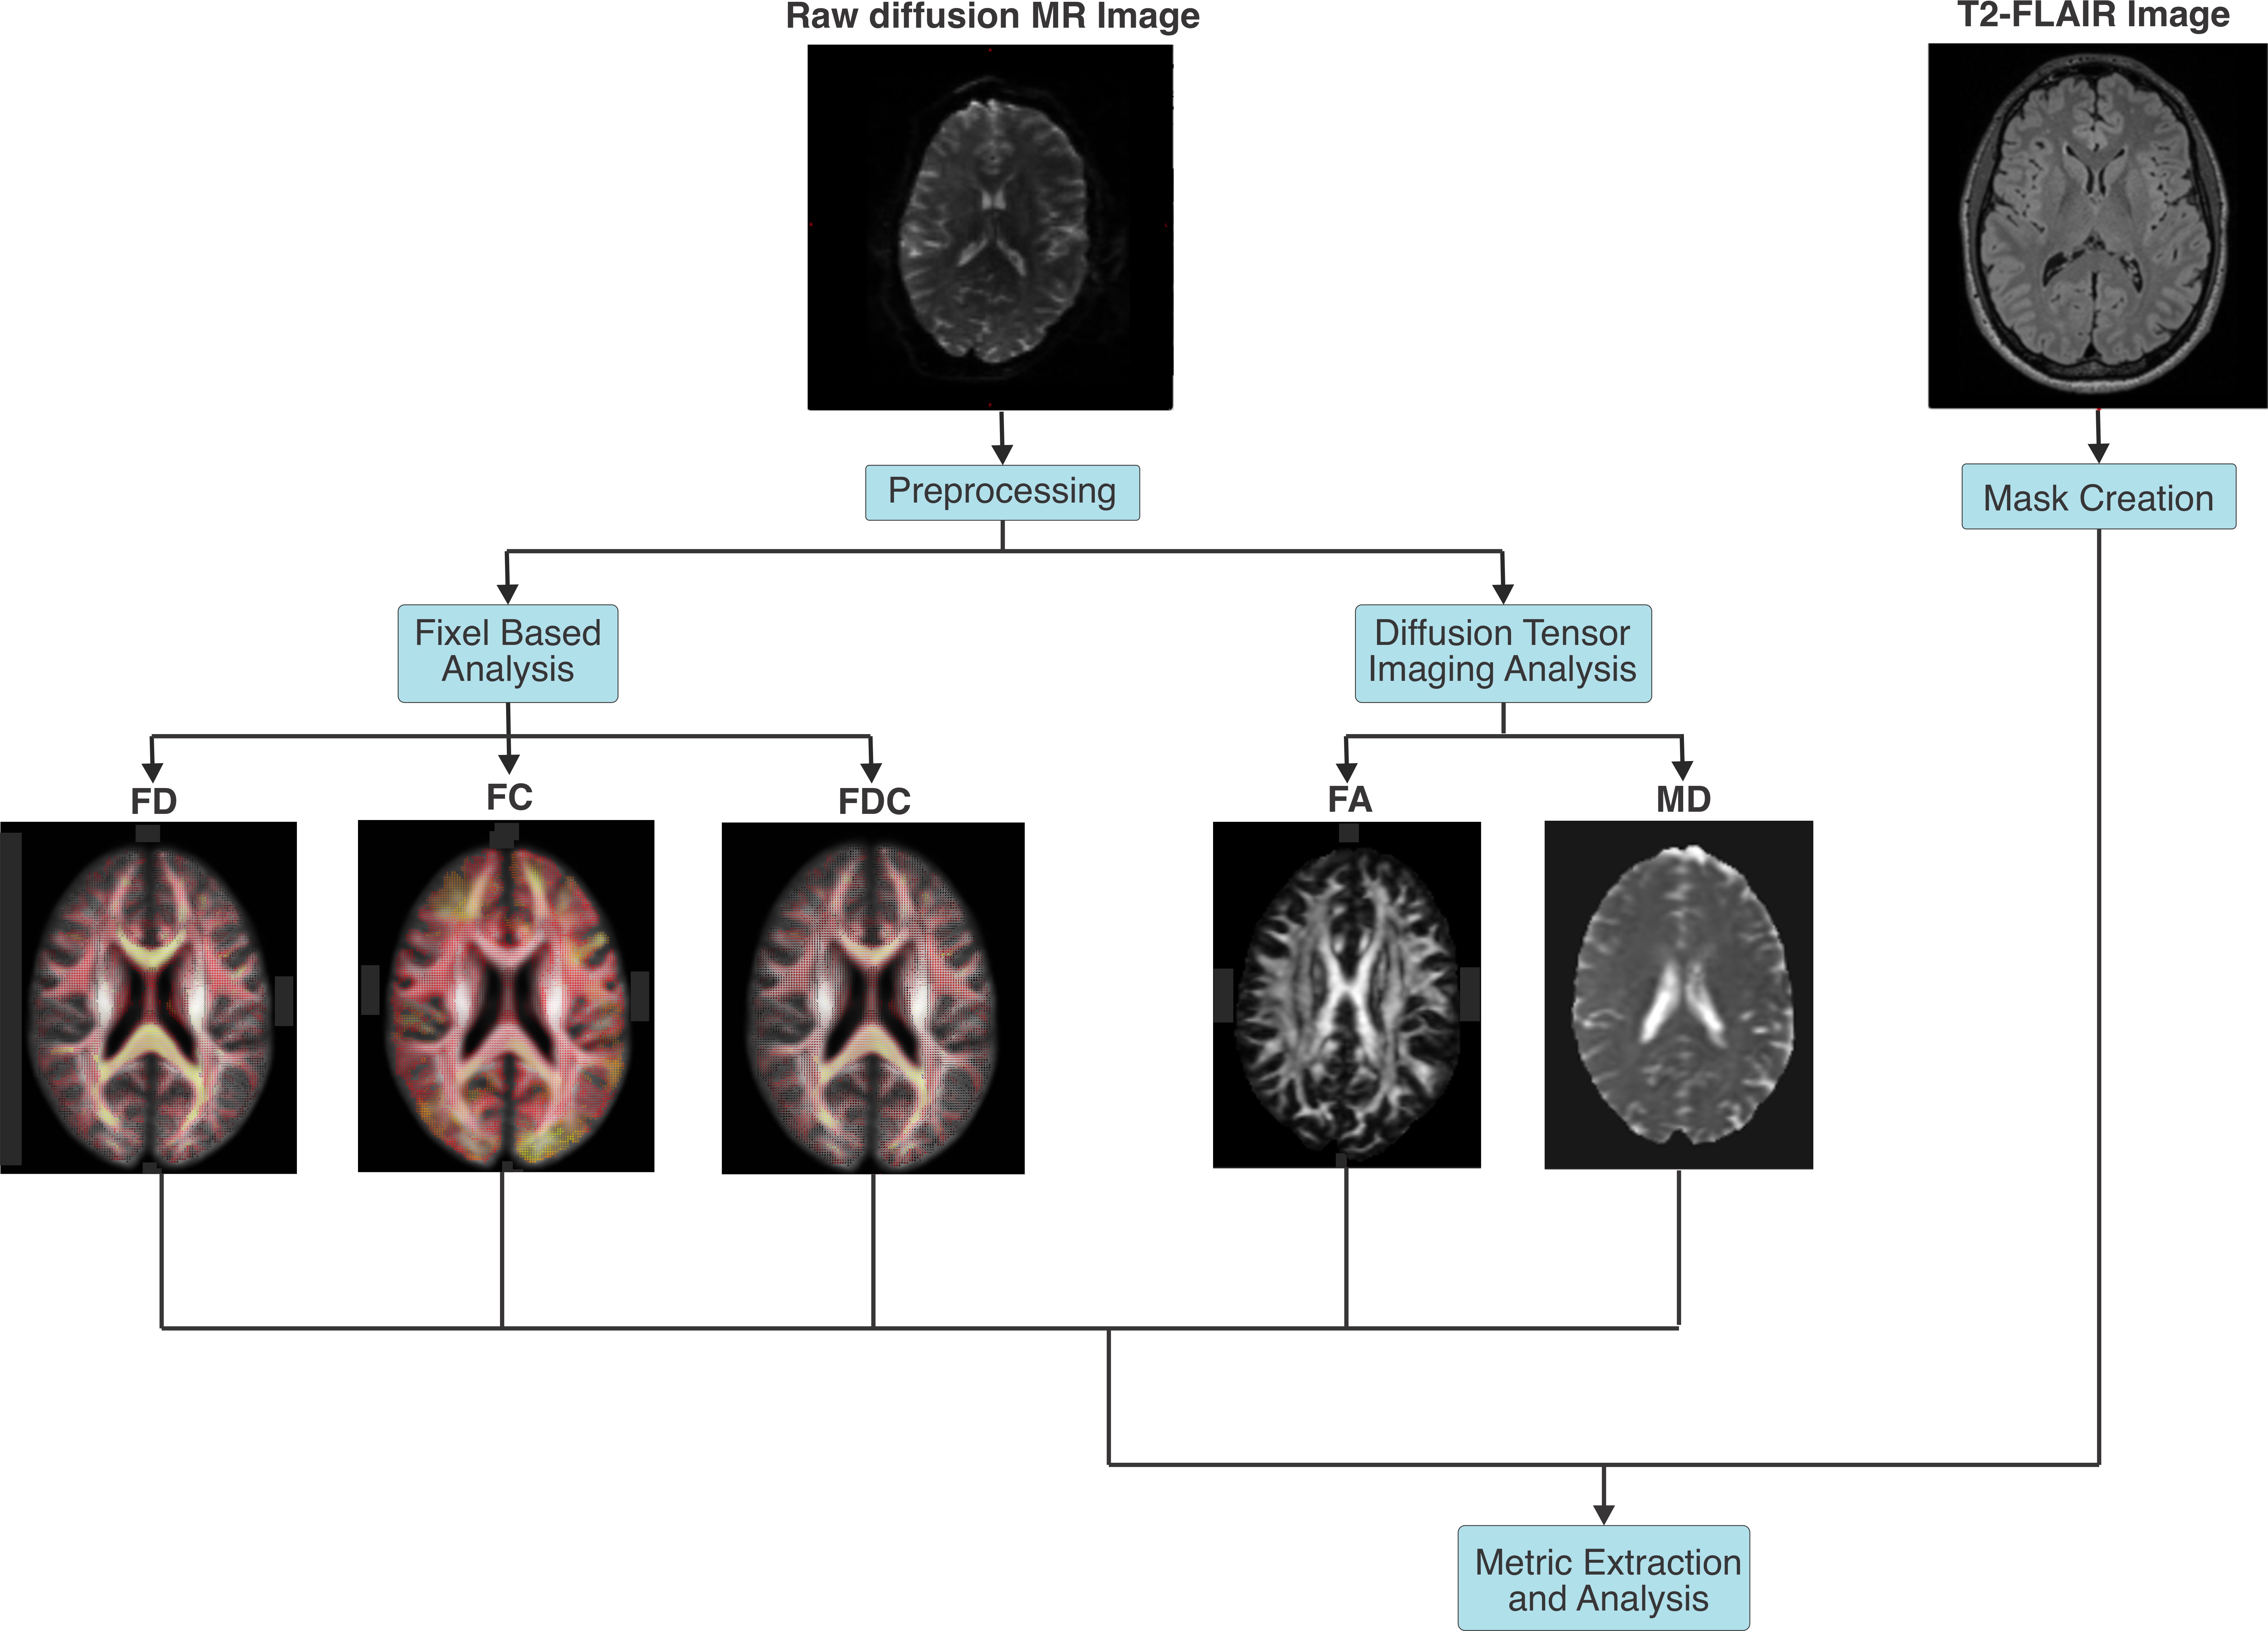
Figure 1: Image processing pipeline. Raw diffusion MR images were preprocessed and analyzed using diffusion tensor imaging and fixel based analysis. Maps of the fibre density (FD), fibre-bundle cross-section (FC), fibre density and cross-section (FDC), mean diffusivity (MD) and fractional anisotropy (FA) were extracted. T2-FLAIR images were used to create masks of MS lesions, peri-lesion NAWM, and bulk NAWM. Diffusion tensor imaging and fixel based analysis metrics were extracted from masked regions.
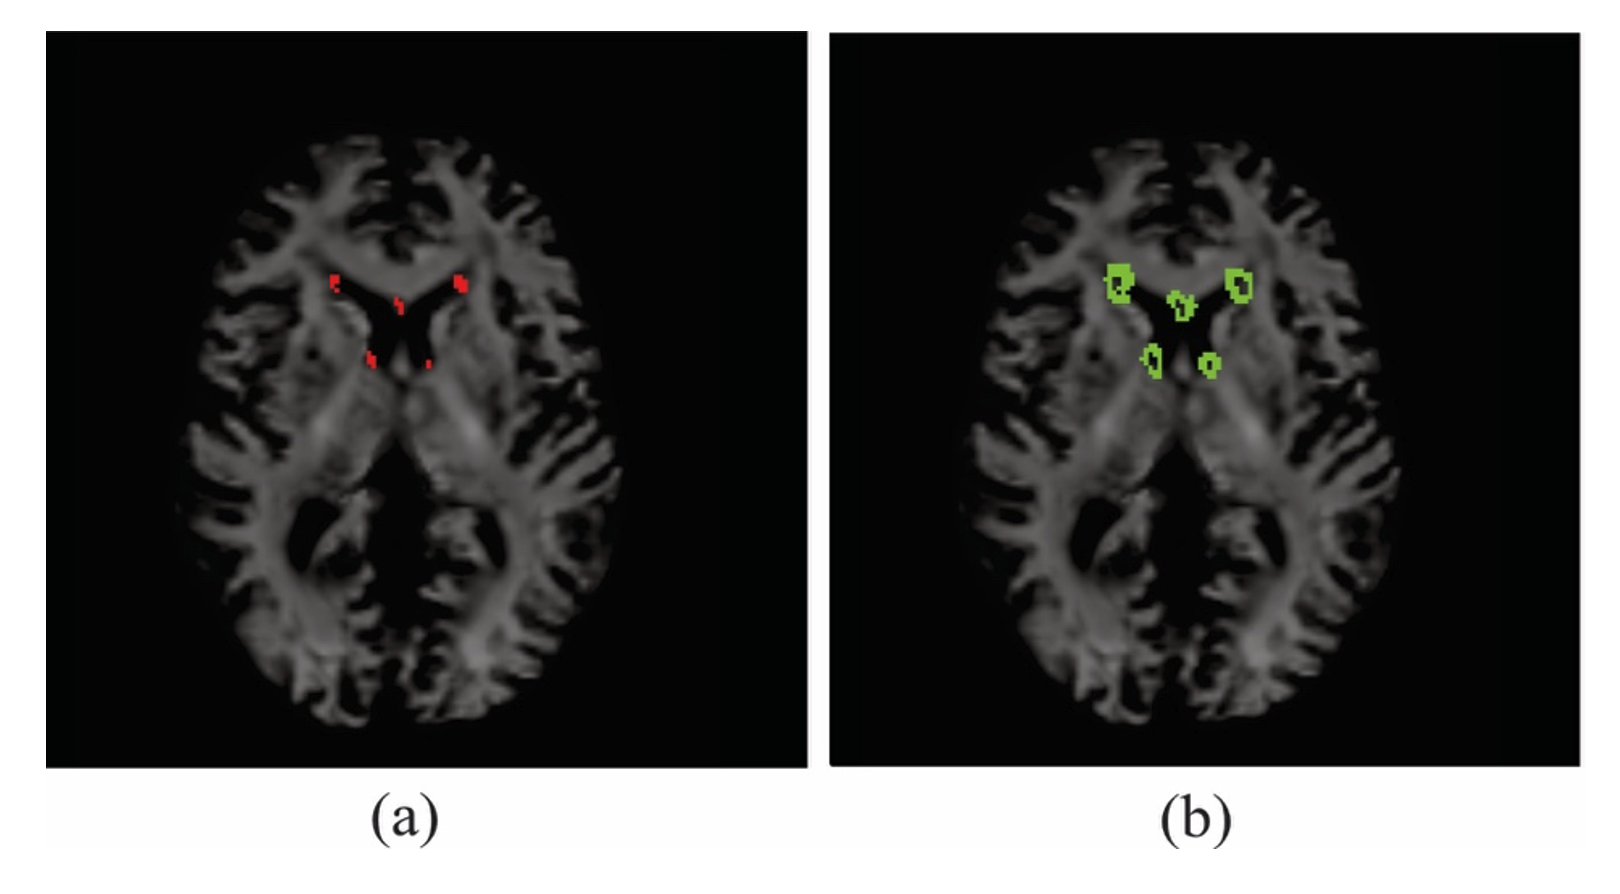
Figure 2: Axial slice of subject fibre orientation density image overlaid with (a) MS lesion mask, (b) peri-lesion NAWM mask. Metrics were only extracted for white matter voxels and thus ventricle tissue was not included in peri-lesion calculations.
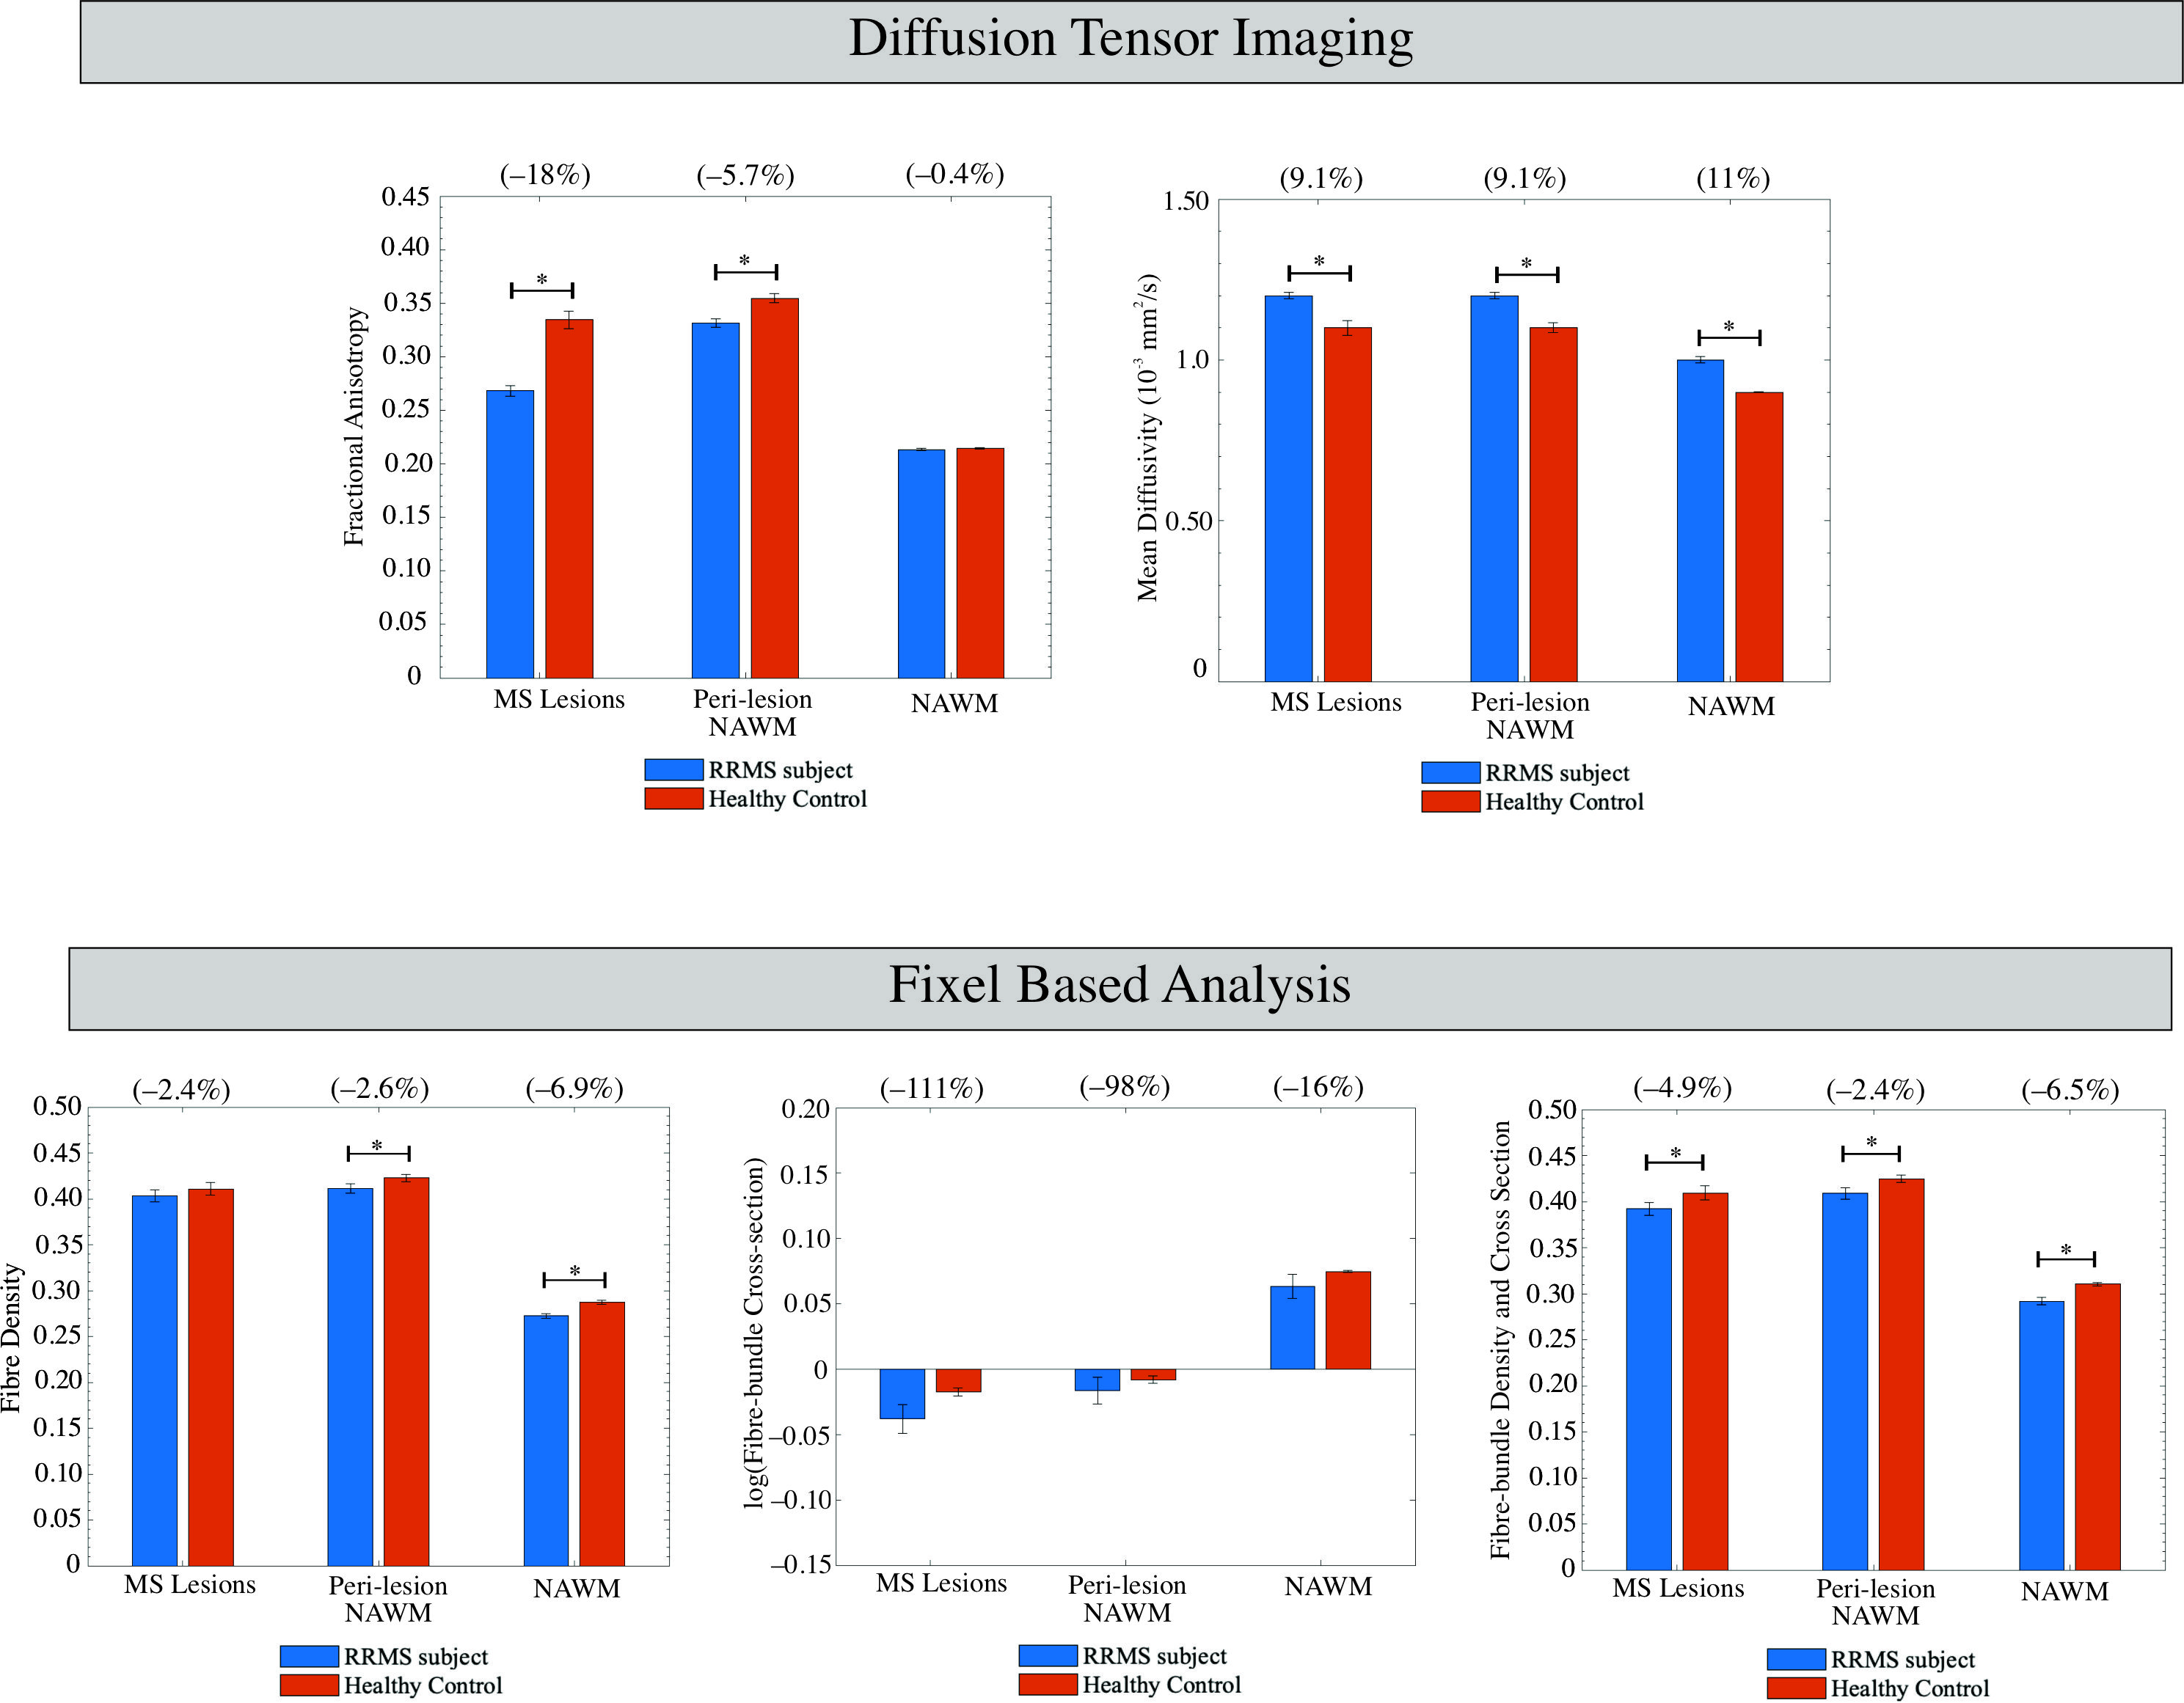
Figure 3: Average DTI (mean diffusivity and fractional anisotropy) and FBA (fibre density, log(fibre cross-section), and fibre-bundle density and cross-section) values for voxels in MS lesions, peri-lesion NAWM, and bulk NAWM. Error bars denote the standard error in the mean. Percent differences between RRMS subjects and healthy controls are given in brackets. Results of paired t-test are shown indicating significant (p<0.05) results with *.
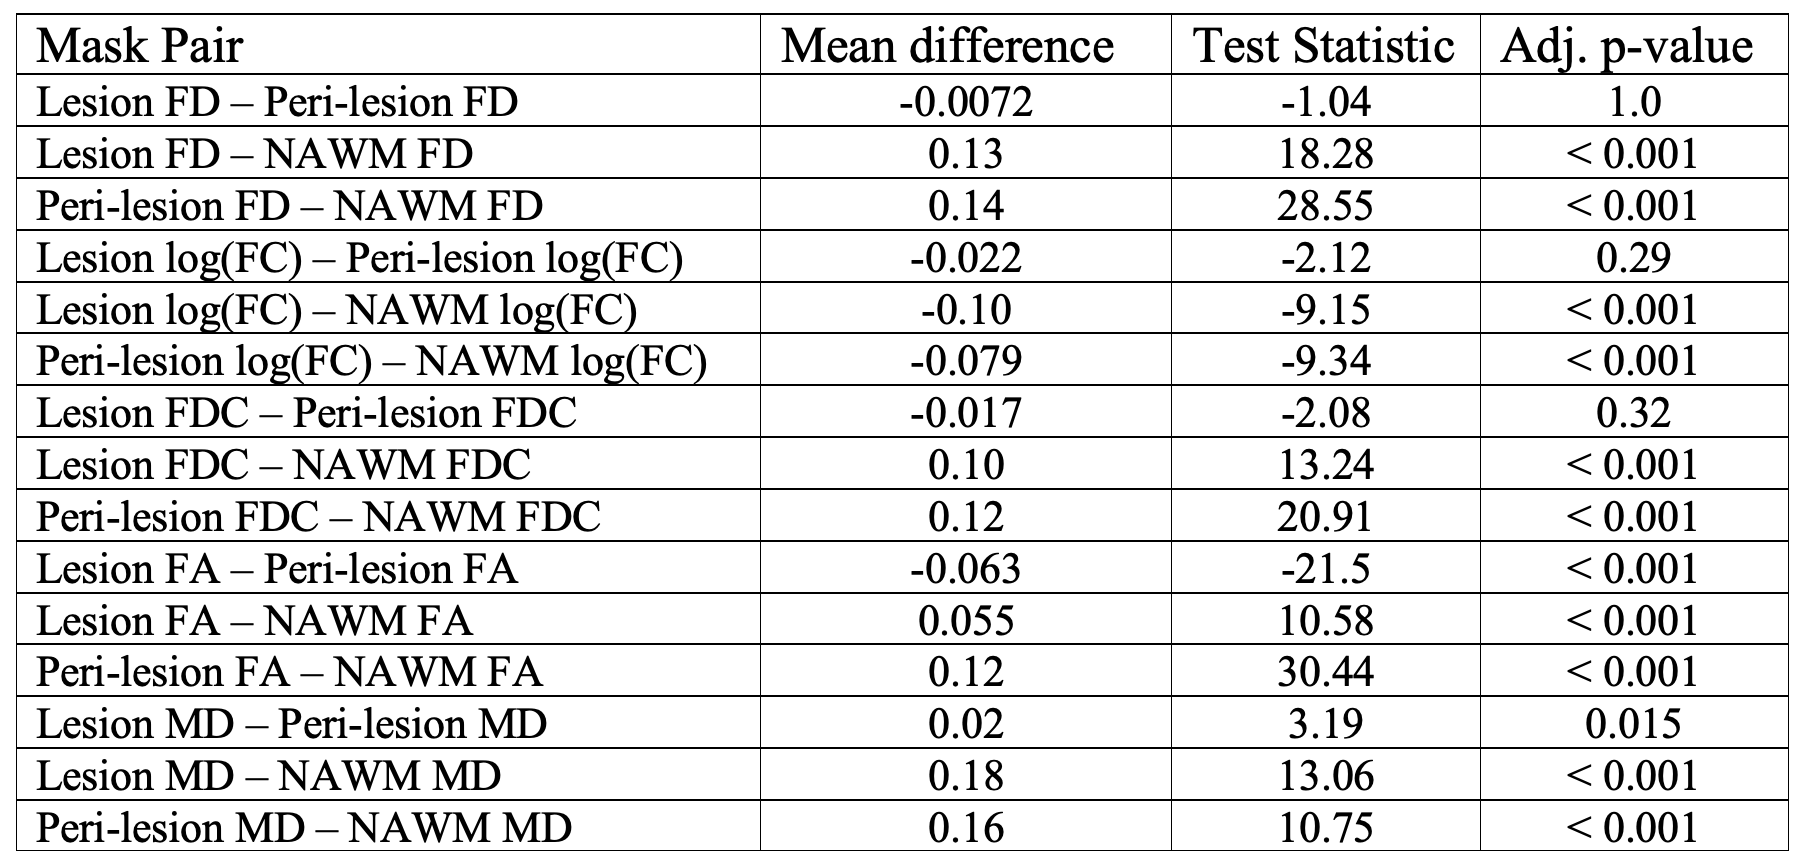
Table 1: Paired t-test results comparing metric value between lesion, peri-lesion NAWM and NAWM masks in RRMS subjects with Bonferroni adjusted p-values. A negative mean difference indicates that the first mask in the mask pair is smaller. (bold indicates significance)
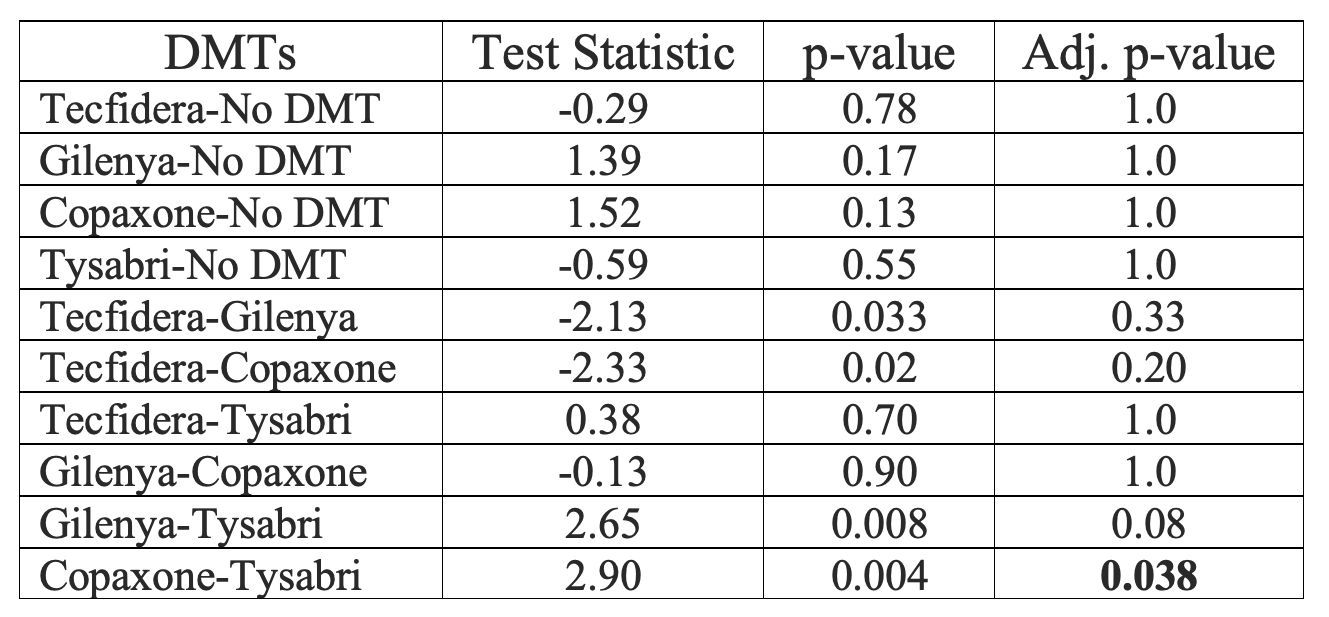
Table 2: Kruskal-Wallis test post-hoc analysis of fibre density in bulk NAWM of RRMS subjects with Bonferroni adjusted p-values (bold indicates significance).