3383
Mapping of Time-Dependent Myelin Changes in Multiple Sclerosis Lesions through Quantitative Separation of Magnetic Susceptibility Sources1Radiology, Weill Cornell Medicine, New York, NY, United States, 2Tongji Hospital, Wuhan, China, 3Neurology, Weill Cornell Medicine, New York, NY, United States
Synopsis
Keywords: Multiple Sclerosis, Susceptibility, Quantitative Susceptibility Mapping, susceptibility source separation
De- and remyelination are important treatment targets for multiple sclerosis therapies. In this study, we utilize susceptibility source separation to study differences in longitudinal trajectories of two important lesion types, paramagnetic rim lesions (rim+) and non-rim (rim-) lesions. We report significant difference in myelin content: while rim- lesions tend to demonstrate slow remyelination, rim+ tend to remain stable or demyelinate over time.Introduction
Quantitative susceptibility mapping (QSM) allows in vivo quantification of susceptibility changes related to iron deposition and myelin loss in multiple sclerosis lesions. It has been widely used in studying multiple sclerosis and can demonstrate the retention of iron among a subset of chronic lesions [1-3]. Enhancement of MS lesions on post-gadolinium T1 weighted images (T1WIGd) is a marker of the breakdown of the blood-brain barrier and acute stage of the pathology. As the BBB closes, lesions transition to the chronic stage. During this period, a subgroup of lesions may retain a rim of iron-laden proinflammatory cells and undergo further myelin damage. Identification of lesions with persistent inflammation and myelin damage is useful for therapeutic targeting. Previously, the change in susceptibility was followed for 6y in new Gd- enhancing lesions[7]. However, changes in susceptibility are difficult to interpret when iron and myelin are present in the same voxel. It was the aim of this study was to assess the longitudinal changes using magnetic susceptibility source separation [4-6] and to determine whether trajectories of tissue composition depend on the development of a hyperintense rim on QSM.Methods
A cohort of 19 patients (29 lesions: 14 rim+, 15 rim-) with relapsing-remitting MS was selected from an ongoing, prospective MS MR imaging and clinical data base for which annual MR imaging scans (including QSM) were collected during 10 years. Patients were selected for this study if they met the following inclusion criteria: 1) had at least 1 new Gd-enhancing (Gd) MS lesion on routine annual MR imaging, 2) had at least 3 longitudinal QSM scans (including at the time of Gd lesion detection), 3) had at least 2 MR imaging performed >1 year after Gd detection, and 4) had prior MR imaging to ensure that Gd lesions were newly formed lesions and not re-enhancing older lesions. MR images were acquired on 2 different platforms during the 10 years (details below). The study was approved by institutional review board, and written informed consent was obtained from each subject.MRI (from 2011 to 2021) were performed on 3T (Signa HDxt, GE Healthcare, Milwaukee, Wisconsin, 8-channel head coil; Skyra, Siemens, Erlangen, Germany, 20-channel head/neck coil). The protocol included 3D-T1WI, 2D-T2WI, and 3D-T2FLAIR for anatomic structure, 3D-mGRE for QSM, and gadolinium-enhanced 3D-T1WI to detect BBB disruption. The parameters for mGRE were: FOV=24 cm, TR=49–58 ms, TE1/ΔTE=4.5–6.7/4.1–4.8 ms, last TE=47.7 ms, acquisition matrix = 320–416$$$\times$$$205–320, rBW = 244–260 Hz/pixel, slice=3mm, FA=15°–20°, acceleration factor=2, total scan time ~4 min 30 sec, varying slightly with brain superior-inferior dimensions. QSM was reconstructed from complex GRE images using morphology-enabled dipole inversion (MEDI0) method zero-referenced to the global CSF[8]. Susceptibility source separation was performed using $$$R_2^*$$$QSM[6]. All images (T1WI, T1WIGd, T2WI, T2-weighted FLAIR) and the follow-up QSM/$$$-\chi^-$$$ images were coregistered to the baseline GRE magnitude images using FLIRT (http://www.fmrib.ox.ac.uk/fsl/fslwiki/FLIRT).
New MS lesions were identified on T1WIGd images and visually classified on QSM as rim+ or rim- by 2 independent reviewers. A lesion was designated as rim if QSM was hyperintense at the edge of the lesion at any of the longitudinal time points. In addition, at each time point, new enhancing lesions were dated as 0y. To assess longitudinal changes, acquisition dates 12 months post enhancement (chronic stage) were included into analysis. ROIs were created on coregistered T2-weighted images and then overlaid them on susceptibility maps. For each lesion, susceptibility value of at the initial time point was subtracted from the consecutive timepoints to the influence of local fiber orientation.
Longitudinal $$$-\chi^-$$$ data was fitted to a linear mixed effect model with myelin susceptibility used as the response variable, time and rim status as the predictor variables, and subject ID as the grouping variable.
Results
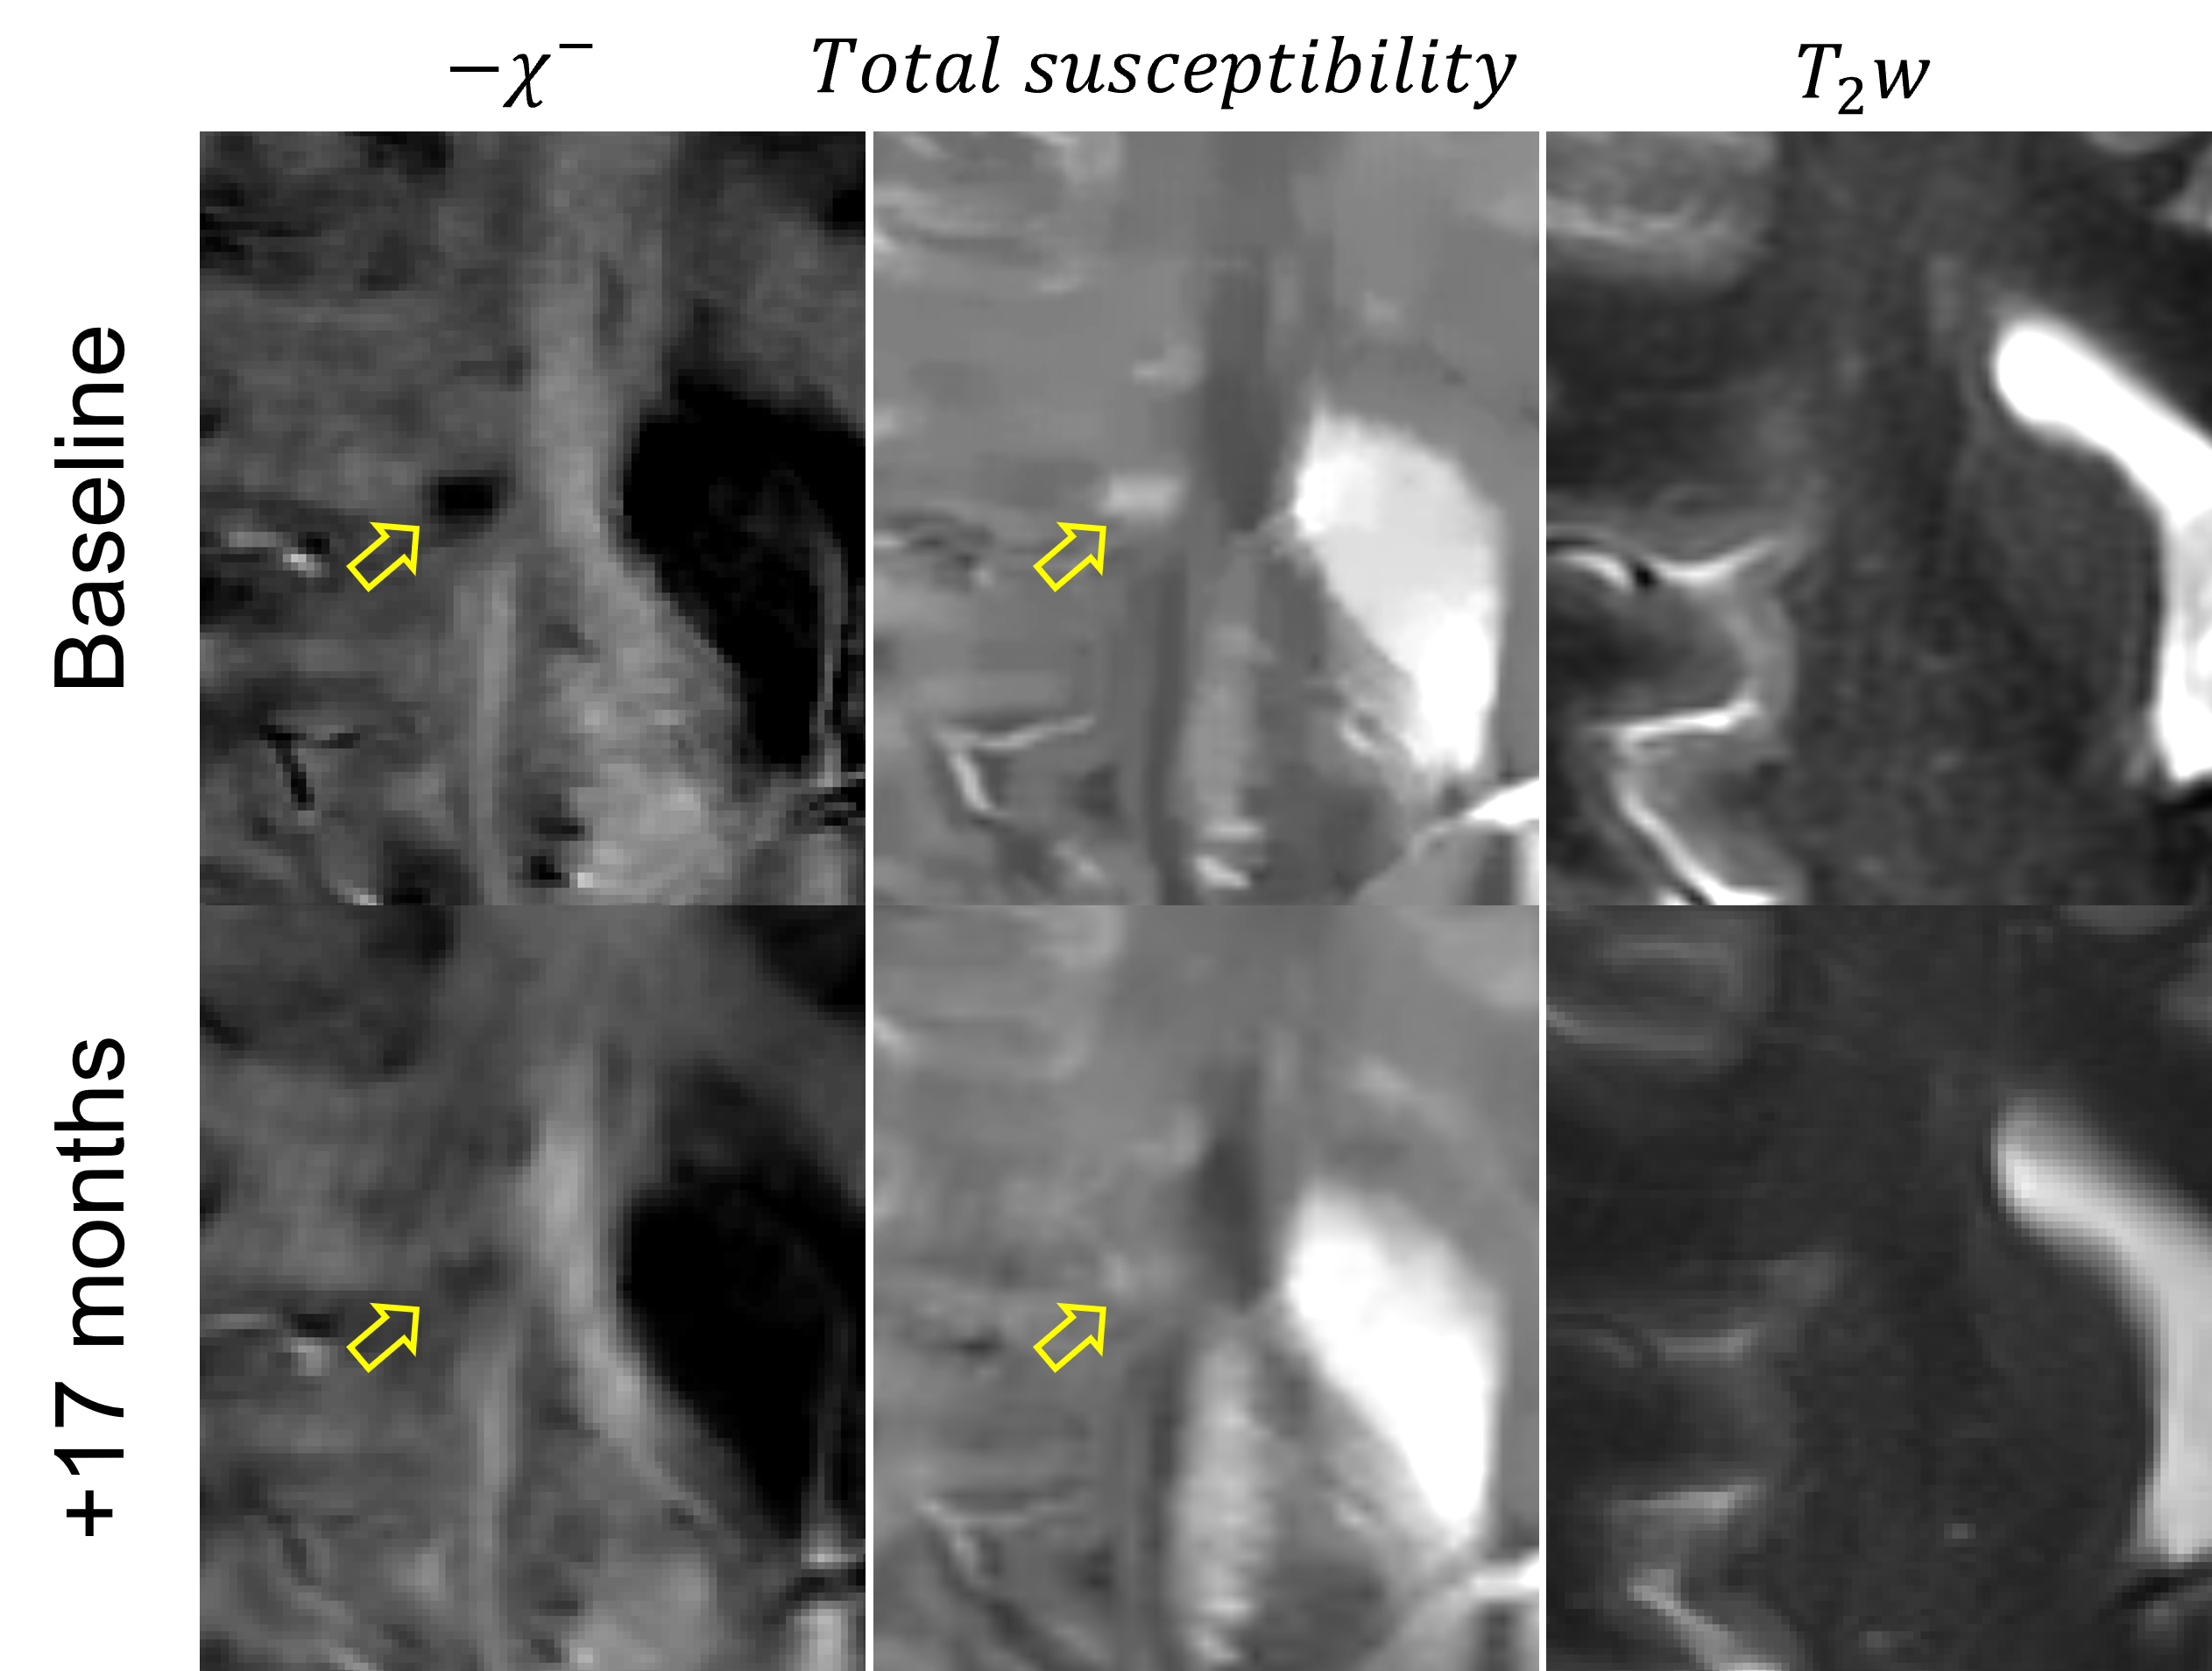
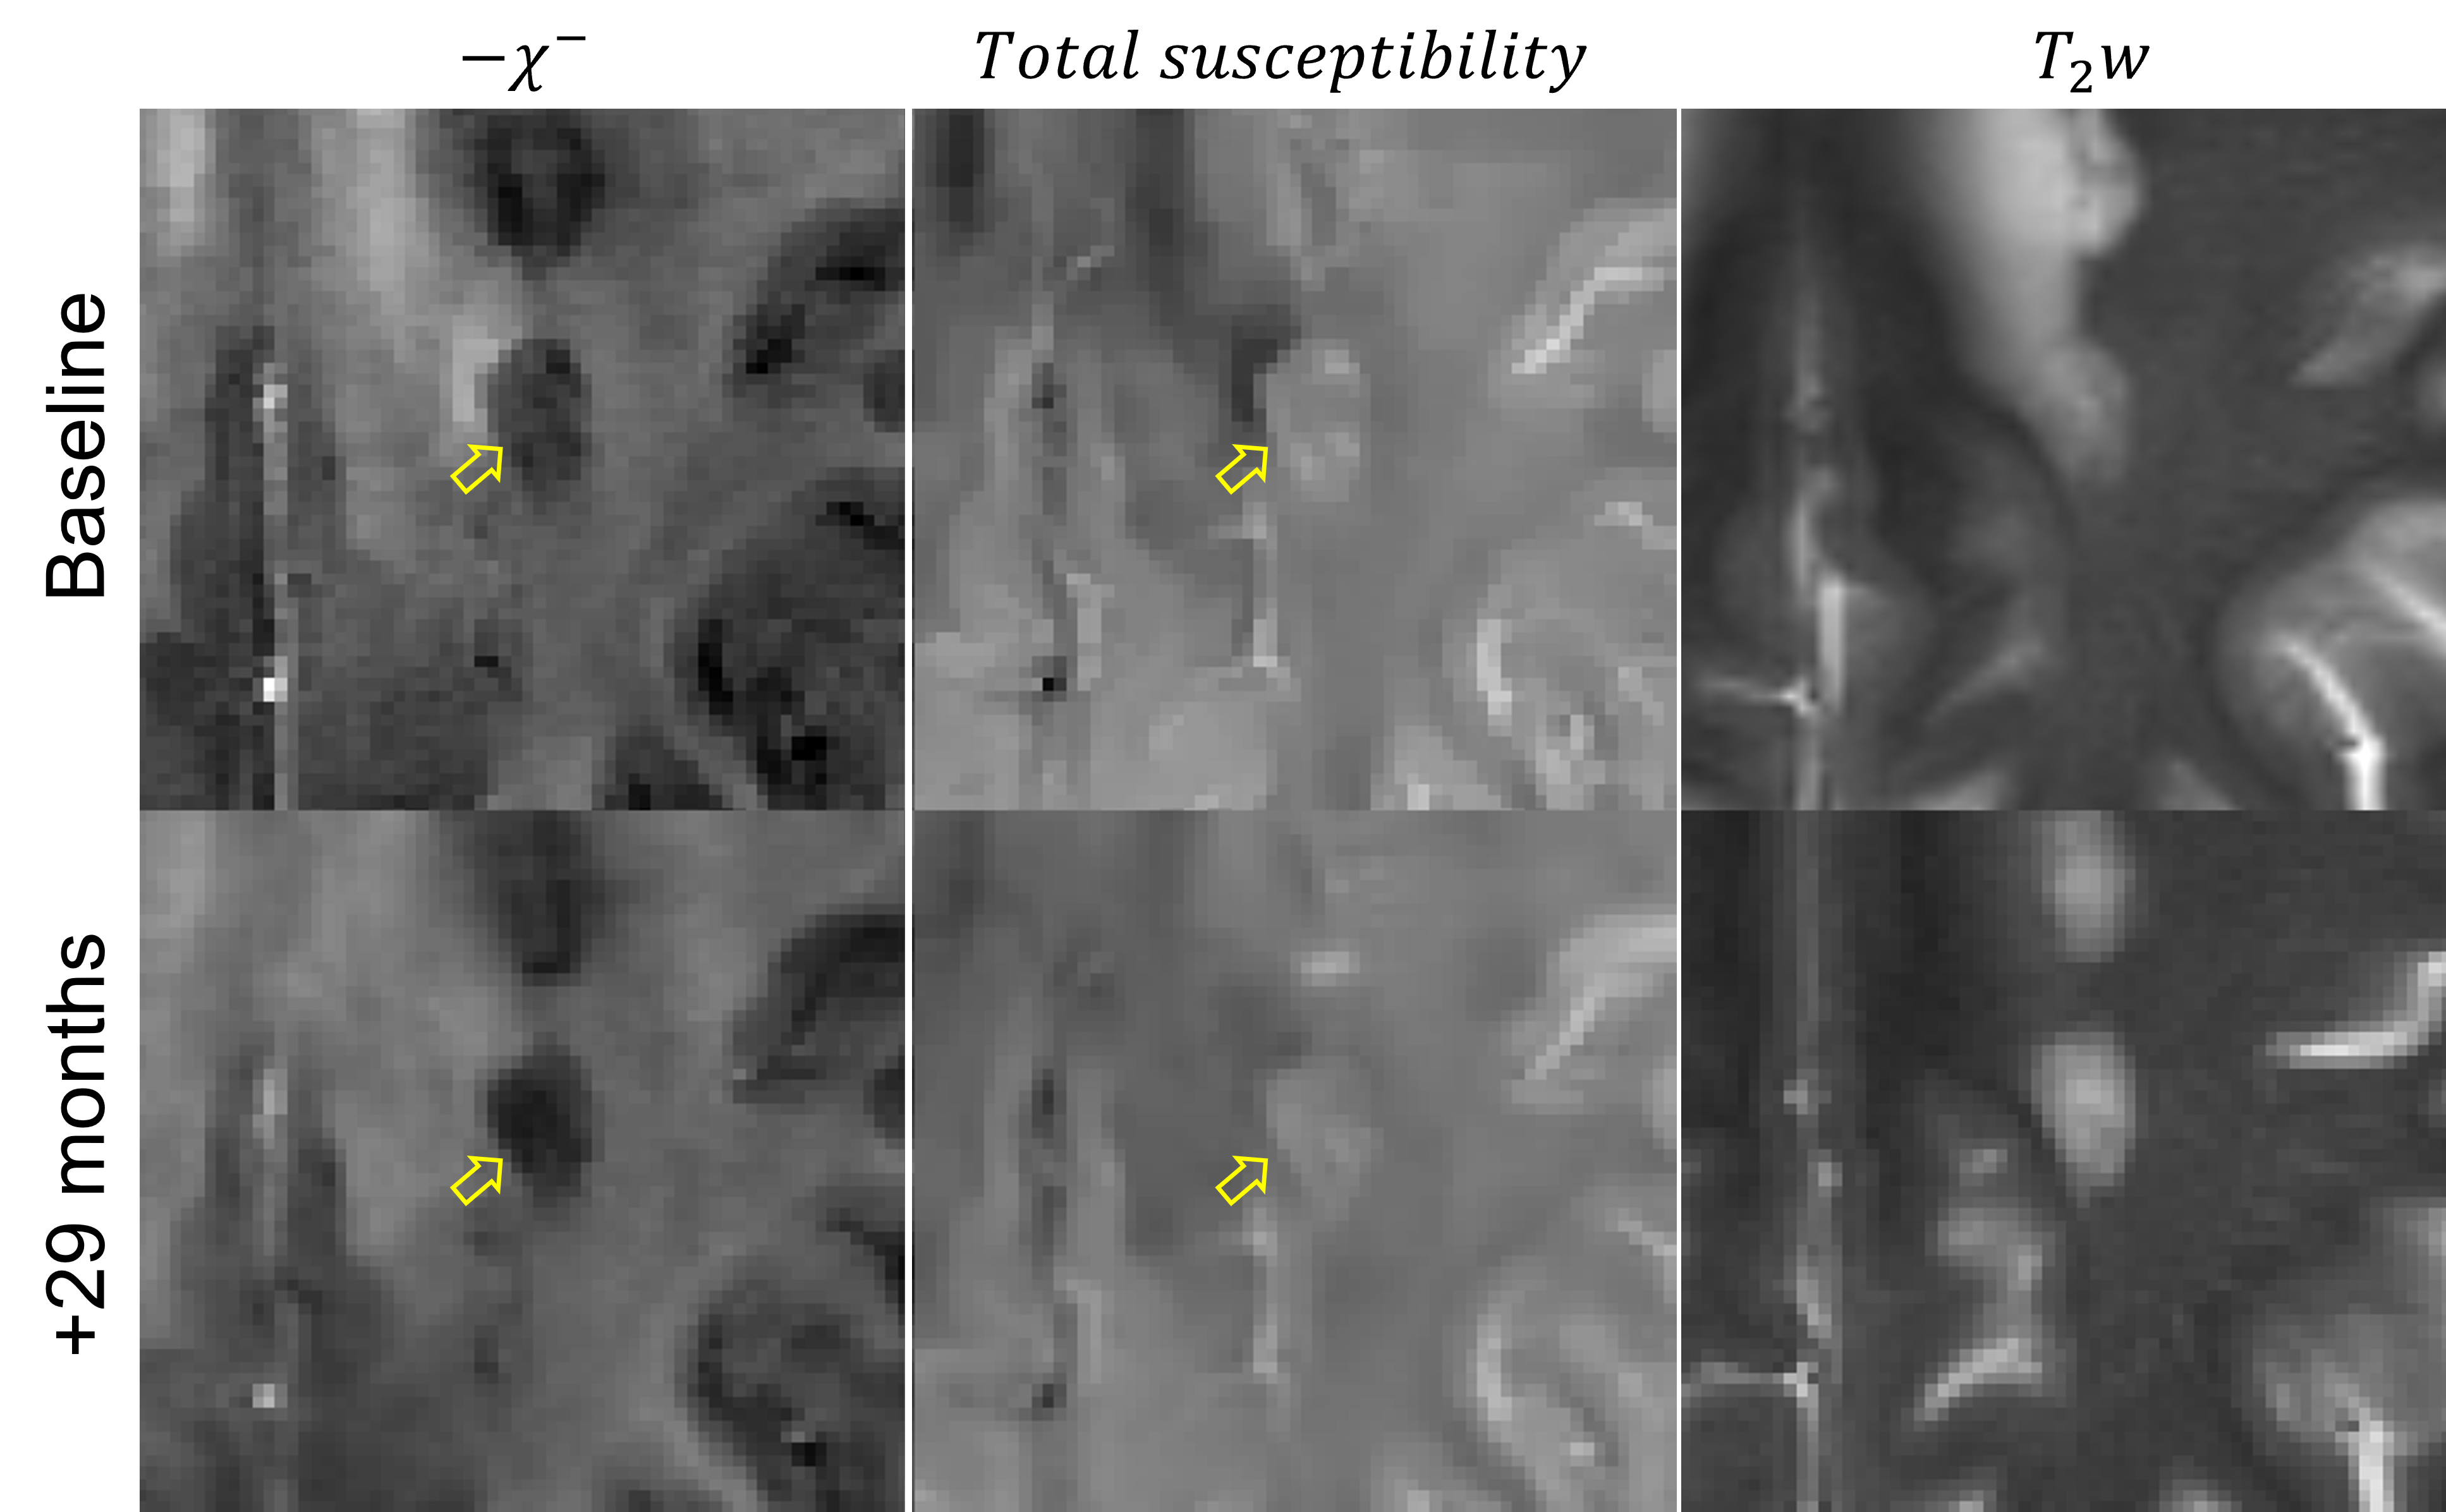
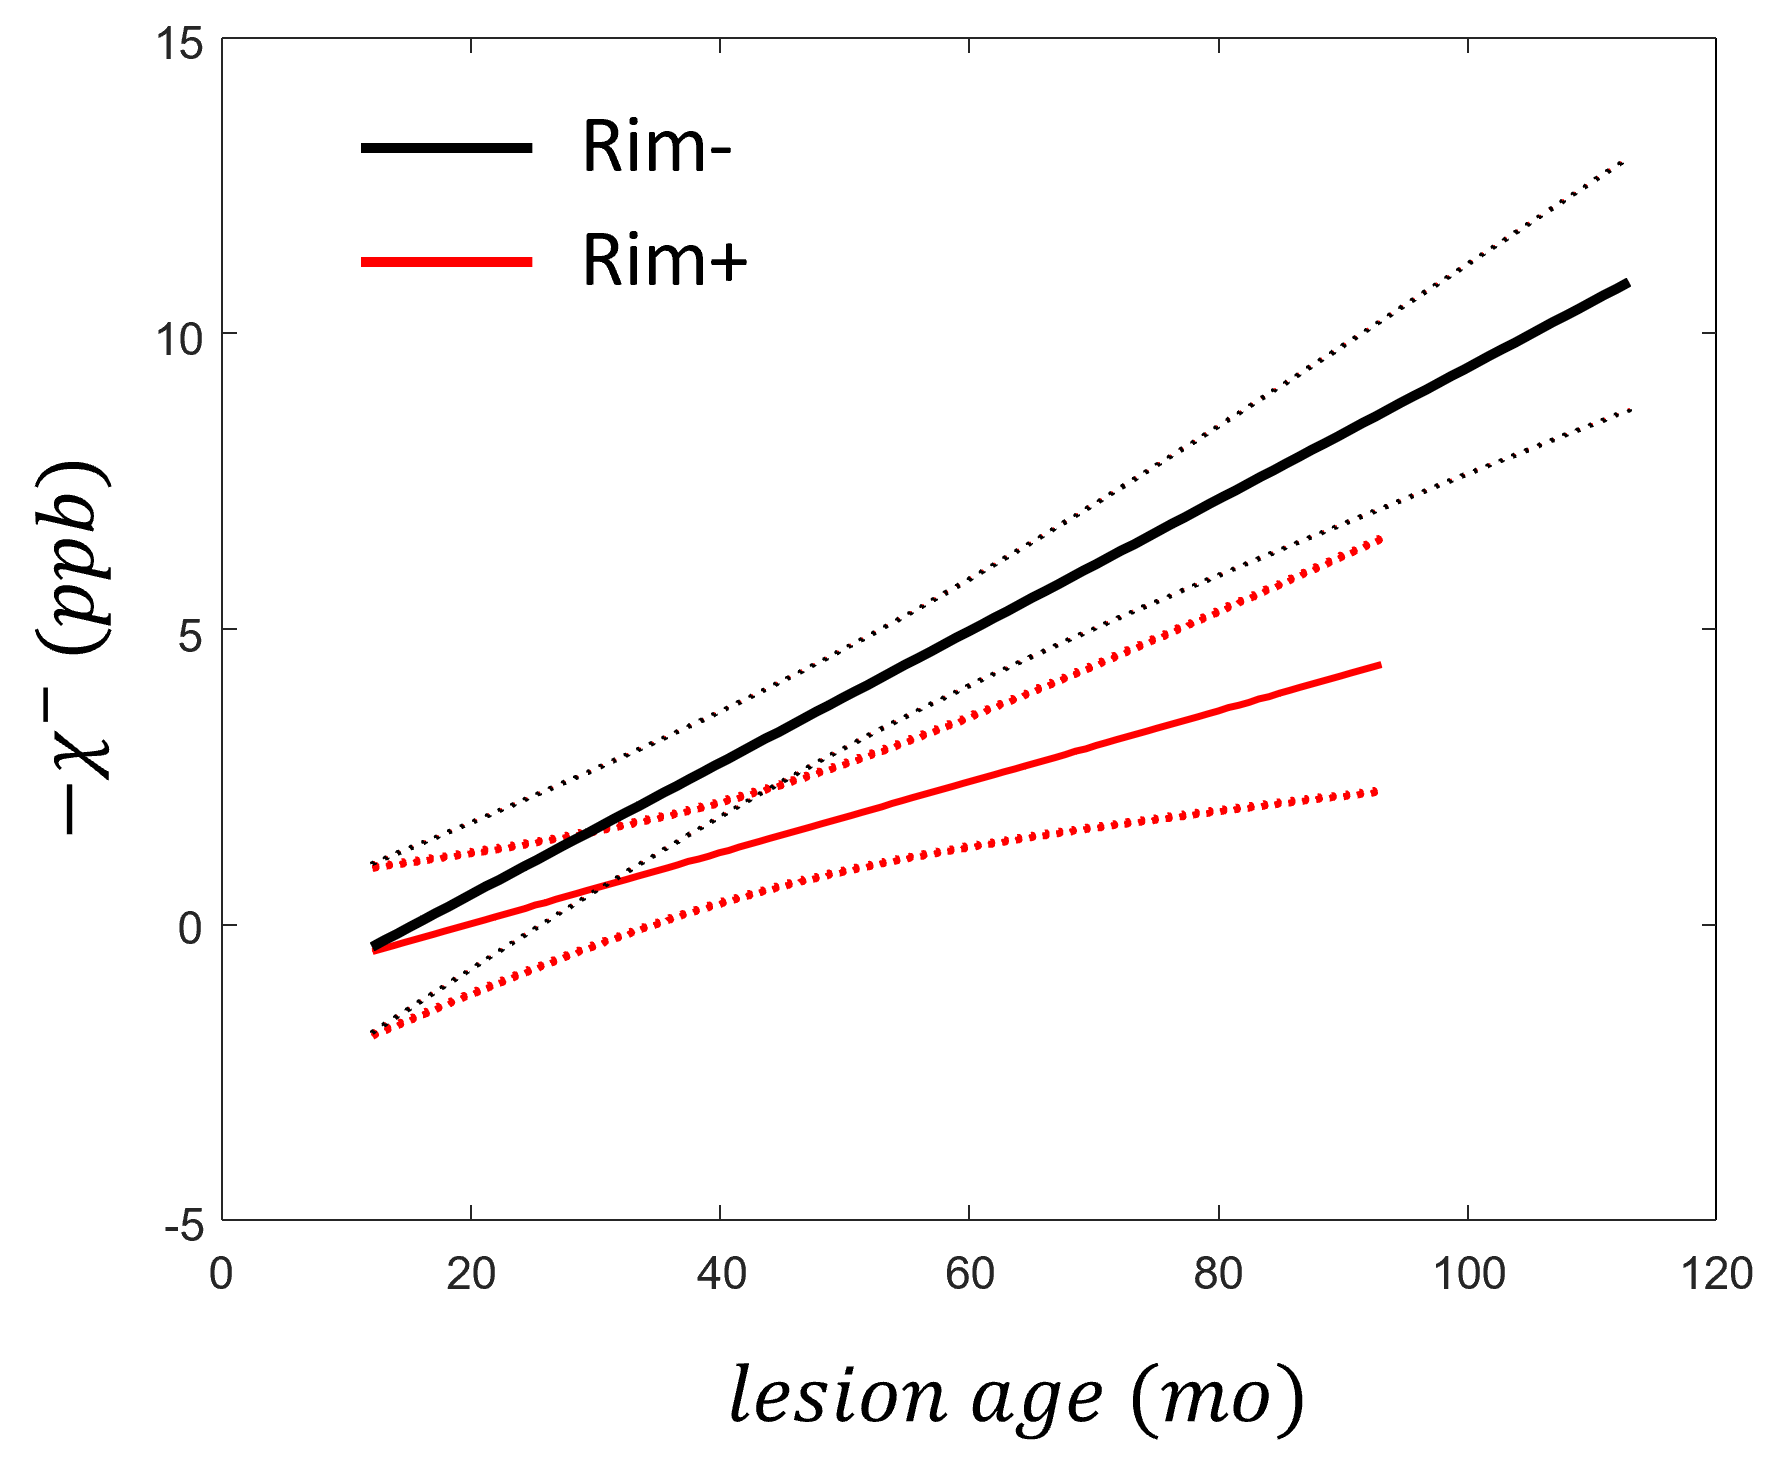
Longitudinal images of two representative lesions are shown in Figures 1 and 2.Longitudinal trajectories of rim+ and rim- lesions are shown in Figure 3. Compared to rim+ lesions, rim- lesions demonstrate higher degree of myelin recovery, above the typical QSM reproducibility limits. Linear mixed effects regression revealed statistically significant effect of the interaction term between the rim status and lesion age on myelin susceptibility $$$-\chi^-$$$, confirming difference in temporal trajectories between the rim+ and rim- lesions. Although rim+ lesions are not expected to have significant myelin recovery due to the ongoing inflammation, we have detected an increase in $$$-\chi^-$$$. Nevertheless, this effect may be due to imperfections of the intrasubject registrations of images acquired over many years. Further work is required (e.g., registration to a subject-specific template) to mediate effects of changes in brain geometry due to ongoing damage and aging.
Acknowledgements
No acknowledgement found.References
1. Langkammer, C., T. Liu, M. Khalil, C. Enzinger, M. Jehna, S. Fuchs, F. Fazekas, Y. Wang, and S. Ropele. "Quantitative Susceptibility Mapping in Multiple Sclerosis." Radiology 267, no. 2 (2013): 551-9.
2. Stuber, C., D. Pitt, and Y. Wang. "Iron in Multiple Sclerosis and Its Noninvasive Imaging with Quantitative Susceptibility Mapping." International Journal of Molecular Sciences 17, no. 1 (2016).
3. Wisnieff, C., S. Ramanan, J. Olesik, S. Gauthier, Y. Wang, and D. Pitt. "Quantitative Susceptibility Mapping (QSM) of White Matter Multiple Sclerosis Lesions: Interpreting Positive Susceptibility and the Presence of Iron." Magn Reson Med 74, no. 2 (2015): 564-70.
4. Zhang, S., T. D. Nguyen, S. M. Hurtado Rua, U. W. Kaunzner, S. Pandya, I. Kovanlikaya, P. Spincemaille, Y. Wang, and S. A. Gauthier. "Quantitative Susceptibility Mapping of Time-Dependent Susceptibility Changes in Multiple Sclerosis Lesions." AJNR Am J Neuroradiol 40, no. 6 (2019): 987-93.
5. Shin, H. G., J. Lee, Y. H. Yun, S. H. Yoo, J. Jang, S. H. Oh, Y. Nam, S. Jung, S. Kim, M. Fukunaga, W. Kim, H. J. Choi, and J. Lee. "Chi-Separation: Magnetic Susceptibility Source Separation toward Iron and Myelin Mapping in the Brain." Neuroimage 240 (2021): 118371.
6. Dimov, A. V., K. M. Gillen, T. D. Nguyen, J. Kang, R. Sharma, D. Pitt, S. A. Gauthier, and Y. Wang. "Magnetic Susceptibility Source Separation Solely from Gradient Echo Data: Histological Validation." Tomography 8, no. 3 (2022): 1544-51.
7. Dimov, A. V., T. D. Nguyen, K. M. Gillen, M. Marcille, P. Spincemaille, D. Pitt, S. A. Gauthier, and Y. Wang. "Susceptibility Source Separation from Gradient Echo Data Using Magnitude Decay Modeling." J Neuroimaging (2022).
8. Dimov, A. V., T. D. Nguyen, P. Spincemaille, E. M. Sweeney, N. Zinger, I. Kovanlikaya, B. H. Kopell, S. A. Gauthier, and Y. Wang. "Global Cerebrospinal Fluid as a Zero-Reference Regularization for Brain Quantitative Susceptibility Mapping." J Neuroimaging (2021).
9. Deh, K., T. D. Nguyen, S. Eskreis-Winkler, M. R. Prince, P. Spincemaille, S. Gauthier, I. Kovanlikaya, Y. Zhang, and Y. Wang. "Reproducibility of Quantitative Susceptibility Mapping in the Brain at Two Field Strengths from Two Vendors." J Magn Reson Imaging 42, no. 6 (2015): 1592-600.
Figures