3382
Clinical implementation of Multiplied, Added, Subtracted and/or Divided (MASDIR) sequences on white matter lesions in Multiple Sclerosis
Letizia Losa1, Denis Peruzzo1, Graeme Bydder2, Andrea Salmaggi3, and Nivedita Agarwal4
1CESNE, IRCCS E. Medea, Bosisio Parini, Italy, 2Department of Radiology, University of California, San Diego, San Diego, CA, United States, 3Neurology, Manzoni Hospital, Lecco, Lecco, Italy, 4Neuroradiology, IRCCS E. Medea, Bosisio Parini, Italy
1CESNE, IRCCS E. Medea, Bosisio Parini, Italy, 2Department of Radiology, University of California, San Diego, San Diego, CA, United States, 3Neurology, Manzoni Hospital, Lecco, Lecco, Italy, 4Neuroradiology, IRCCS E. Medea, Bosisio Parini, Italy
Synopsis
Keywords: Multiple Sclerosis, Quantitative Imaging, T1 mapping
Multiple Sclerosis (MS) is a demyelinating progressive chronic disease. MR imaging is a key diagnostic tool that allows long-term monitoring of disease progression. Since T1 values can identify clinically relevant tissue properties such as increased water content, myelin loss and changes in microstructure, we assessed the whole brain using Multiplied, Added, Subtracted and/or Divided Inversion Recovery (MASDIR) in patients with MS in an attempt to improve contrast and quantify T1 of lesions. We show that MASDIR is a clinically reliable, easy to implement technique that greatly increases T1 contrast and simultaneously provides quantitative T1 maps.Introduction
Multiple Sclerosis (MS) is a progressive disease characterized by demyelination and axonal loss. Magnetic Resonance Imaging (MRI) is an extremely valuable tool in the diagnosis and monitoring of the disease process. Most treatment strategies are also based on information gathered using MRI. Inversion Recovery (IR) sequences, such as Fluid Attenuated Inversion Recovery (FLAIR), have been in the forefront of clinical imaging of the brain. Variants such as Double Inversion Recovery (DIR) obtained by combining two or more IR images[1], have revolutionized clinical imaging of lesions in MS. Many histologic features of MS (e.g. demyelination, gliosis, neuronal loss, increase of fluid content) modify T1 relaxation times in lesions and in the normal appearing White Matter (WM) and Grey Matter (GM)[2]. Since Multiplied, Added, Subtracted and/or Divided Inversion Recovery (MASDIR) sequences[3] have the potential to increase T1 contrast and to produce quantitative T1 maps, we applied them in the study of patients with MS.Methods
Data were acquired on 3 female subjects with relapsing remitting MS (from 24 to 50 yrs) using a Philips 3T scanner and a 32 channel head coil. In addition to standard clinical acquisitions (3D T1w, 3D T2w, 3D FLAIR, DWI), six whole brain Inversion Recovery Fast Spin Echo (IR-FSE) sequences (TR/TE=3500/10-200 ms; voxel size= 0.7x0.89 mm, slice thickness 5 mm) were acquired with increasing inversion times (TI = 450, 550, 750, 950 ms). divided Substracted Inversion Recovery (dSIR: one of the MASDIR sequences) images were derived using the following equation: $$dSIR=\frac{IRTI_{short}-IRTI_{long}}{IRTI_{short}+IRTI_{long}}$$ where TIshort and TIlong are the two TIs that define the middle Domain (mD), i.e. the range of T1 values of interest ($$$TI_{long/short}=TI_{max/min}\cdot ln(2)$$$). We also calculated a T1 map using dSIR (T1dSIR) by linearising the relationship between the dSIR signal (SdSIR) and T1 values within the mD: $$T1=\frac{TI_{long}-TI_{short}}{\ln(4)}\cdot S_{dSIR} + \frac{TI_{long}+TI_{short}}{\ln(4)}$$ An experienced neuroradiologist identified specific regions of interest (ROI) around WM lesions to calculate T1 values comparing them to Normal Apperaring White Matter (NAWM). Finally, by changing the mD to include all the GM, we calculated T1 values in FreeSurfer segmented cortical regions.Results
dSIR images obtained using a mD of 450-750 ms (wide domain) show more lesions in the WM compared to conventional T2w image (Fig.1 A,B). By changing the mD to 450-550 ms (narrow domain), an even higher contrast is observed between lesions with subtle differences in T1 values (Fig. 1C).The T1 value of the total WM (excluding WM lesions) quantified using T1dSIR was 649±67 ms (T1 of healthy controls=680±65 ms) and the T1 value of the total GM was 977±96 ms (T1 of healthy controls=960±106 ms). The T1 values of ROIs obtained from dSIR (mD: 450-750) are plotted in Fig. 2 (average T1=948±53 ms). We also plotted all FreeSurfer segmented cortical areas by setting the mD that included all the GM (i.e. mD=450-950 ms) as can be seen in Fig. 3.
Discussion
dSIR is a robust method for quickly identifying the true extent of diseased tissue in the brain with respect to the more conventional T2 and FLAIR images. dSIR also allowed a quick calculation of T1 values of WM lesions with the potential to identify the ones progressing into T1 black holes. T1 quantification can be made even to evaluate normal appearing areas of the brain (e.g. cortical regions) and monitor the obtained values over time. An increase of T1 may represent a marker of increased interstitial fluid and/or initial demyelinating process in an early phase of plaque formation.Several observations can be made. First, the number of patients and the number of ROIs must be increased to improve the strength of our results. Second, our spatial resolution in the z-direction is not optimal and poses a substantial limit since partial volume averaging will affect T1 quantification of lesions. However, we believe that by improving spatial resolution our results will be confirmed and smaller lesions can be examined. Based on these preliminary results, we envision that this method can be used to visualize the true extent of the disease, to monitor disease progression, to predict the nature of the lesions (active vs chronic) and observe the effect of treatment.Acknowledgements
We thank John D. Port for interpretation of our images.References
[1] Wattjes, M. P., et al. "Double inversion recovery brain imaging at 3T: diagnostic value in the detection of multiple sclerosis lesions." American journal of neuroradiology 28.1 (2007): 54-59.
[2] Neema, Mohit, et al. "T1‐and T2‐based MRI measures of diffuse gray matter and white matter damage in patients with multiple sclerosis." Journal of Neuroimaging 17 (2007): 16S-21S.
[3] Ma, Ya-Jun, et al. "Use of Multiplied, Added, Subtracted and/or FiTted Inversion Recovery (MASTIR) pulse sequences." Quantitative Imaging in Medicine and Surgery 10.6 (2020): 1334.
Figures
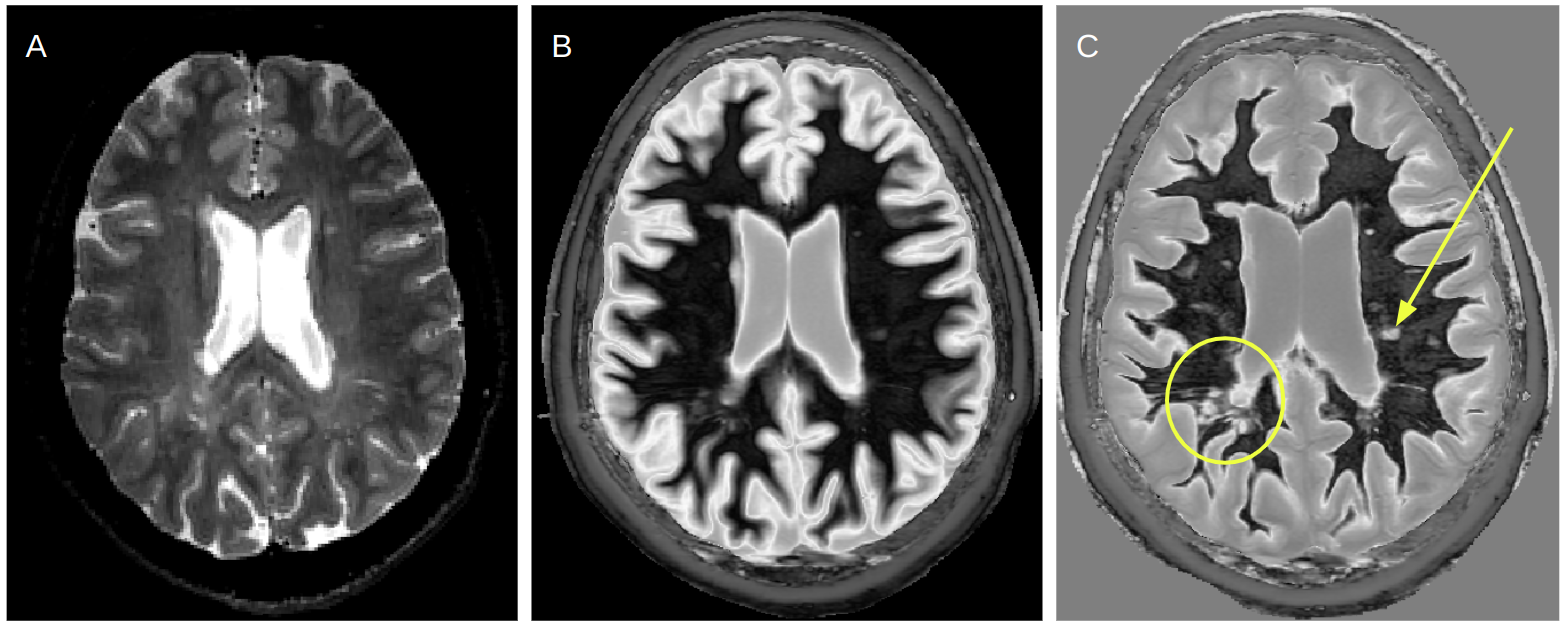
Figure 1: Comparison of A) conventional T2w image with B) dSIR image wide mD (TI: 450-750 ms) and C) dSIR image narrow mD (TI: 450-550 ms) in a patient with MS. A focal lesion (yellow arrow) and other abnormalities in the periventricular region (yellow circle) not readily observed on the T2w image, show up as very high contrast on dSIR narrow mD image.
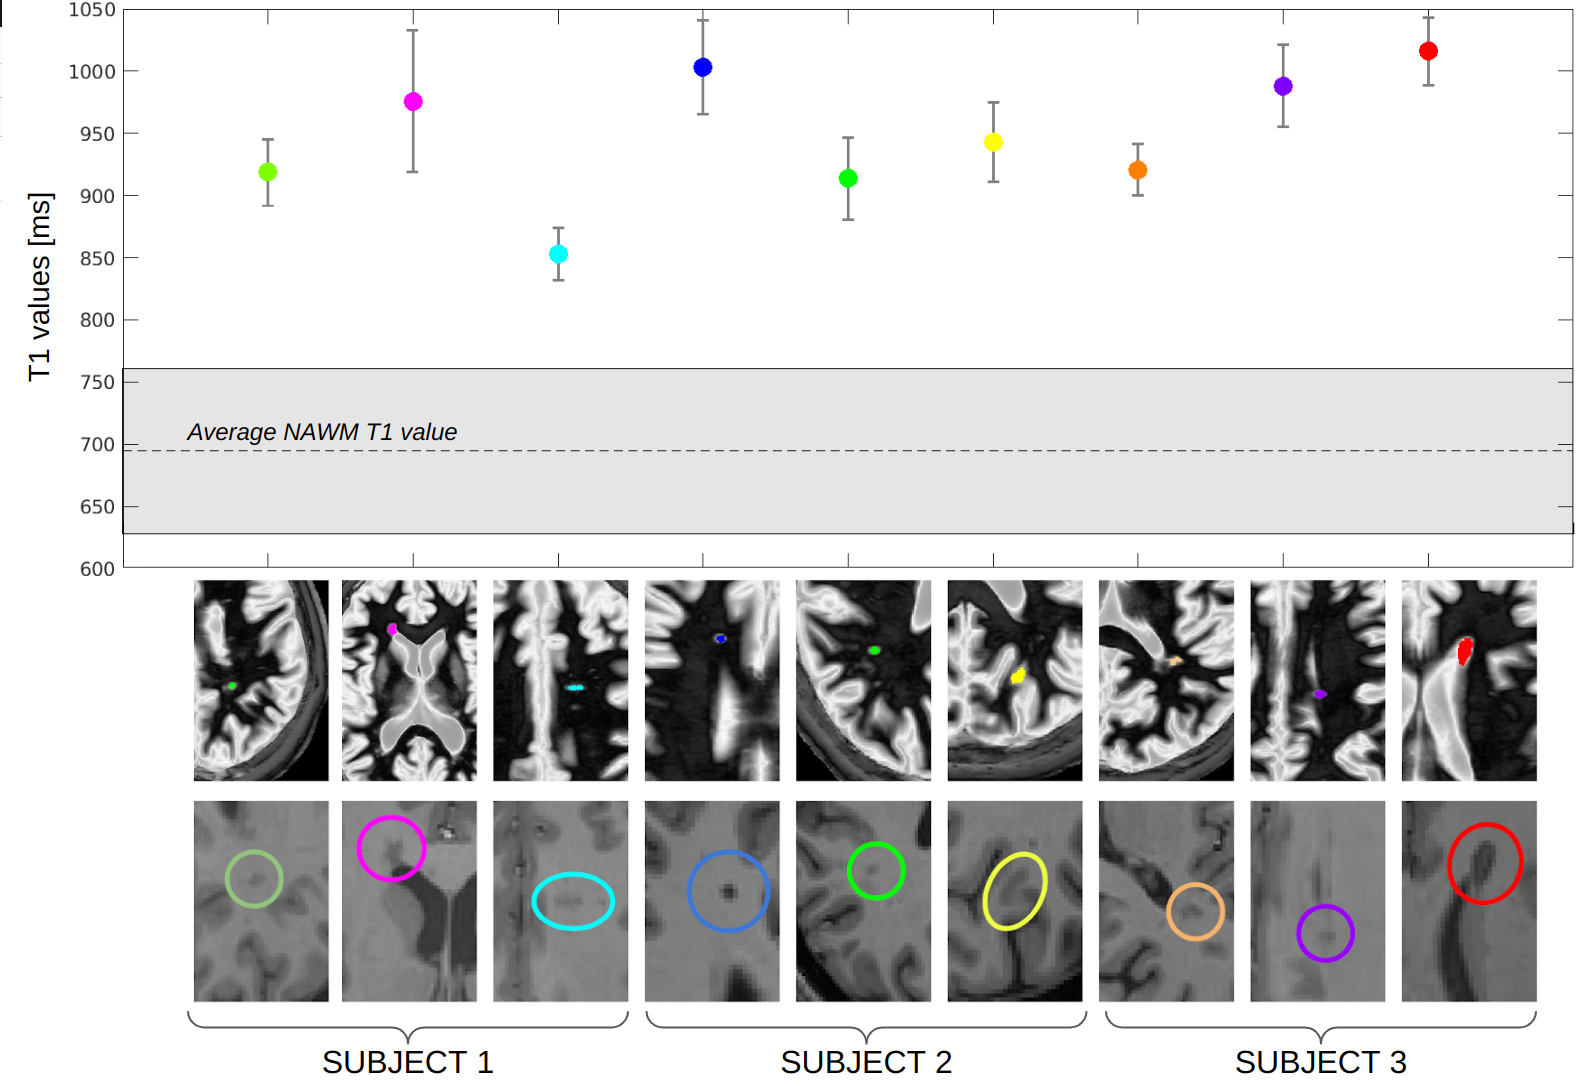
Figure 2: T1 values plot from nine identified ROIs around lesions in three patients with MS derived from dSIR (first row) and T1w (second row) images. Average T1 values obtained from dSIR (mD: 450-750 ms, corresponding T1 values of 649-1082 ms) are all in a narrow range of values (948±53 ms). Some lesions that appear more hypointense on the T1w image (blue and red ROIs, so called “black holes”) seem to have higher T1 values suggesting a different lesion composition. Partial volume averaging artifacts cannot be excluded (e.g. for pink and purple ROIs near ventricles and CSF).
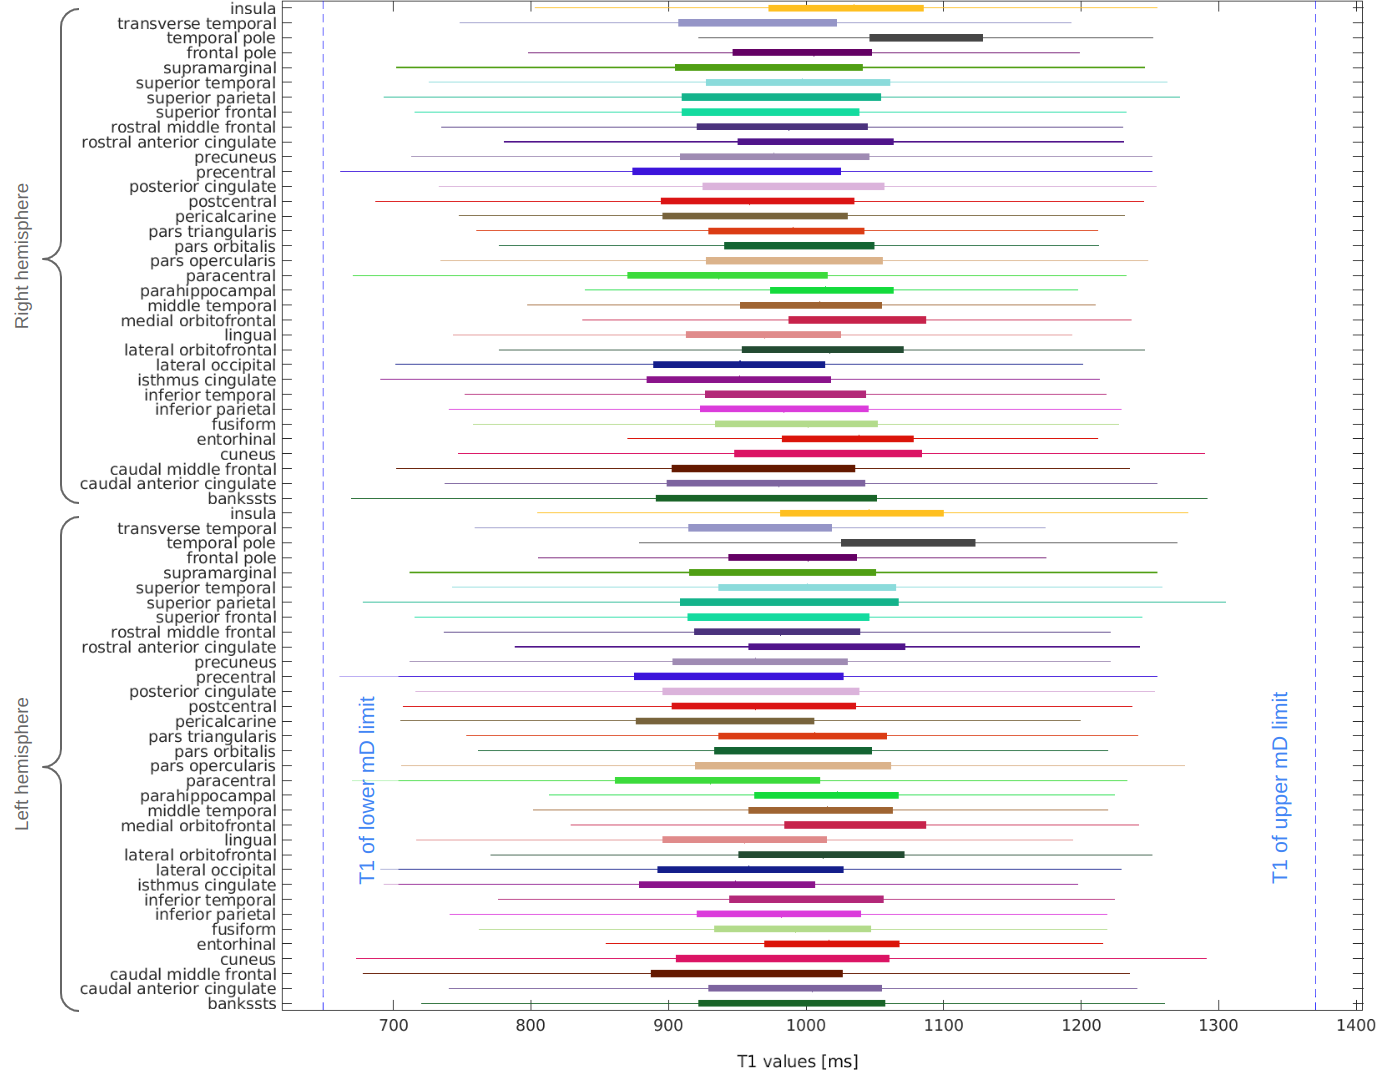
Figure 3: Range of T1 values obtained from dSIR for different cortical brain areas segmented by using FreeSurfer segmentation tool. The mD (TI: 450-950 ms corresponds to T1 values of 649-1371 ms and is shown with blue dotted lines) is chosen to include all the T1 values characterizing the GM.
DOI: https://doi.org/10.58530/2023/3382