3381
Machine learning based prediction of clinical progression in multiple sclerosis1MS Center Amsterdam, Anatomy and Neurosciences, Vrije Universiteit Amsterdam, Amsterdam Neuroscience, Amsterdam UMC location VUmc, Amsterdam, Netherlands, 2Department of Psychiatry and Neurosciences, Charité – Universitätsmedizin Berlin, corporate member of Freie Universität Berlin and Humboldt-Universität zu Berlin, Berlin, Germany, 3MS Center Amsterdam, Neurology, Vrije Universiteit Amsterdam, Amsterdam Neuroscience, Amsterdam UMC location VUmc, Amsterdam, Netherlands
Synopsis
Keywords: Multiple Sclerosis, Brain
Machine learning may aid in individualized prediction of disease progression in multiple sclerosis (MS). In this study, we used data from 354 patients with MS to evaluate the capability of different machine learning approaches at predicting future disease worsening. Multiple clinical end points of disease worsening were tested and different combinations of clinical and structural MRI measures were used as inputs. Machine learning models were capable of discriminating between patients with low and high disability but did not perform well in predicting future disease course.
Introduction
Multiple sclerosis (MS) is a chronic inflammatory and neurodegenerative disease with large heterogeneity in clinical presentation1. Identification of patients at risk of developing worse disease outcomes is of vital importance for treatment decisions and to prevent accumulating disability2. MRI plays a crucial role in diagnosis and monitoring of the disease, but accurate prognosis at the patient level remains an unsolved problem.Disability progression using the Expanded Disability Status Scale (EDSS) is the most common clinical end point in clinical trials and machine learning (ML) studies. Recent evidence suggests other outcome measures, such as the timed 25-foot walk test (T25FW) and EDSS+, to be more sensitive in capturing disease progression6, 7. In addition, regional MRI measures such as thalamic volumes, have shown stronger associations with disability progression compared to whole brain measures or lesion volumes8. However, the use of detailed regional MRI volumes and cortical thickness as predictors of disease progression has not been extensively tested.
ML approaches have been increasingly applied recently in MS studies to aid in the prediction of disease progression3-5. In this study, we used different ML approaches to predict disability status and disease progression in MS based on baseline clinical and regional structural MRI features. Prediction performance was systematically compared for different outcome measures of motor function and cognition.
Methods
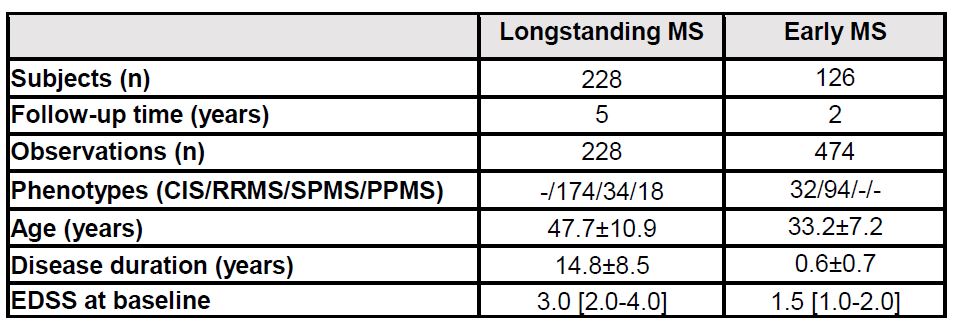
For 354 MS patients, cross-sectional 3T T1-weighted and FLAIR-weighted scans were retrospectively collected from two centers (Amsterdam: 228 longstanding MS, Berlin: 126 early MS) with a clinical follow-up of 5 and 2 years, respectively. Clinical and cognitive assessments included EDSS, Nine-Hole Peg Test (HPT), Timed 25 Foot Walk (T25FW), Symbol Digit Modalities Test (SDMT) and an expanded Brief Repeatable Battery of Neuropsychological Tests (BRB-N). Structural brain MRI features were extracted from the lesion-filled T1-weighted images with FreeSurfer and the Brainnetome (BNA) atlas was used to derive volume and thickness of 210 gray matter regions. Feature sets to predict clinical progression included 1) clinical data only (sex, age, symptom duration,MS phenotype, treatment, EDSS at baseline, education) 2) global MRI volumes (whole brain, cortex, deep gray matter, lesions) 3) BNA volumes 4) BNA thicknesses 5) all available MRI features and 6) the combination of clinical and all available MRI features. Prediction of disability status at baseline and progression for the different clinical outcomes was performed using five ML models: logistic regression (LogReg), Support Vector Machine with a linear kernel (SVM-lin), a radial basis function kernel (SVM-rbf), Gradient Boosting Classifier (XGB) and Random Forest (RandFor). Five-fold cross-validation was used to optimize model parameters in data from each center and performance was calculated 10 times by randomly sampling the test data. Model performance was measured using receiver operating characteristic area under the curve (AUC), balanced accuracy (BA), precision and recall scores. To test statistical significance of ML models, permutation testing was performed by repeating the whole experiment 100 times with randomly shuffled labels of the training data.
Results
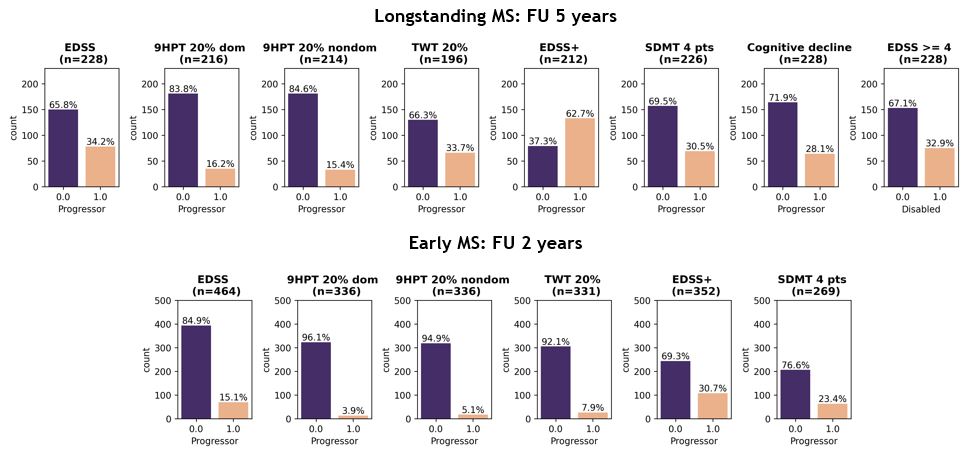
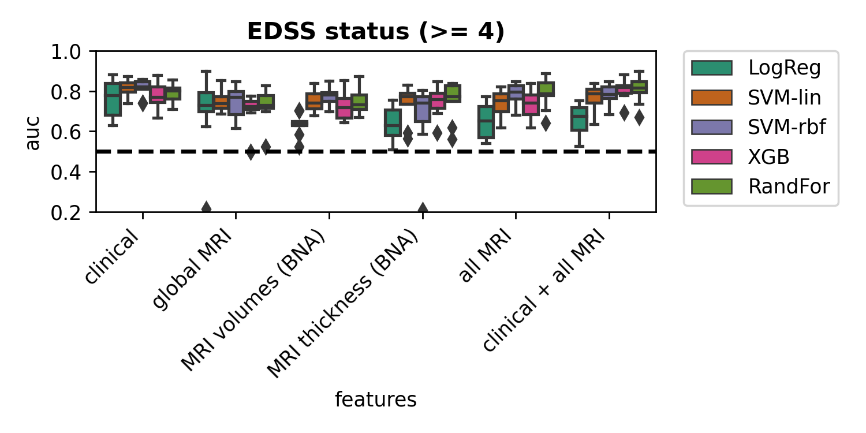
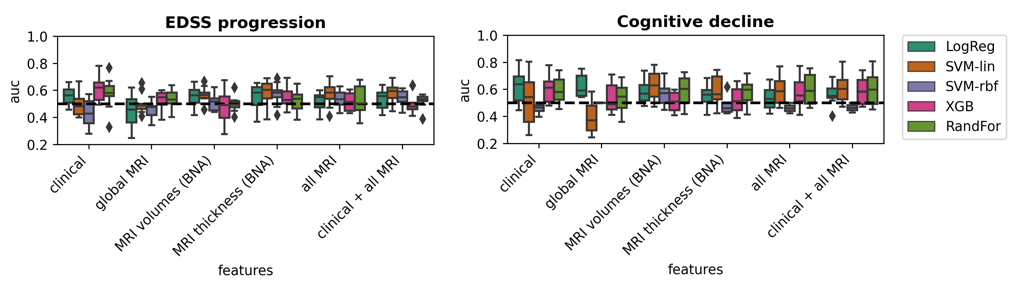
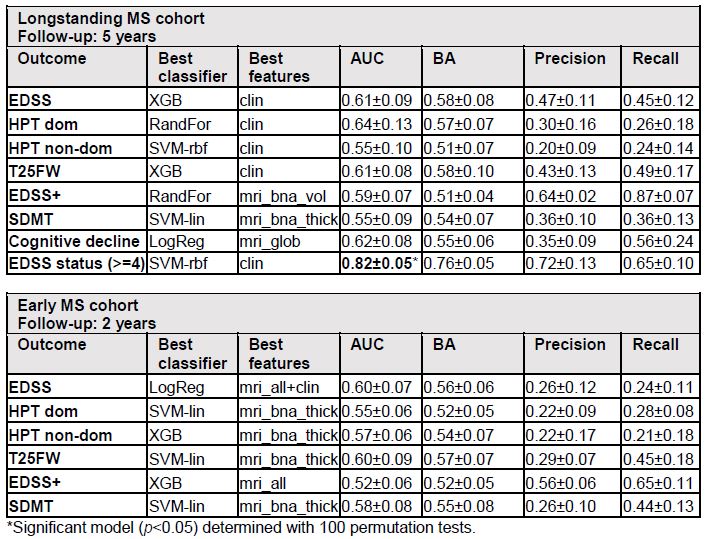
Demographic and clinical variables of the used MS cohorts are presented in Table 1. Figure 1 shows percentages of patients progressing on the various clinical outcome measures. Having a high disability at baseline was best predicted by clinical features (AUC=0.82±0.05) using SVM-rbf, with comparable performances with MRI features as inputs (Figure 2). For EDSS progression over 5 years in longstanding MS, highest performance (AUC=0.61±0.09), was found using XBG with clinical data only (Figure 3) and for the early MS cohort, highest performance (AUC=0.60±0.07) was obtained by LogReg on all MRI features and clinical data combined (Table 2). For prediction of cognitive decline based on the BRB-N, best performance (AUC=0.62±0.08) was obtained with LogReg on MRI global volumes. Performance for predicting other measures of clinical worsening was generally poor in both cohorts, with mean AUC varying from 0.52 to 0.64. Predicting high disability at baseline was the only task in which the ML model was significant (p=0.014), the other prediction tasks did not reach significance (Table 2).Discussion
In MS patients, baseline disability status can be identified with high accuracy using various ML techniques based on both clinical and MRI input features. However, predicting disease progression in MS over a follow-up of two or five years based on baseline clinical and structural MRI features is a more difficult task with relatively low performance, which has also been found in previous larger cohort studies3, 9 In this study, we explored a wide variety of additional clinical endpoints such as hand dysfunction, walking dysfunction, cognitive impairment and used more detailed regional MRI features, but we did not observe an improvement in model performance. Although some previous ML studies showed more promising results in predicting MS disease progression, these results were limited by relying on relatively small sample sizes which are hard to generalize to other cohorts5, 10. Developing models on large-scale data with longer clinical follow up times to capture progression would probably increase performance.Conclusion
We conclude that accurate prediction of MS disease course is still an unmet need. Better clinical phenotyping and using larger datasets representative of the heterogeneity in MS can be a promising direction for future ML research for MS.Acknowledgements
No acknowledgement found.References
1. Confavreux C, Vukusic S. The clinical course of multiple sclerosis. Handbook of clinical neurology 2014;122:343-369.
2. Gajofatto A, Benedetti MD. Treatment strategies for multiple sclerosis: when to start, when to change, when to stop? World Journal of Clinical Cases: WJCC 2015;3:545.
3. Zhao Y, Healy BC, Rotstein D, et al. Exploration of machine learning techniques in predicting multiple sclerosis disease course. PloS one 2017;12:e0174866.
4. Law MT, Traboulsee AL, Li DK, et al. Machine learning in secondary progressive multiple sclerosis: an improved predictive model for short-term disability progression. Multiple Sclerosis Journal–Experimental, Translational and Clinical 2019;5:2055217319885983.
5. Pinto MF, Oliveira H, Batista S, et al. Prediction of disease progression and outcomes in multiple sclerosis with machine learning. Scientific reports 2020;10:1-13.
6. Cadavid D, Cohen JA, Freedman MS, et al. The EDSS-Plus, an improved endpoint for disability progression in secondary progressive multiple sclerosis. Multiple Sclerosis Journal 2017;23:94-105.
7. Koch MW, Mostert J, Repovic P, et al. The timed 25-foot walk is a more sensitive outcome measure than the EDSS for PPMS trials: an analysis of the PROMISE clinical trial dataset. Journal of Neurology 2022:1-9.
8. Eshaghi A, Prados F, Brownlee WJ, et al. Deep gray matter volume loss drives disability worsening in multiple sclerosis. Annals of neurology 2018;83:210-222.
9. Pellegrini F, Copetti M, Sormani MP, et al. Predicting disability progression in multiple sclerosis: Insights from advanced statistical modeling. Multiple Sclerosis Journal 2020;26:1828-1836.
10. Tommasin S, Cocozza S, Taloni A, et al. Machine learning classifier to identify clinical and radiological features relevant to disability progression in multiple sclerosis. Journal of neurology 2021;268:4834-4845.
Figures