3379
Hyperperfusion precedes demyelination in Multiple Sclerosis lesion formation : a multimodal MRI and [11C]-PiB PET study1Institut du Cerveau (ICM) = Paris Brain Institute - Sorbonne Université, Paris, France, 2Sapienza University of Rome, Rome, Italy, 3Paris Brain Institute - Sorbonne Université - INRIA, Paris, France, 4Centre Hospitalier Frédéric Joliot - CEA, Orsay, France, 5Paris Brain Institute - Sorbonne Université, Paris, France, 6Paris Brain Institute - Sorbonne Université - Hôpital Pitié Salpêtrière APHP, Paris, France, 7Centre Hospitalier Frédéric Joliot - CEA - Université Paris Saclay, Orsay, France, 8Paris Brain Institute - Sorbonne Université - CNRS - INSERM - Hôpital Saint Antoine APHP, Paris, France
Synopsis
Keywords: Multiple Sclerosis, PET/MR, Prelesions, lesion formation
Studying prelesions, the healthy areas preceding lesion appearance, helps to understand the Multiple Sclerosis (MS) lesion formation process. We study here prelesions in a longitudinal cohort of 19 MS patients combining MRI with Positron Emission Tomography (PET). MRI allowed to identify prelesions, whereas [11C]-PiB PET allowed to quantify myelin content as well as perfusion. We found that the 69 analyzable prelesions of our cohort were heterogeneous regarding perfusion: 24.6% were hyperperfused and 18.8% hypoperfused. Hypoperfused prelesions showed multimodal evidence of demyelination whereas hyperperfused prelesions were not demyelinated yet, suggesting that hyperperfusion precedes demyelination in the MS lesion formation process.Introduction
Multiple Sclerosis (MS) a chronic inflammatory disease of the central nervous system, characterized by demyelinated lesions visible on Magnetic Resonance Imaging (MRI) as T2 hyperintensities (1). The sequence of events leading to the initiation of those demyelinated lesions formation remains poorly understood, and can be investigated through the radiological study of prelesions. In radiological follow-up, prelesions are healthy areas preceding the appearance of the lesion (2). To study the mechanisms of MS lesions formation, we have combined MRI with Positron Emission Tomography (PET) in a longitudinal study among 19 patients with MS. MRI allowed to identify prelesions and to characterize their microstructure, whereas [11C]-PiB PET allowed to quantify myelin content (5) as well as Cerebral Blood Flow (CBF) assessed by the R1 parameter extracted from the Simplified Referenced Tissue Model 2 (SRTM2) (3-4).Methods
- We took advantage of the cohort described in (5), with 19 persons with active relapsing–remitting MS (pwMS) and 8 age-and sex-matched Healthy Controls (HC), who underwent a longitudinal [11C]PiB-PET and MRI protocol with one acquisition at baseline and another after 72.7 ± 27.9 days.
- T1, T2, FLAIR, FA, MD, RD, AD, and Magnetization Transfer Ratio (MTR), were obtained from 3T MRI as described in (5). We normalized T1 and T2 (6) and computed T1/T2 ratio (7).
- [11C]-PiB PET was acquired on HRRT and reconstructed as described in (8). We extracted distribution volume ratio (DVR) and demyelination maps (used to compute demyelinated voxel density) for pwMS compared to HC using the methods described in (5). We applied the SRTM2 to native images to extract the R1 parameter that estimates the CBF, according to (3-4).
- Lesions were manually segmented on T2 with respect to FLAIR. White Matter (WM) was segmented using FreeSurfer5.3 after a lesion filling procedure. Normal Appearing WM (NAWM) was defined as the supratentorial WM after taking off the T2 lesions from the first visit, and a 2mm erosion to decrease partial volume effect.
- Prelesions were defined as non lesional areas on first visit in which a new lesion appeared at the second visit. We manually segmented them on the second visit T2 in a half way space between the two visits obtained by rigid registration, and multiplied them by the NAWM. To study their characteristics, as NAWM perfusion of pwMS is spatially heterogeneous (9), for each prelesion we defined a controlateral reference region in the NAWM that we called the mirror. This mirror was the controlateral symetric of the prelesion, after multiplication by the NAWM without prelesions, and successive dilatations until it reached at least the volume of its matched prelesion as shown in Figure 1.
- All MRI sequences and PET derived metrics for myelin and perfusion, as well as previously defined Regions of Interest (ROIs) were non linearly registered to the MNI152 atlas to allow intersubject comparison. We also created an HC perfusion atlas in MNI152 space by averaging all HC R1 value for each voxel.
- For each prelesion, to assess its perfusion status, we compared the observed relative difference in R1 between the prelesion and mirror couple to a theoretical value. This theoretical value was the R1 interhemispheric variability for the volume of the ROI described by (4). If the observed R1 relative difference was smaller on absolute value than the expected controlateral variability for this volume, we defined this prelesion as isoperfused. Otherwise, if the relative difference was positive it was hyperperfused compared to its matched mirror and if it was negative it was hypoperfused.
- Statistical tests were paired between prelesions and their matched mirrors (paired T-test at the whole cohort level, and wilcoxon rank sum test in perfusion subgroups in which normality couldn't be verified), alpha was set to 0.05, divided by two for unilateral tests, and corrected for multiple comparisons.
Results
- We identified 69 analyzable prelesions on 17 subjects of our cohort. At the global level, we found significant differences in MRI signal between prelesions and mirrors (lower T1, higher T2, lower T1/T2 ratio and lower MTR) but no differences in PET assessed myelin content nor perfusion (Figure 4).
- Prelesions were heterogeneous regarding their perfusion : 56.5% were isoperfused compared to their mirrors, 18.8% hypoperfused and 24.6% hyperperfused. This heterogeneity was not explained by size, distance to lateral ventricles (Figure 2) nor anatomical physiological regional differences of perfusion due to their position (Figure 3).
- Those different groups of perfusion corresponded to different stages of demyelination. Hyperperfused prelesions displayed no evidence of demyelination regarding MTR, [11C]-PIB DVR or demyelinated voxels density, but only displayed diffusion diffrerences when compared to their mirrors (higher MD and RD) (Figure 5A). On the contrary, hypoperfused prelesions had a significantly lower MTR and [11C]-PIB assessed DVR and higher demyelinated voxel density when compared to their mirrors (Figure 5B).
Discussion
The fact that demyelination was not yet detectable in hyperperfused prelesions, whereas hypoperfused prelesions already displayed multimodal evidence of demyelination (on [11C]-PiB PET as well as on MRI), suggests that hyperperfusion precedes demyelination and could be the very first event in the process of a new MS lesion formation. The pathophysiological mechanisms explaining this early increase in CBF could involve neoangiogenesis or changes in neurovascular coupling, and should be explored further.Acknowledgements
We thank all of the Brain Institute of Paris team « Remyélinisation dans la sclérose en plaques : de la biologie à la translation clinique », as well as the Centre Hospitalier Frederic Jolliot (CEA), at Orsay (France).References
(1) Filippi M, Preziosa P, Banwell BL, Barkhof F, Ciccarelli O, De Stefano N, et al. Assessment of lesions on magnetic resonance imaging in multiple sclerosis: practical guidelines. Brain.1 jul 2019;142(7):1858‑75.
(2) Elliott C, Momayyezsiahkal P, Arnold DL, Liu D, Ke J, Zhu L, et al. Abnormalities in normal-appearing white matter from which multiple sclerosis lesions arise. Brain Commun. 1 jul 2021;3(3):fcab176.
(3) Chen YJ, Rosario BL, Mowrey W, Laymon CM, Lu X, Lopez OL, et al. Relative 11 C-PiB Delivery as a Proxy of Relative CBF: Quantitative Evaluation Using Single-Session 15 O-Water and 11 C-PiB PET. J Nucl Med. aug 2015;56(8):1199‑205.
(4) Arya Yazdan-Panah,Benedetta Bodini, Matteo Toniett, Bruno Stankoff. Simultaneous assessment of blood flow and myelin content in the brain white matter with dynamic [11C]PiB PET: a test-retest study in healthy controls. In preparation.
(5) Bodini B, Veronese M, García‐Lorenzo D, Battaglini M, Poirion E, Chardain A, et al. Dynamic Imaging of Individual Remyelination Profiles in Multiple Sclerosis. Ann Neurol. may 2016;79(5):726‑38.
(6) Elliott C, Wolinsky JS, Hauser SL, Kappos L, Barkhof F, Bernasconi C, et al. Slowly expanding/evolving lesions as a magnetic resonance imaging marker of chronic active multiple sclerosis lesions. Mult Scler J. :11.
(7) Ganzetti M, Wenderoth N, Mantini D. Whole brain myelin mapping using T1- and T2-weighted MR imaging data. Front Hum Neurosci [Internet]. 2 sept 2014
(8) Veronese M, Bodini B, García-Lorenzo D, Battaglini M, Bongarzone S, Comtat C, et al. Quantification of [ 11 C]PIB PET for Imaging Myelin in the Human Brain: A Test—Retest Reproducibility Study in High-Resolution Research Tomography. J Cereb Blood Flow Metab. nov 2015;35(11):1771‑82.
(9) Law M, Saindane AM, Ge Y, Babb JS, Johnson G, Mannon LJ, et al. Microvascular Abnormality in Relapsing-Remitting Multiple Sclerosis: Perfusion MR Imaging Findings in Normal-appearing White Matter. Radiology. june 2004;231(3):645‑52.
Figures
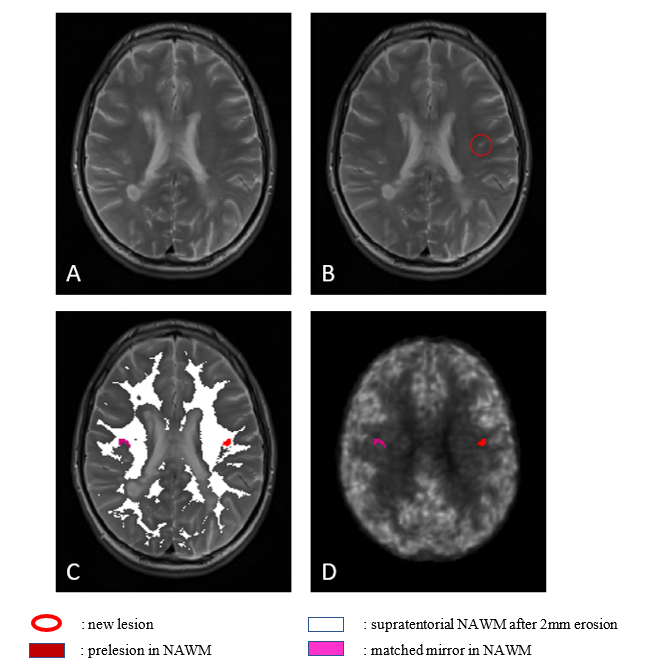
Figure 1: Definition of the prelesions and their matched mirrors.
(1A,1B): MRI T2 sequence at the first (1A) and second (1B) visit, showing the appearance of a new lesion (red circle).
(1C): Constitution of the final prelesional mask associated with its mirror in the non-prelesional NAWM eroded by 2mm.
(1D) : Prelesion and mirror mask registration on the R1 perfusion map extracted from [11C]-PiB PET of the same patient.
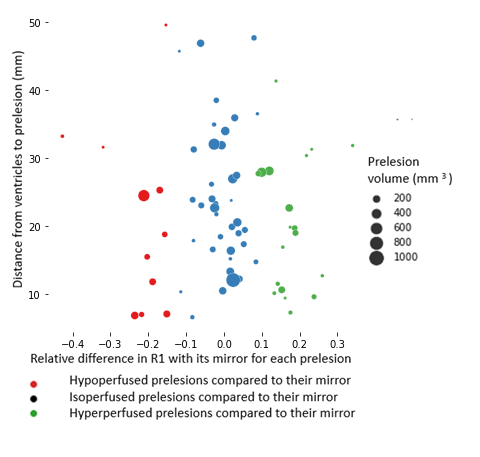
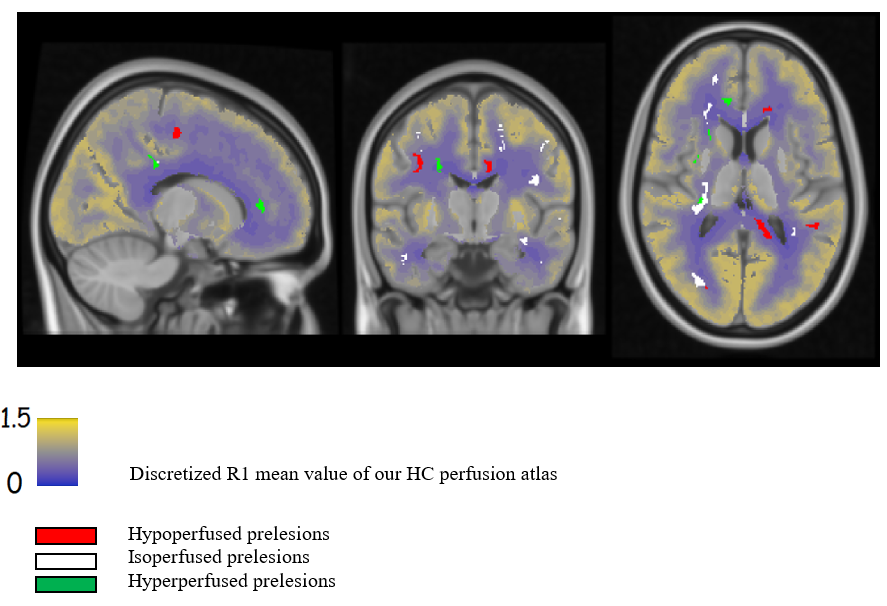
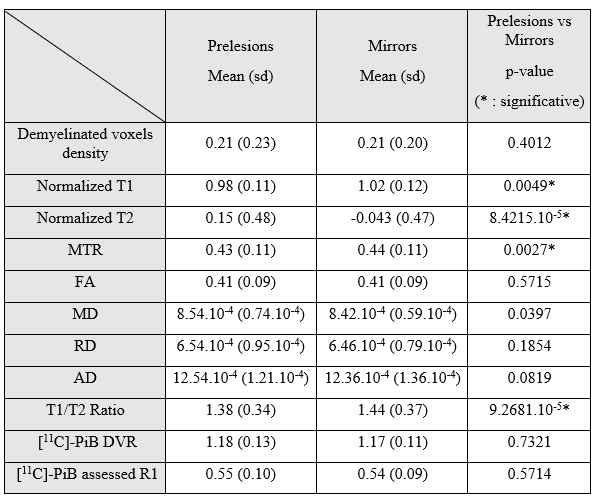
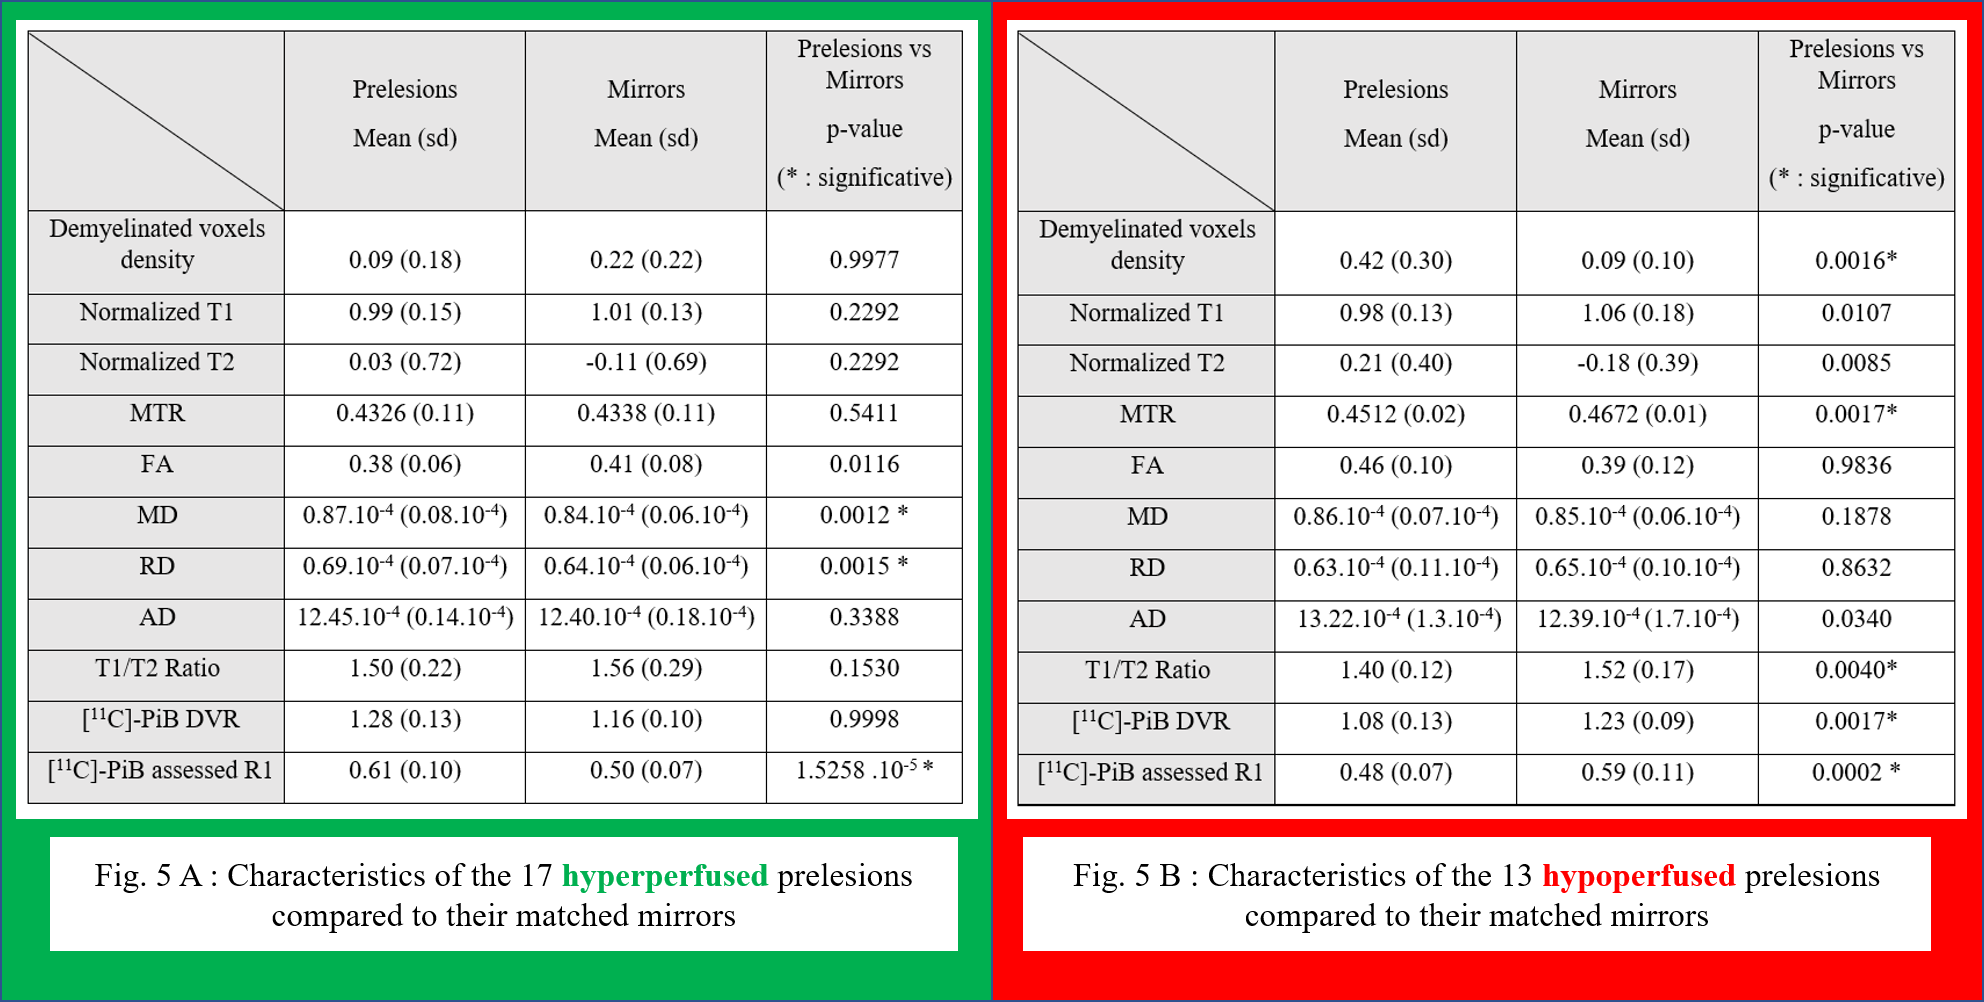
Figure 5 : Characteristics of the different perfusion subgroups of prelesions.
Hyperperfused prelesions (Fig. 5A) are not demyelinated yet, whereas hypoperfused prelesions (Fig. 5B) display multimodal evidence of demyelination