3376
Multiparametric MRI neuroimaging signatures predict cognitive decline in Multiple Sclerosis: a 5-year longitudinal study1School of Biomedical Sciences and Pharmacy, College of Health, Medicine and Wellbeing, University of Newcastle, Callaghan, Australia, 2Hunter Medical Research Institute, New Lambton Heights, Australia, 3School of Health Sciences, College of Health, Medicine and Wellbeing, University of Newcastle, Callaghan, Australia, 4Department of Radiology, King Fahad University Hospital, Dammam, Saudi Arabia, 5Department of Neurology, John Hunter Hospital, New Lambton Heights, Australia, 6School of Medicine and Public Health, College of Health, Medicine and Wellbeing, University of Newcastle, Callaghan, Australia, 7School of Biomedical Sciences, Queensland University of Technology, Brisbane, Australia
Synopsis
Keywords: Multiple Sclerosis, Radiomics
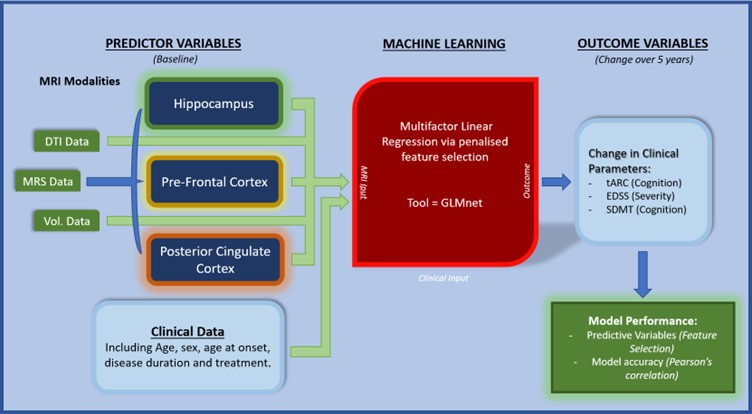
This novel longitudinal study evaluates multiparametric MRI signature for predicting cognitive decline in multiple sclerosis (MS) cohort followed for 5-years using a penalised regression machine learning approach (GLMnet). 43 MS participants were assessed at baseline and 5-years follow-up. Baseline (input) data consisted of 76 multiparametric MRI measures for different brain regions and tissues. The best performing model was for a change in tARCS (15 features; r=0.7±0.07), which was substantially higher than that for SDMT (r=0.496±0.08). These findings highlight the importance of using measures from multiple MR modalities analysed in combination with machine learning techniques when assessing cognitive decline.Background
Multiple sclerosis (MS) is a chronic and debilitating disease that arises from autoimmune dysfunction causing neuronal demyelination. Cognitive impairment is a common and important clinical symptom of MS affecting up to 70% of people with (pw)MS1. The impact and prevalence of cognitive impairment in MS2,3, highlights the need for identifying the predictive signatures of cognitive decline in MS patients over time leading to customisation of preventative treatment strategies. Diverse MRI techniques can provide complementary structural, functional and metabolic indices of the brain, using diffusion MRI (dMRI) and MR spectroscopy (MRS), in people with MS (pwMS)4,5 . Some MR parameters have been correlated with variation in cognitive function in MS6. A recent systematic review showed that selected neuroimaging metrics can partially predict cognitive decline in MS patients when assessed by Symbol Digit Modalities Test (SDMT)7. However, most of these studies are limited to cross-sectional designs and only included a single MR modality and/or used a single metric analysis strategy. Additionally, recent studies showed that biomarkers like blood neurofilament light (NfL) chain can only predict progression after 13 years8. In this study, we aimed to identify a MR signatures consisting of volumetric, MRS and dMRI metrics for predicting cognitive decline in an Australian pwMS cohort followed for 5-years using a penalised regression machine learning approach.Materials and Methods
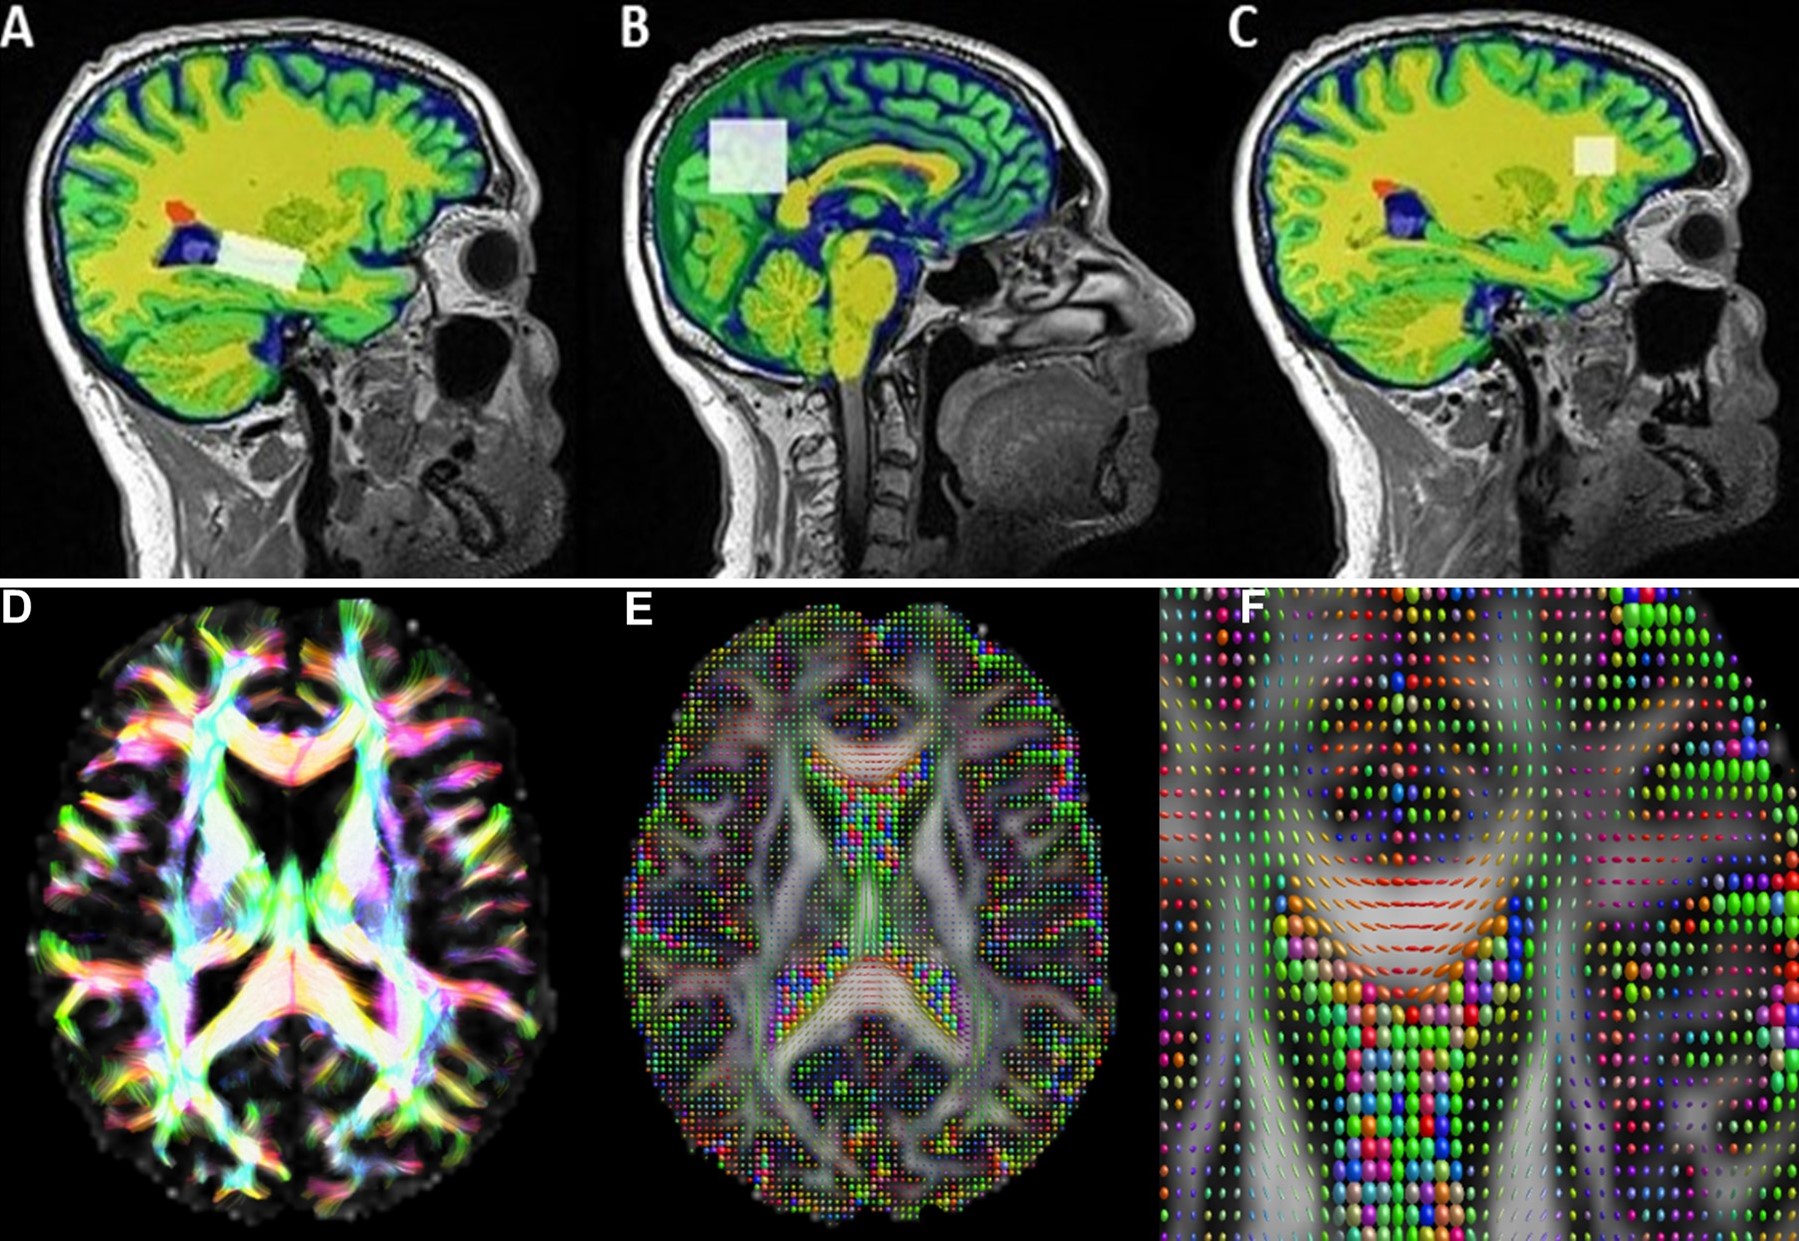
A cohort of 43 pwMS were assessed at baseline and 5 years follow-up. Baseline (input) data consisted of 76 multiparametric MRI measures (volumetric, MRS and dMRI) for different brain regions and tissues. All MRI/MRS/dMRI were undertaken on a 3T (Prisma, Siemens) MRI scanner equipped with a 64-channel coil. Cognitive function was assessed using the total Audio Recorded Cognitive Screen (tARCS), SDMT and Expanded Disability Status Scale (EDSS). Multi-factor prediction modelling was performed using the machine learning package - GLMNet9 where a penalised regression was applied to identify the signatures that offered the most predictive value (and the least error) for each outcome (Figure 1). Structural imaging using 3D T1-MPRAGE (TR/TE/TI=2000/3.5/1100 ms, FOV=256x256mm2) as well as 3D T2-FLAIR (TR/TE/TI=5000/386/1800ms, FOV=256x256 mm2) were acquired. H-MRS was applied using a Point RESolved Spectroscopy (PRESS) sequence acquired from hippocampus with voxel size =30x15x15 mm3, posterior cingulate gyrus (PCG) with voxel size =30x30x30 mm3 and prefrontal cortex (PFC) with voxel size =15x15x15 mm3 (Figure 2). The dMRI protocol consisted of an echo-planar imaging sequence with 70 axial slices. White matter fractional anisotropy (FA), mean, radial and axial diffusivities (MD, RD, AD) were estimated using our MRTrix in-house pipeline. FSL and SPM12 were used for total brain volume, grey matter (GM), white matter (WM), CSF volumes and segmentation of lesion and MRS voxels10-12 (Figure 2).Results
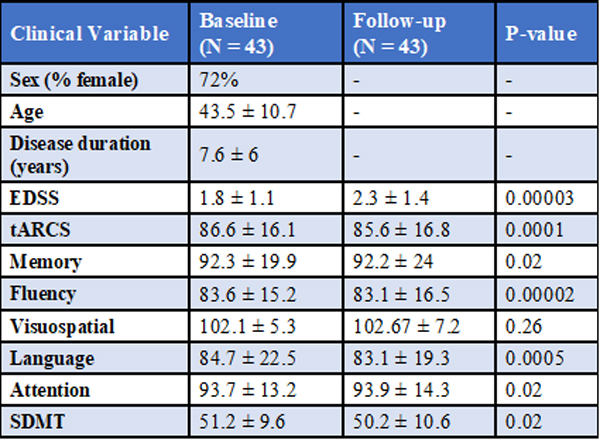
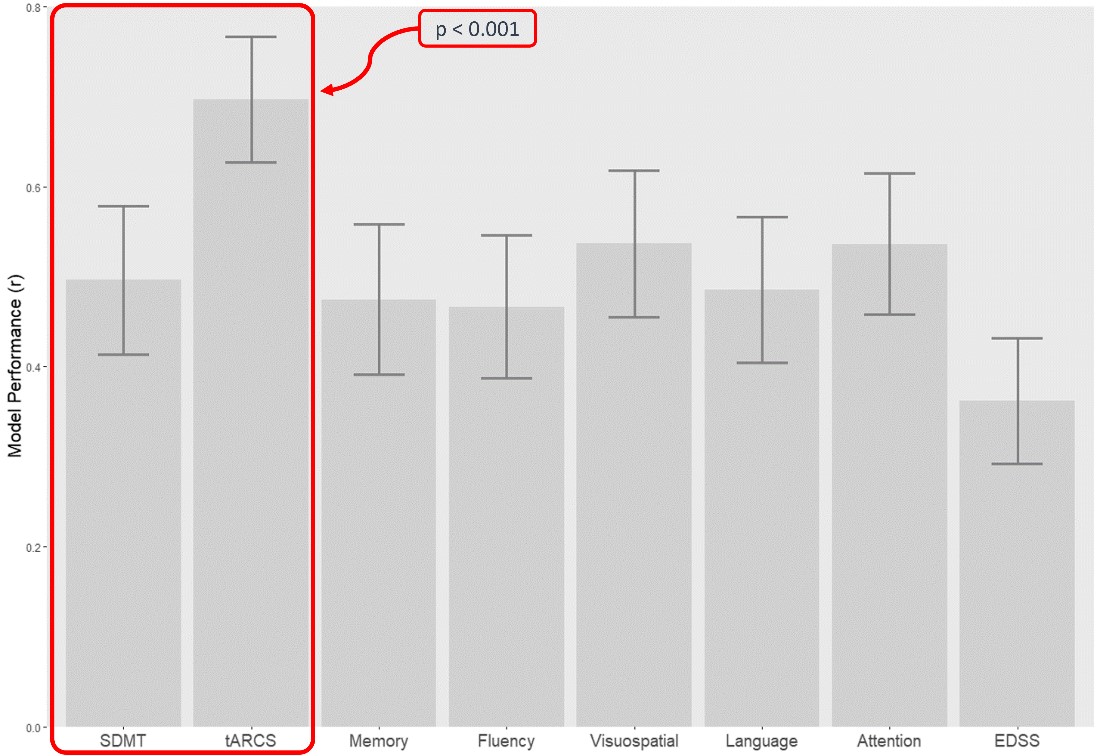
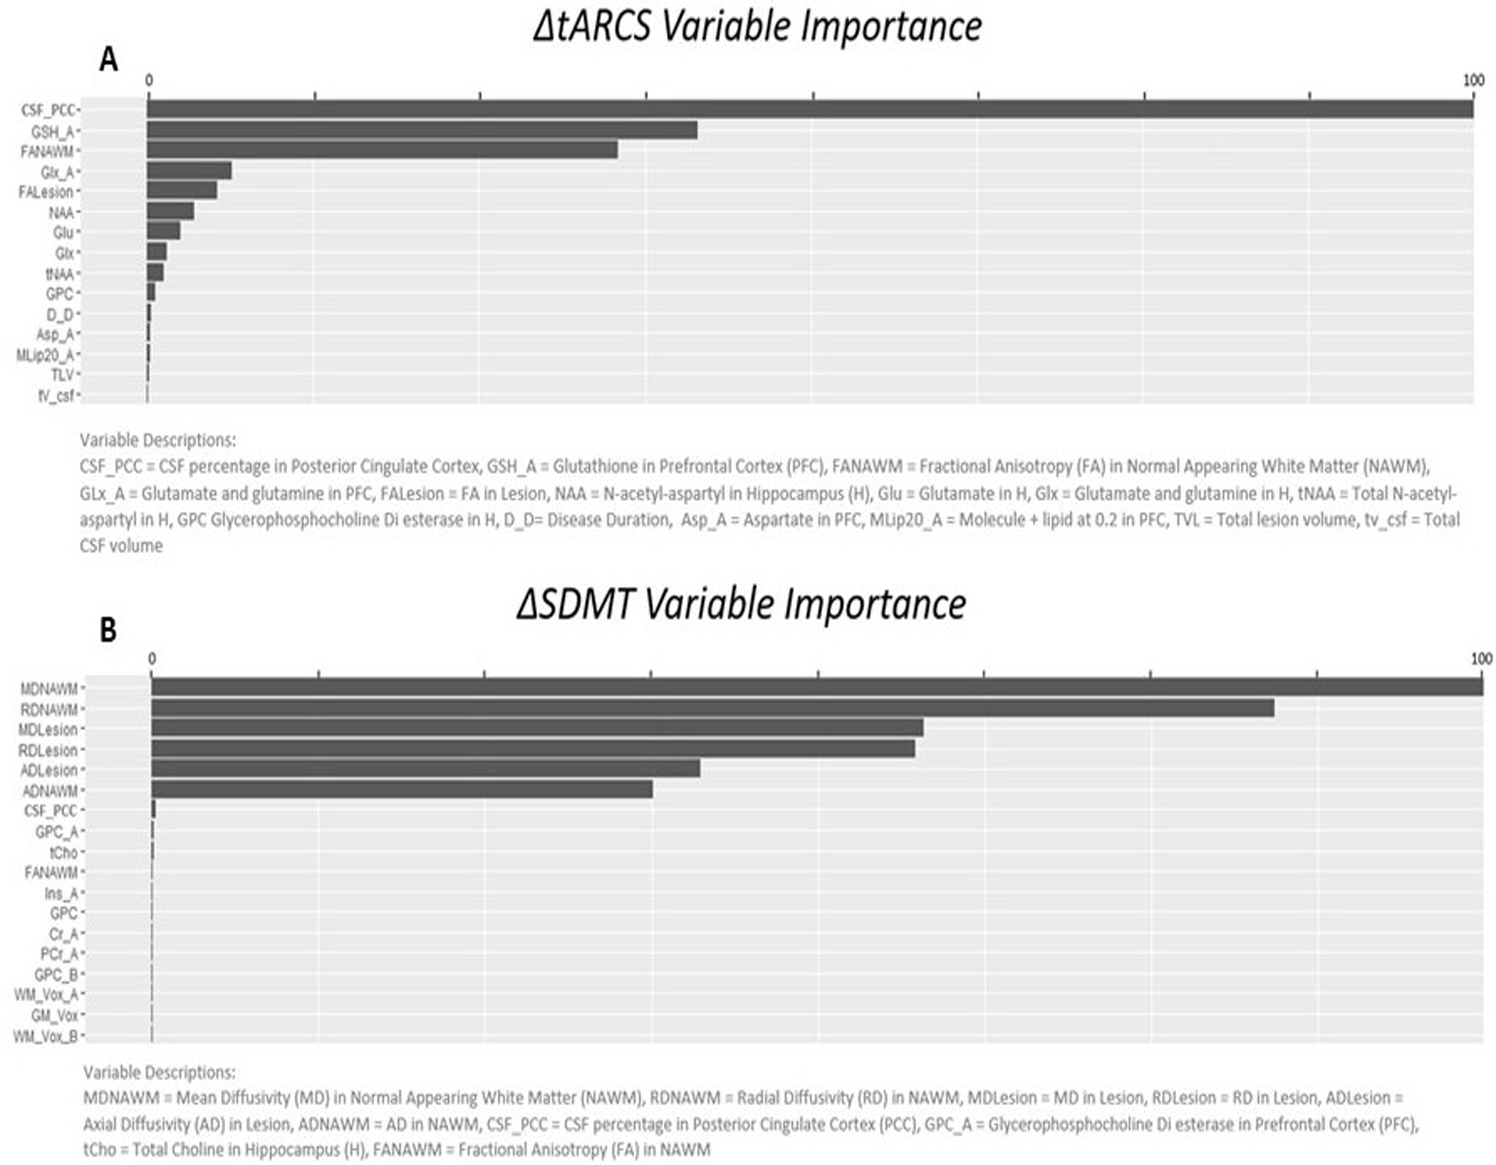
The demographic details and clinical characteristics of the cohort are presented in Table 1. The best performing model was for a change in tARCS (r = 0.7 ± 0.07), which was substantially higher than that achieved for the best performing model for SDMT (r = 0.496 ± 0.08) (Figure 3). For tARCS there were 15 features from across the various MRI modalities that explained 50% of the variation in change over time (R2=0.5, 95% CI = 0.48-0.51). These features included 9 metabolites (top = GLX and NAA), 4 volumetric (top = CSF, lesion volume), and 2 DTI (top = FA white matter and lesion) (Figure 4A). By comparison, the best model for SDMT selected many of the same features and explained 39% of the change over time (R2=0.39, 95% CI = 0.48-0.51) (Figure 4B).Discussion
In this longitudinal study with 5y FU, we identified multiple MR modalities signatures predicting cognitive decline of MS, combined with GLMnet as a powerful machine learning data analysis technique. Longitudinally, we found that the best-performing model for a change in tARCS compared to other cognitive scores was a Lasso subtype of GLMnet regression. These findings demonstrate that multiparametric MRI measures (MRS, dMRI and volumetric data) improve the accuracy of predicting cognitive impairment for tARCS. This is important as tARCS covers a wider range of cognitive dysfunctions compared to SDMT. Several studies showed that different single MR parameters correlated mildly with variation in cognitive function in MS6,13 using single metric analysis strategies 7,14. Importantly, our findings highlighted that multiple MR imaging modalities are needed to monitor and predict cognitive impairment in MS.Conclusion
A multiparametric MRI signature predicts cognitive decline in a cohort of Australian pwMS. These findings highlight the importance of using measures from multiple MR modalities analysed in combination using machine learning techniques when assessing cognitive decline. Future studies will benefit from the inclusion of even more MRI modalities e.g., functional MRI as well as other potential predictors e.g., genetic, environmental and clinical.Acknowledgements
This study’s funding was provided by independent investigator-initiated grant provided by Biogen Pharmaceuticals Pty Ltd. The authors acknowledge the facilities and scientific and technical assistance of the National Imaging Facility, a National Collaborative Research Infrastructure Strategy (NCRIS) capability, at the Hunter Medical Research Institute Imaging Centre, University of Newcastle.
References
1. DeLuca GC, Yates RL, Beale H, Morrow SA. Cognitive impairment in multiple sclerosis: clinical, radiologic and pathologic insights. Brain Pathol 2015;25(1):79-98.
2. Jakimovski D, Weinstock-Guttman B, Gandhi S, et al. Dietary and lifestyle factors in multiple sclerosis progression: results from a 5-year longitudinal MRI study. J Neurol 2019;266(4):866-875.
3. Filippi M, Preziosa P. MRI predicts cognitive training effects in multiple sclerosis. Nat Rev Neurol 2022;18(9):511-512.
4. Andersen O, Hildeman A, Longfils M, et al. Diffusion tensor imaging in multiple sclerosis at different final outcomes. Acta Neurol Scand 2018;137(2):165-173.
5. Bitsch A, Bruhn H, Vougioukas V, et al. Inflammatory CNS demyelination: histopathologic correlation with in vivo quantitative proton MR spectroscopy. AJNR American journal of neuroradiology 1999;20(9):1619-1627.
6. Rocca MA, Amato MP, De Stefano N, et al. Clinical and imaging assessment of cognitive dysfunction in multiple sclerosis. Lancet Neurol 2015;14(3):302-317.
7. Pike AR, James GA, Drew PD, Archer RL. Neuroimaging predictors of longitudinal disability and cognition outcomes in multiple sclerosis patients: A systematic review and meta-analysis. Mult Scler Relat Disord 2022;57:103452.
8. Varhaug KN, Torkildsen Ø, Myhr KM, Vedeler CA. Neurofilament Light Chain as a Biomarker in Multiple Sclerosis. Front Neurol 2019;10:338.
9. Friedman J, Hastie T, Tibshirani R. glmnet: Lasso and elastic-net regularized generalized linear models. R package version 2009;1(4):1-24.
10. Ashburner J, Barnes G, Chen C , et al. SPM12 2015.
11. Smith SM, Jenkinson M, Woolrich MW, et al. Advances in functional and structural MR image analysis and implementation as FSL. NeuroImage 2004;23 Suppl 1:S208-219.
12. Quadrelli S, Mountford C, Ramadan S. Hitchhiker's Guide to Voxel Segmentation for Partial Volume Correction of In Vivo Magnetic Resonance Spectroscopy. Magn Reson Insights 2016;9:1-8. 13. Rocca MA, Valsasina P, Hulst HE, et al. Functional correlates of cognitive dysfunction in multiple sclerosis: A multicenter fMRI Study. Human brain mapping 2014;35(12):5799-5814.
14. Enzinger C, Barkhof F, Ciccarelli O, et al. Nonconventional MRI and microstructural cerebral changes in multiple sclerosis. Nat Rev Neurol 2015;11(12):676-686.
Figures