3375
Morphological comparison of superficial white matter bundles between the human and chimpanzee brain
Maëlig Chauvel1, Marco Pascucci1, Ivy Uszynski1, Bastien Herlin1, Jean-François Mangin1, William Donald Hopkins2, and Cyril Poupon1
1Université Paris-Saclay, CEA, CNRS, UMR 9027, BAOBAB, NeuroSpin, , Gif-sur-Yvette, France, Saclay, France, 2Michele E Keeling Center for Comparative Medicine and Research, The University of Texas MD Anderson Cancer Center, Bastrop, Texas, Texas, TX, United States
1Université Paris-Saclay, CEA, CNRS, UMR 9027, BAOBAB, NeuroSpin, , Gif-sur-Yvette, France, Saclay, France, 2Michele E Keeling Center for Comparative Medicine and Research, The University of Texas MD Anderson Cancer Center, Bastrop, Texas, Texas, TX, United States
Synopsis
Keywords: Brain Connectivity, Neuroscience, chimpanzee, white matter atlas
The role of the superficial brain connections remains unclear. They appear to be important in the structural organization of the connectivity between the different brain gyri and are usually described as 'U-fibers' referring to their shape. Using an isomap algorithm, we explored in finer detail the superficial connectivity of the chimpanzee and human brains, still poorly known. This method allowed us to better capture the variability of the different shapes of the bundles that we observed and to overcome many bias due to subjective preconceptions.Introduction
The brain's superficial white matter (SWM) connectivity has been examined in humans using MRI and brain dissection1,2, and described as subcortical white matter fibers connecting one gyrus to another3. While the peculiar role of these loco-regional connections remains unclear, they appear to be important in the structural organization of the connectivity between the different brain gyri4. Morphologically, the SWM bundles are described as 'U-fibers' referring to their shape, following the convexity of gyral convolutions1,3. We propose a new morphological classification of the superficial white matter bundles of the chimpanzee and human brain. The isomap pipeline, that was originally designed to study the shape of cortical sulci5, allowed us to explore in finer detail the SWM of these species.Methods
The chimpanzee atlas considered from Chauvel et al. 2022 (10.5281/zenodo.7147789) (see Figure 1.) was built upon a cohort of 39 healthy in vivo chimpanzees from the Yerkes national primates center. Each individual was scanned using a 3 Tesla MRI system with a dedicated imaging protocol.Anatomical and diffusion data were processed using a pipeline dedicated to the chimpanzee species (https://framagit.org/cpoupon/gkg). All brains T1w and diffusion images were matched to the Juna.chimp template6 that includes a cortical parcellation. A 2-step clustering strategy similar to that proposed in Guevara et al. 20117 was used to build up bundles relevant at the population level. This strategy is based on a first clustering step establishing fascicles (e.g. individual fiber clusters) at the subject level, followed by a second step providing bundles at the population level.
The different bundles were merged depending on their proximity, in order to obtain pertinent groups of shorts bundles for each pair of regions stemming from the template.
The human atlas considered from Chauvel et al. 2022 (10.5281/zenodo.7308606 ) (see Figure 1.) relies on subjects from the Human connectome project (HCP), intentionally matching the number of chimpanzees. Anatomical and diffusion data were processed using a dedicated python pipeline following the same steps as for the chimpanzee atlas. All subjects' MRI data were registered on the MNI template space.
Each of the extracted fiber bundles N (whether belonging to humans or chimpanzees) were reduced to one fiber representative of the cluster called ‘centroidal’ fiber. Then, for each pair of centroids we did the following: align the two centroids and calculate a geometrical distance that is small if the centroids are similar, big if they are different.
The alignment procedure is PCA-based: we extracted the three principal directions from the point-clouds representing each of the fibers and then aligned these axes by calculating the optimal transformation matrix9. Then, we computed the mean pairwise distance between each point from the point clouds.The map of the distances between all the fiber pairs is a NxN matrix, that can be seen (row- or column-wise) as a set of N points in a N-dimensional space, each representing a particular fiber.
We then apply a dimensionality reduction of the N-dimensional space using the isomap algorithm8. We observed that a drastic reduction to only 2 dimensions kept enough information for the successive clustering steps. Successively, we define clusters in the isomap-reduced space via k-means. Once the clusters are defined, we re-align the point-clouds of the corresponding fibers to the point-cloud corresponding to the cluster’s center and calculate a new average point-cloud which captures the general shape of the fibers in the clusters.
Results
For both species, we observed that flattered bundles were mostly found on the ventral part of the brain while curved fibers were mostly present on the dorsal part of the brain (see Figure 2).In the chimpanzee brain, taking into account the degree of closure of the fiber bundles, it appears that the more the fibers seem to close up, the more dorsally is the progression. This is not exactly the case concerning humans. Indeed, there seems to be the same phenomenon, only the bundles seem to close up from the ventral anterior part to the dorsal caudal part of the brain (see Figure 3). While the bundle shape seems relatively the same concerning the human and the chimpanzee brain, the humans’ ones display more enclosed edges, and the repartitions of the different shapes is not the same. This algorithm provides a good tool for the analysis of the organization and emplacement of the bundle shapes. However, it misses some interesting shapes, only found by visual inspection. The V fibers, 6-fibers and C-fibers, sometimes seen in the human and the chimpanzee brains can sometimes be hardly identified in the algorithm due to : their resemblance with other shapes (V and open-U are closely alike) and their poor representation among all the other bundles. This algorithm is a good tool to analyze the common main patterns of shapes between the two species, complementary with a thorough visual analysis necessary to distinguish subtle differences.
Discussion
To our knowledge, the study presented here is the first one depicting the morphological organization of the superficial white matter bundles of the chimpanzee brain. The algorithm of point cloud pattern mining, allowed us to extract the diversity of the superficial white fiber centroids shapes, as a complement of the visual inspection and attempt of classification.Acknowledgements
We thank the Blaise Pascal International Chairs of Excellence from Ile-de-France Region, dedicated to Pr. W. Hopkins for the funding of this workReferences
1. M. Guevara et al. JF. Mangin, Neuroimage, 2020 ; 10.1016/j.neuroimage.2020.1166732. M. Catani et al. Cortex, 2012 ; 10.1016/j.cortex.2011.12.001
3. T. Meynert, 1885, Psychiatry.
4. O. Sporns & C. J. Honey, PNAS, 2006 ; 10.1073/pnas.0609523103
5. https://github.com/neurospin/point-cloud-pattern-mining/tree/pcpm_2022_chauvel_et_al
6. S. Vickery et al. bioRxiv, 2020 ; 10.1101/2020.04.20.04
7. P. Guevara et al., Neuroimage, 2012 ; 61(4), 1083-1099
8. J.B. Tenenbaumet al., Science, 2000 ; 10.1117/1.OE.52.3.036201
9. B. Bellekens et al. , AMBIENT, 2014 ; August 24-28, 2014, Rome, Italy (pp. 8-13)
Figures
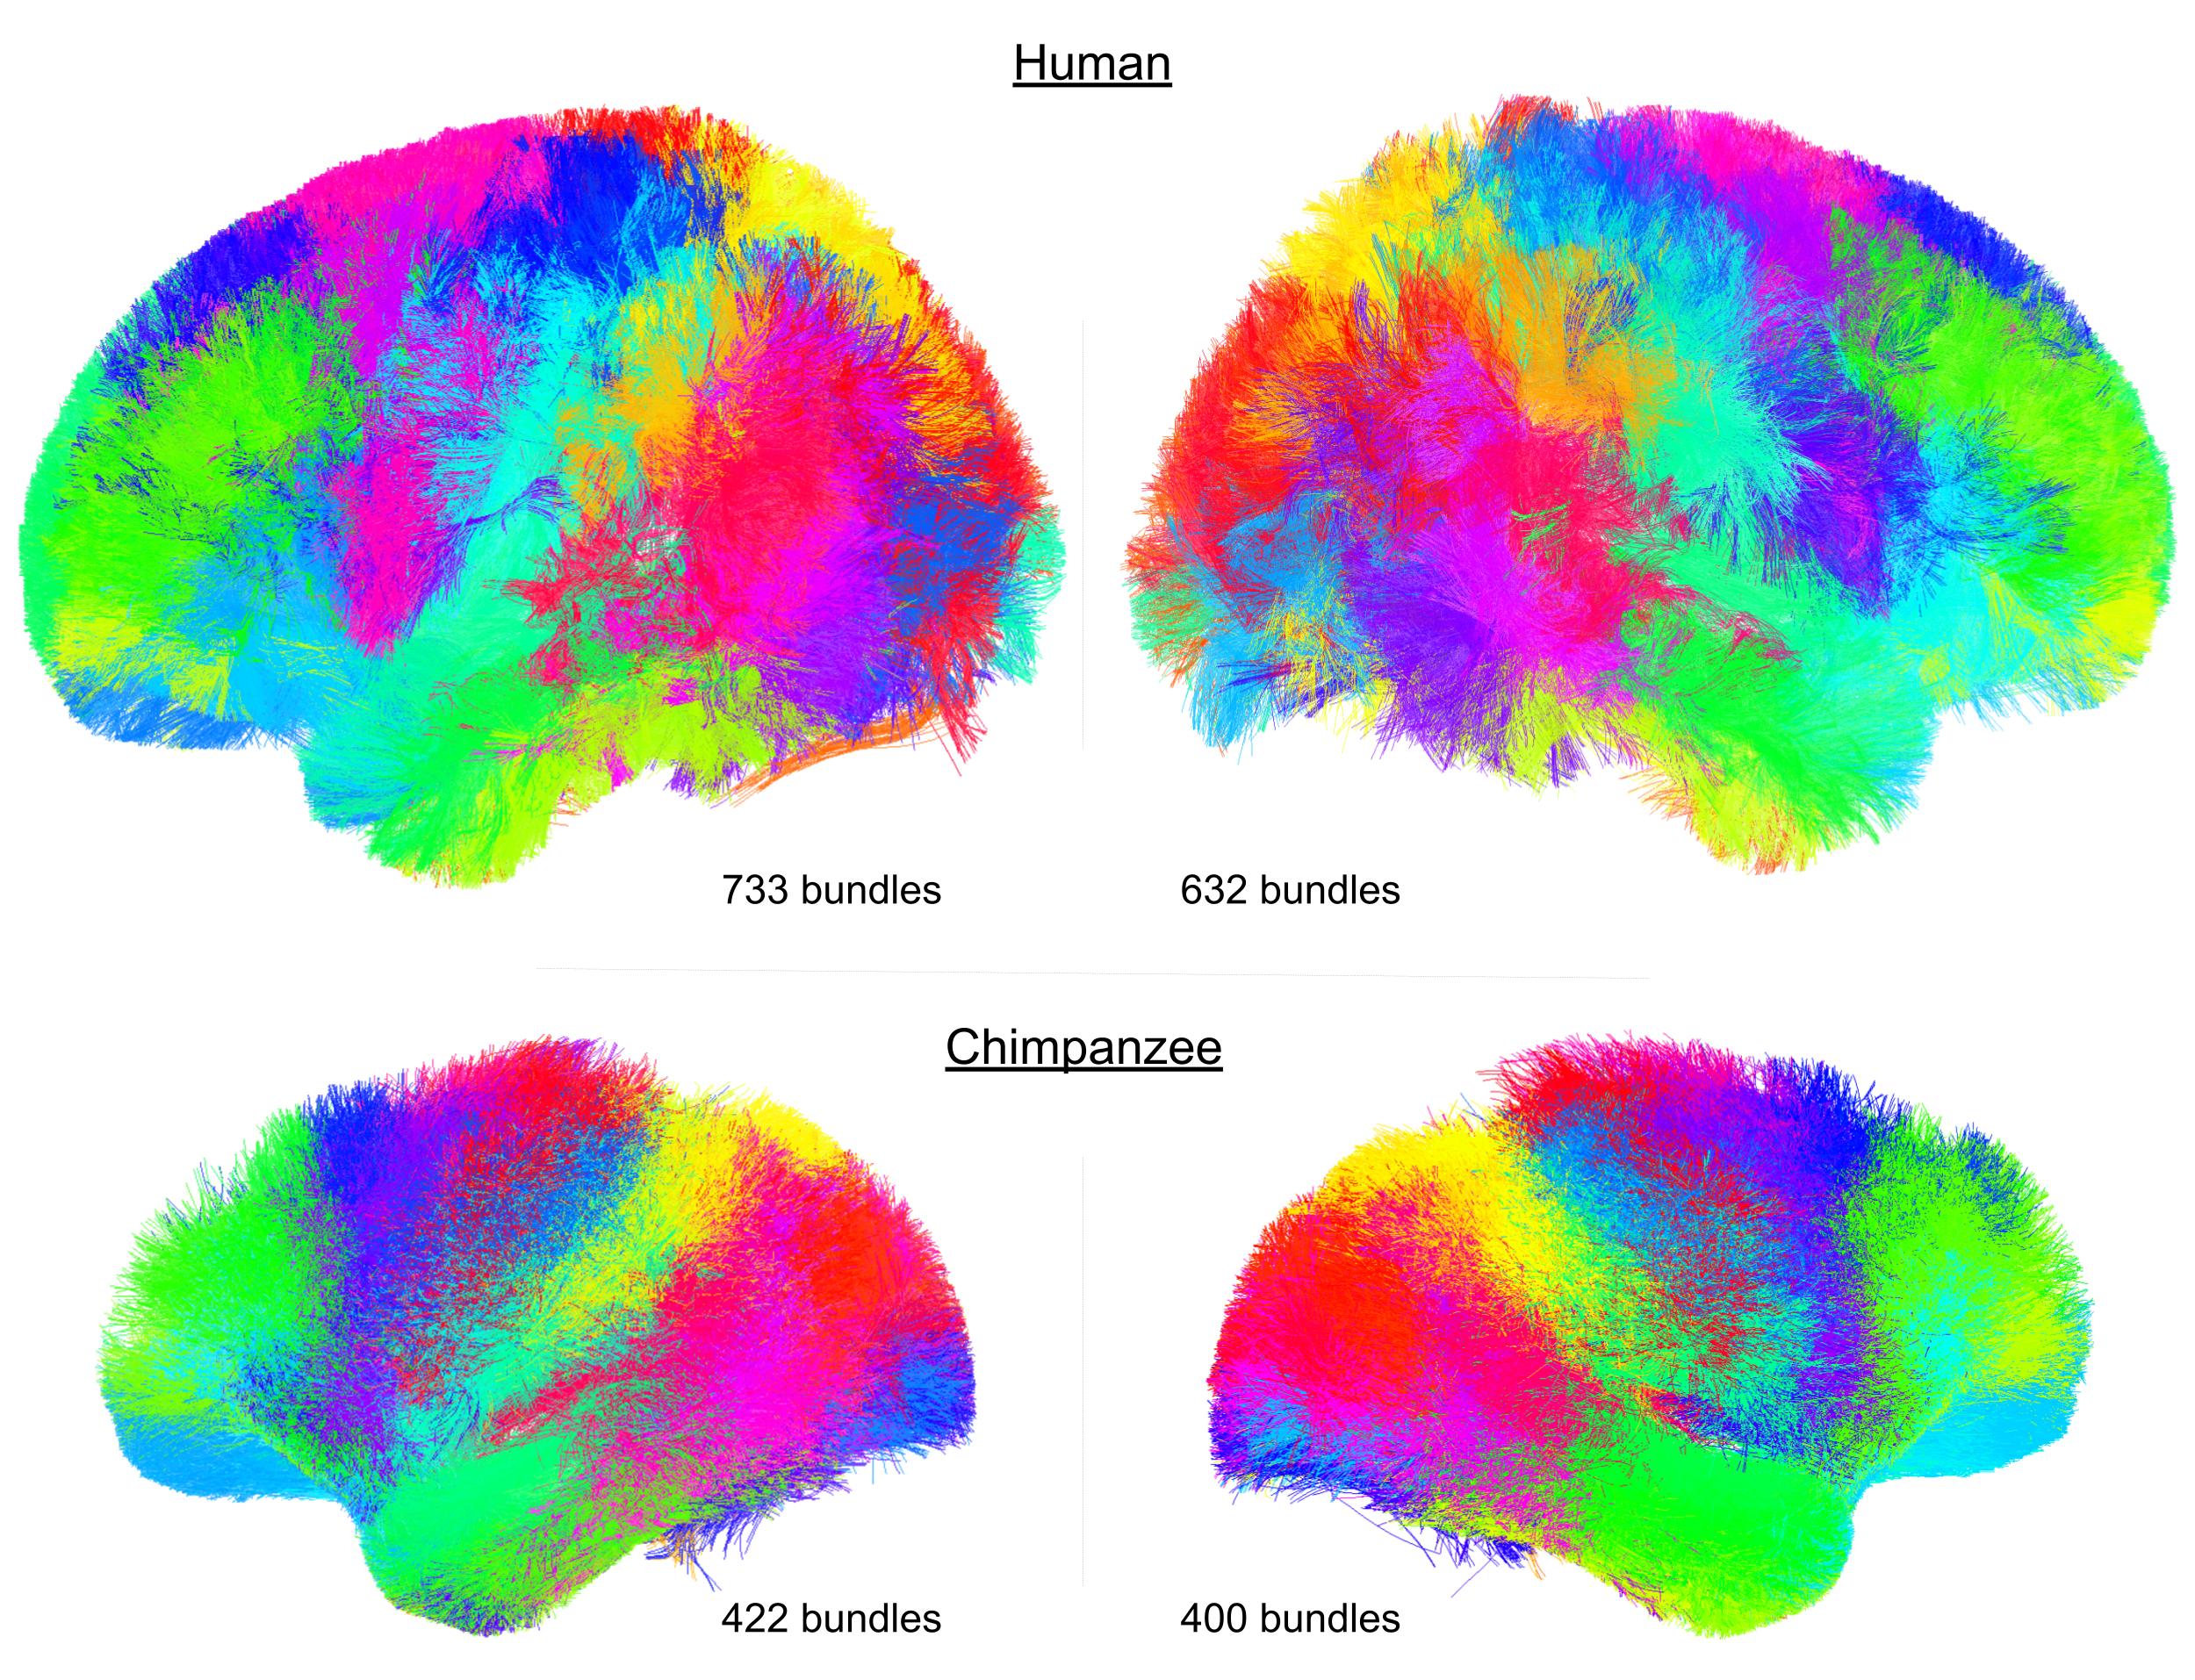
Figure 1 : Atlases of the human (top) and chimpanzee (bottom) SWM bundles. The human atlas is composed of 733 bundles for the left hemisphere and of 632 bundles on the right hemisphere. The chimpanzee SWM bundles atlas is composed of 422 bundles on the left hemisphere and of 400 bundles on the right hemisphere.
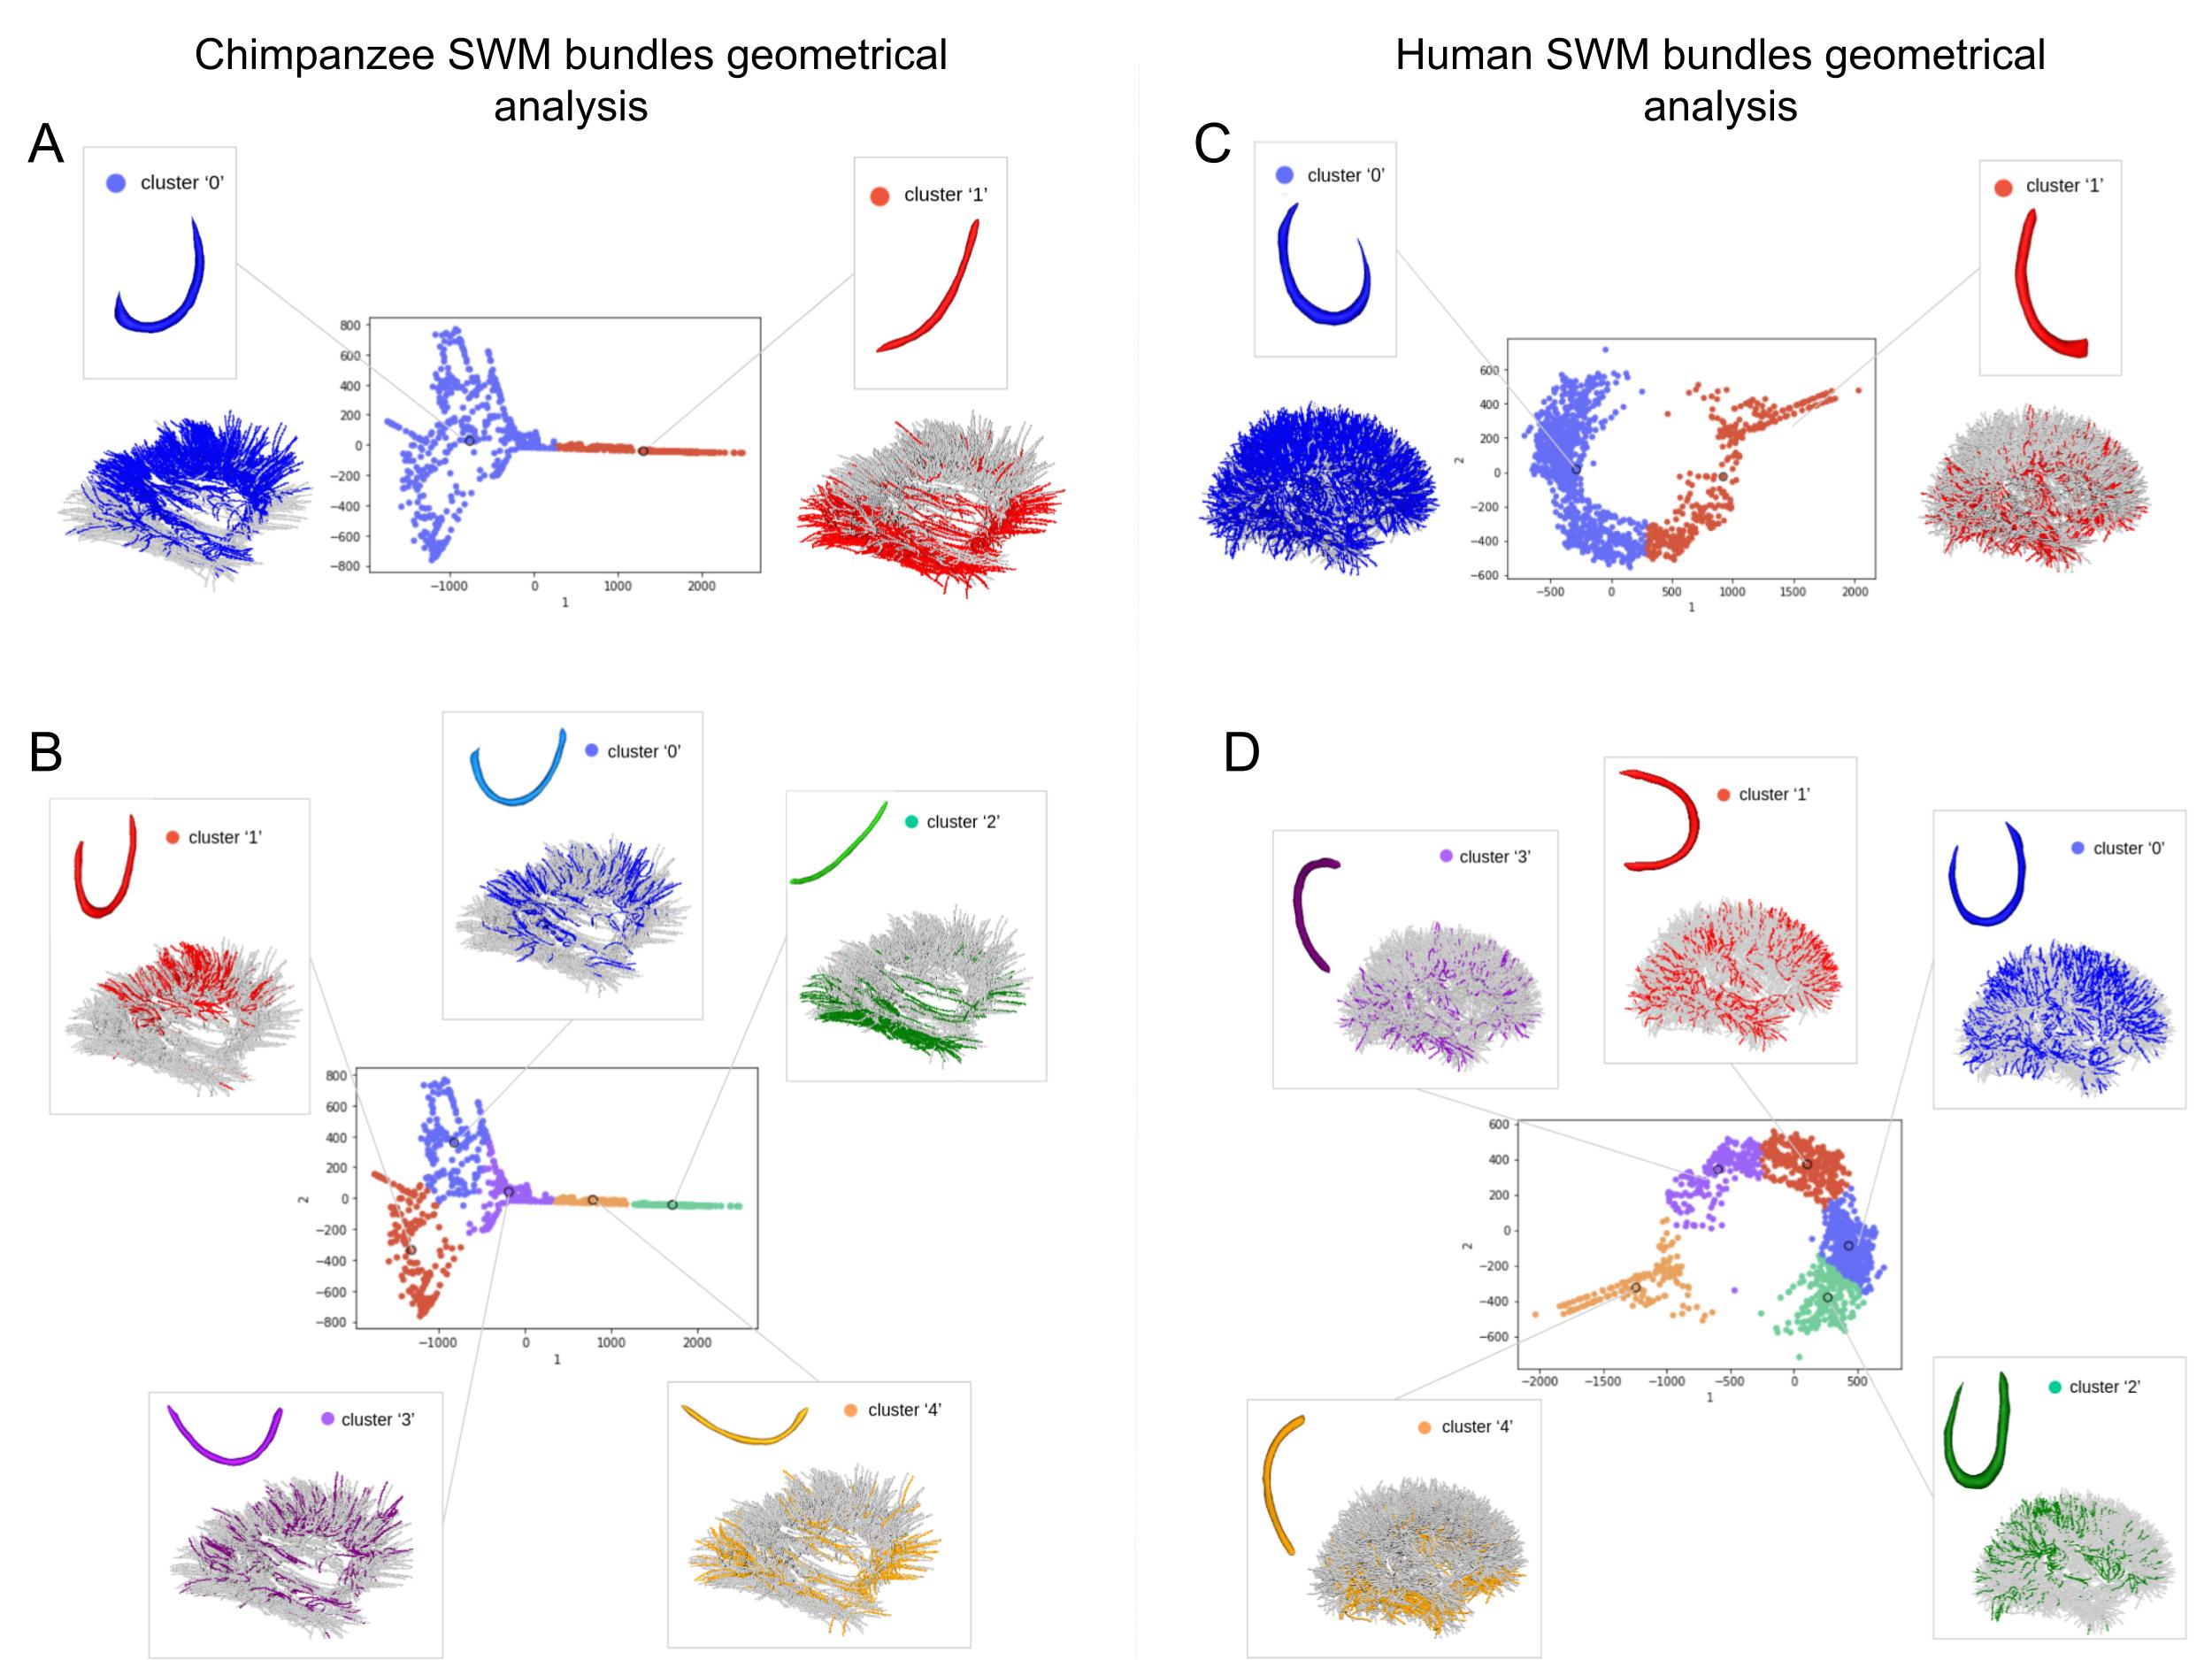
Figure 2 : Results from the isomap algorithm. Center: Graph of the distances from the embedding histogram using dimensions one and two. Clustered using Kmeans for two (A, C) or five (B, D) clusters, the circles represent the centers of the clusters, used for the computation of their average shape. Around : Average fiber shapes of the two or five clusters obtained from the kmeans and localisation of the centroids belonging to the clusters of fiber shapes.

Figure 3 : Closing gradient of the fiber edges. On the left : the different clusters of fiber bundles shapes in the chimpanzee and human brains, on the right : probabilistic maps of the different shapes on each species’ meshes. We see different orientation in the gradients of fiber edges closing : In the chimpanzee brain, the more the fibers seem to close up, the more dorsally is the progression. For the human brain, the bundles seem to close up from the ventral anterior part to the dorsal caudal part of the brain.
DOI: https://doi.org/10.58530/2023/3375