3374
White Matter Structural Connectivity is Associated with Spectral Coherence and Phase Synchronization Measured by Intracranial EEG1School of Biomedical Engineering, Shanghai Jiao Tong University, Shanghai, China, 2Department of Neurosurgery, Huashan Hospital, Fudan University, Shanghai, China
Synopsis
Keywords: Brain Connectivity, Diffusion Tensor Imaging
Using high quality atlas of the structural connectome, and direct recording of neuronal activity by stereotactic-EEG (SEEG), this study investigated the relationship between neuronal signal connectivity at different seizure stage and the white matter scaffold. The results show electrical signal spectral coherence and phase synchronization are significantly stronger between structurally connected nodes within short distance, while at the time of pre-seizure and seizure onset, high frequency (>80Hz) signal may propagate through longer distance with structural connections.Introduction
Brain structural networks are the scaffold that supports neural transmission, yet the underlying interactions between them remains unclear1,2. White matter tractography based on diffusion MRI has been a powerful technique to capture structural networks3. Population-averaged atlas of the structural connectome has been built to allow further studies of the brain scaffold4,5. Stereotactic-EEG (SEEG) has the advantage of direct measurement of electrophysiological neuronal activities with high SNR and high temporal resolution6, which can map three-dimensional epileptogenic networks avoiding craniotomy7. It is by far one of the most accurate approaches to confirm source of epileptogenicity for drug refractory epilepsy patients8. In this study, we investigate the relationship between neuronal signal connectivity at different seizure stage recorded by SEEG and underlying white matter connectome.Methods
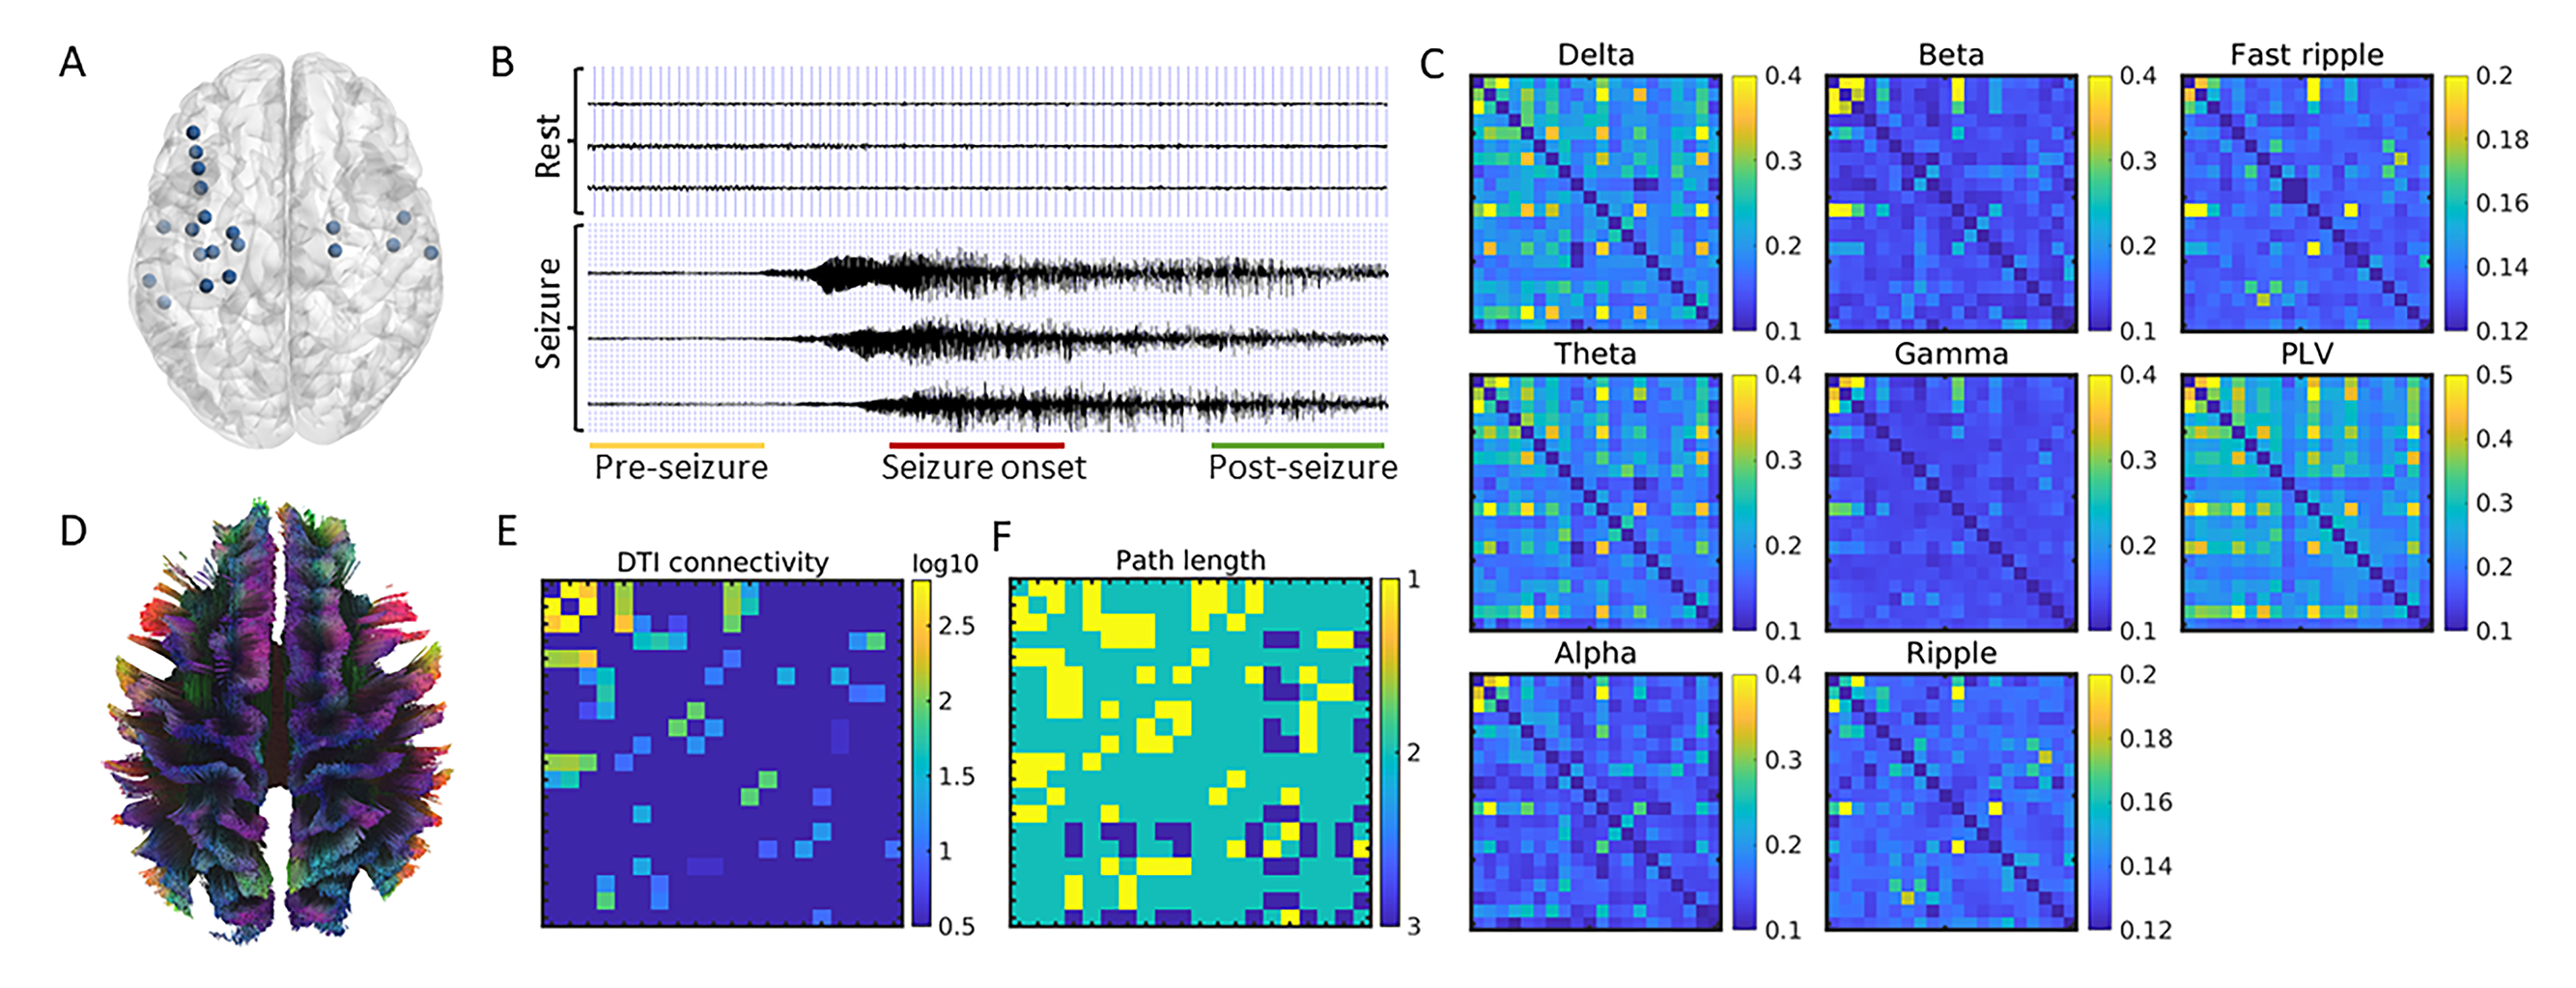
Data acquisition: In this IRB approved study, 15 drug-refractory temporal lobe epilepsy patients were recruited. CT and MRI structural images were acquired on routine clinical system. The SEEG system consisting of 8-16 contacts. The SEEG setup with a sampling rate of 2kHz, was used to continuously record patients’ neuronal activities.Data processing: Anatomical co-localization of SEEG electrodes was performed by the iEEGview toolbox with preoperative MRI and post-implanted CT images. The cortex of brain is parcellated into different regions of interest according to Destrieux atlas9,10. All SEEG data were band-pass filtered at 1–512 Hz. The event of seizure from SEEG recording was selected by experienced physicians. Signal recording around event of seizure from each electrode was segmented into three segments: pre-seizure (1 minute before seizure onset moment), seizure onset, and post-seizure (1 minute after seizure onset moment), and each of them lasts 30 seconds. In addition, resting state of 30 seconds was chosen from time period at least 1 hour away from event of seizure.
SEEG functional connectivity: The SEEG coherence with a 1s time window was computed using a Hamming taper11. The coherence was computed in the frequency bands: delta (1–4 Hz), theta (4–8 Hz), alpha (8–13 Hz), beta (13–30 Hz), gamma (30–80 Hz), high frequency of ripple (80-250 Hz) and fast ripple (250-500 Hz). The coherence in each period was averaged across all time windows and frequency bands. In addition to the spectral coherence, we also evaluate the strength of phase synchronization between electric signals―phase lock value (PLV)11,12, which was defined as:
$$PLV=|\frac{1}{N}\sum_{t=1}^{N}{e^{i(\phi _{x}-\phi _{y})t} }|$$
where $$$\phi _{x}$$$,$$$\phi _{y}$$$ were the relative phase of electric signals after the Hilbert transform, $$$t$$$ was the time window. The PLV strength was computed in 1s time windows and averaged for each segment, respectively. For ROI-wise analysis, the coherence and PLV was calculated as the average of those nodes in the same ROI.
DTI structural connectivity: The HCP-1065 DTI template was applied for white matter connectivity analysis4. The tractography was performed automatically with DSI-studio (http://dsi-studio.labsolver.org). The anatomical scans were parcellated into 198 ROIs using the Destrieux atlas10. The count values of streamlines between two paired ROIs were placed in a connectivity matrix to generate the structural network for the template brain. For the individual analysis, to match the sparse SEEG ROIs, only the structural nodes in the regions sampled by SEEG electrodes would be extracted and calculated as structural connectivity nodes (Fig. 1). Through the individual brain structural connectivity, the path length of graph theory defined as the smallest number of edges traversed between two nodes was calculated to evaluate the direct/indirect anatomical connectivity between ROIs13. The inter-node distance of paired ROIs was defined as the average anatomical distance between SEEG electrodes.
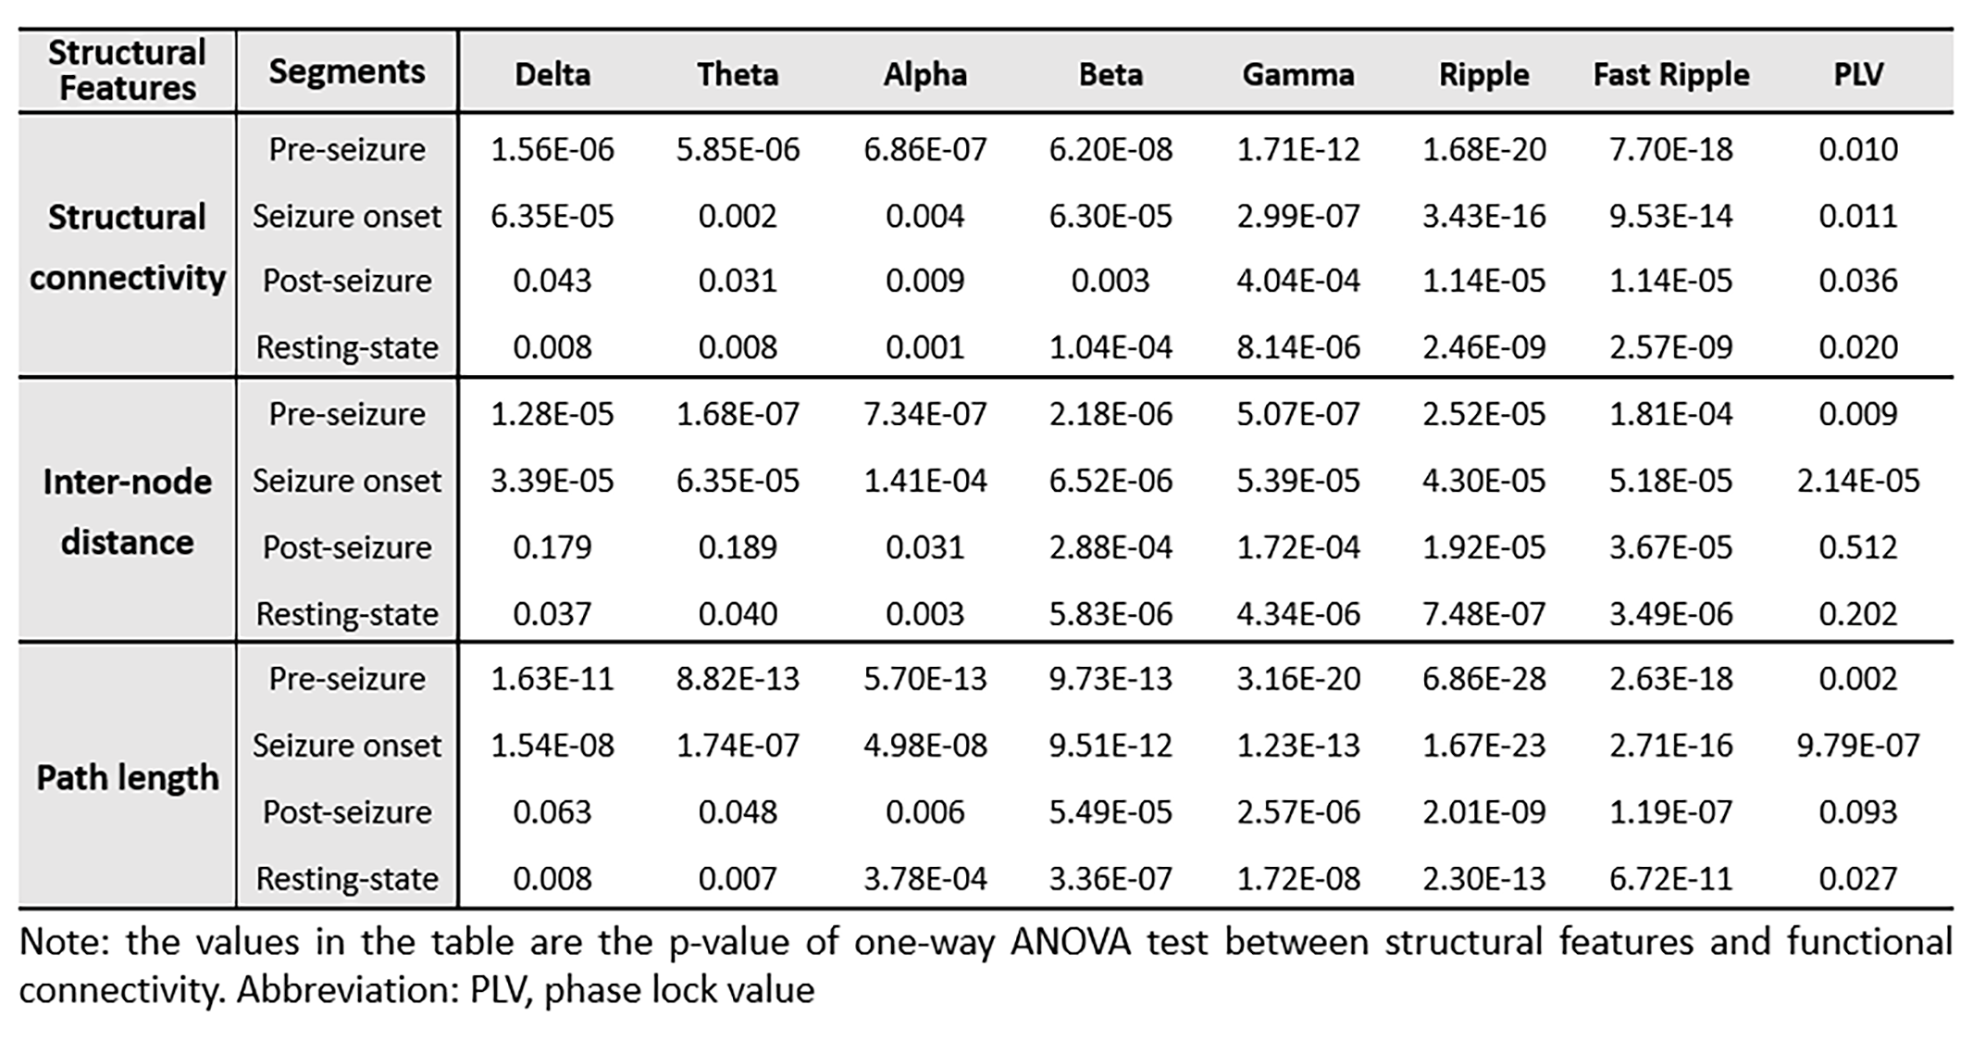
Statistical tests: In order to evaluate the relationship between functional connectivity and structural features (structural connectivity, inter-node distance, path length), the main effects were evaluated using a one-way ANOVA test. Otherwise, T-tests were performed for all pair-wise comparisons between structural features.
Results
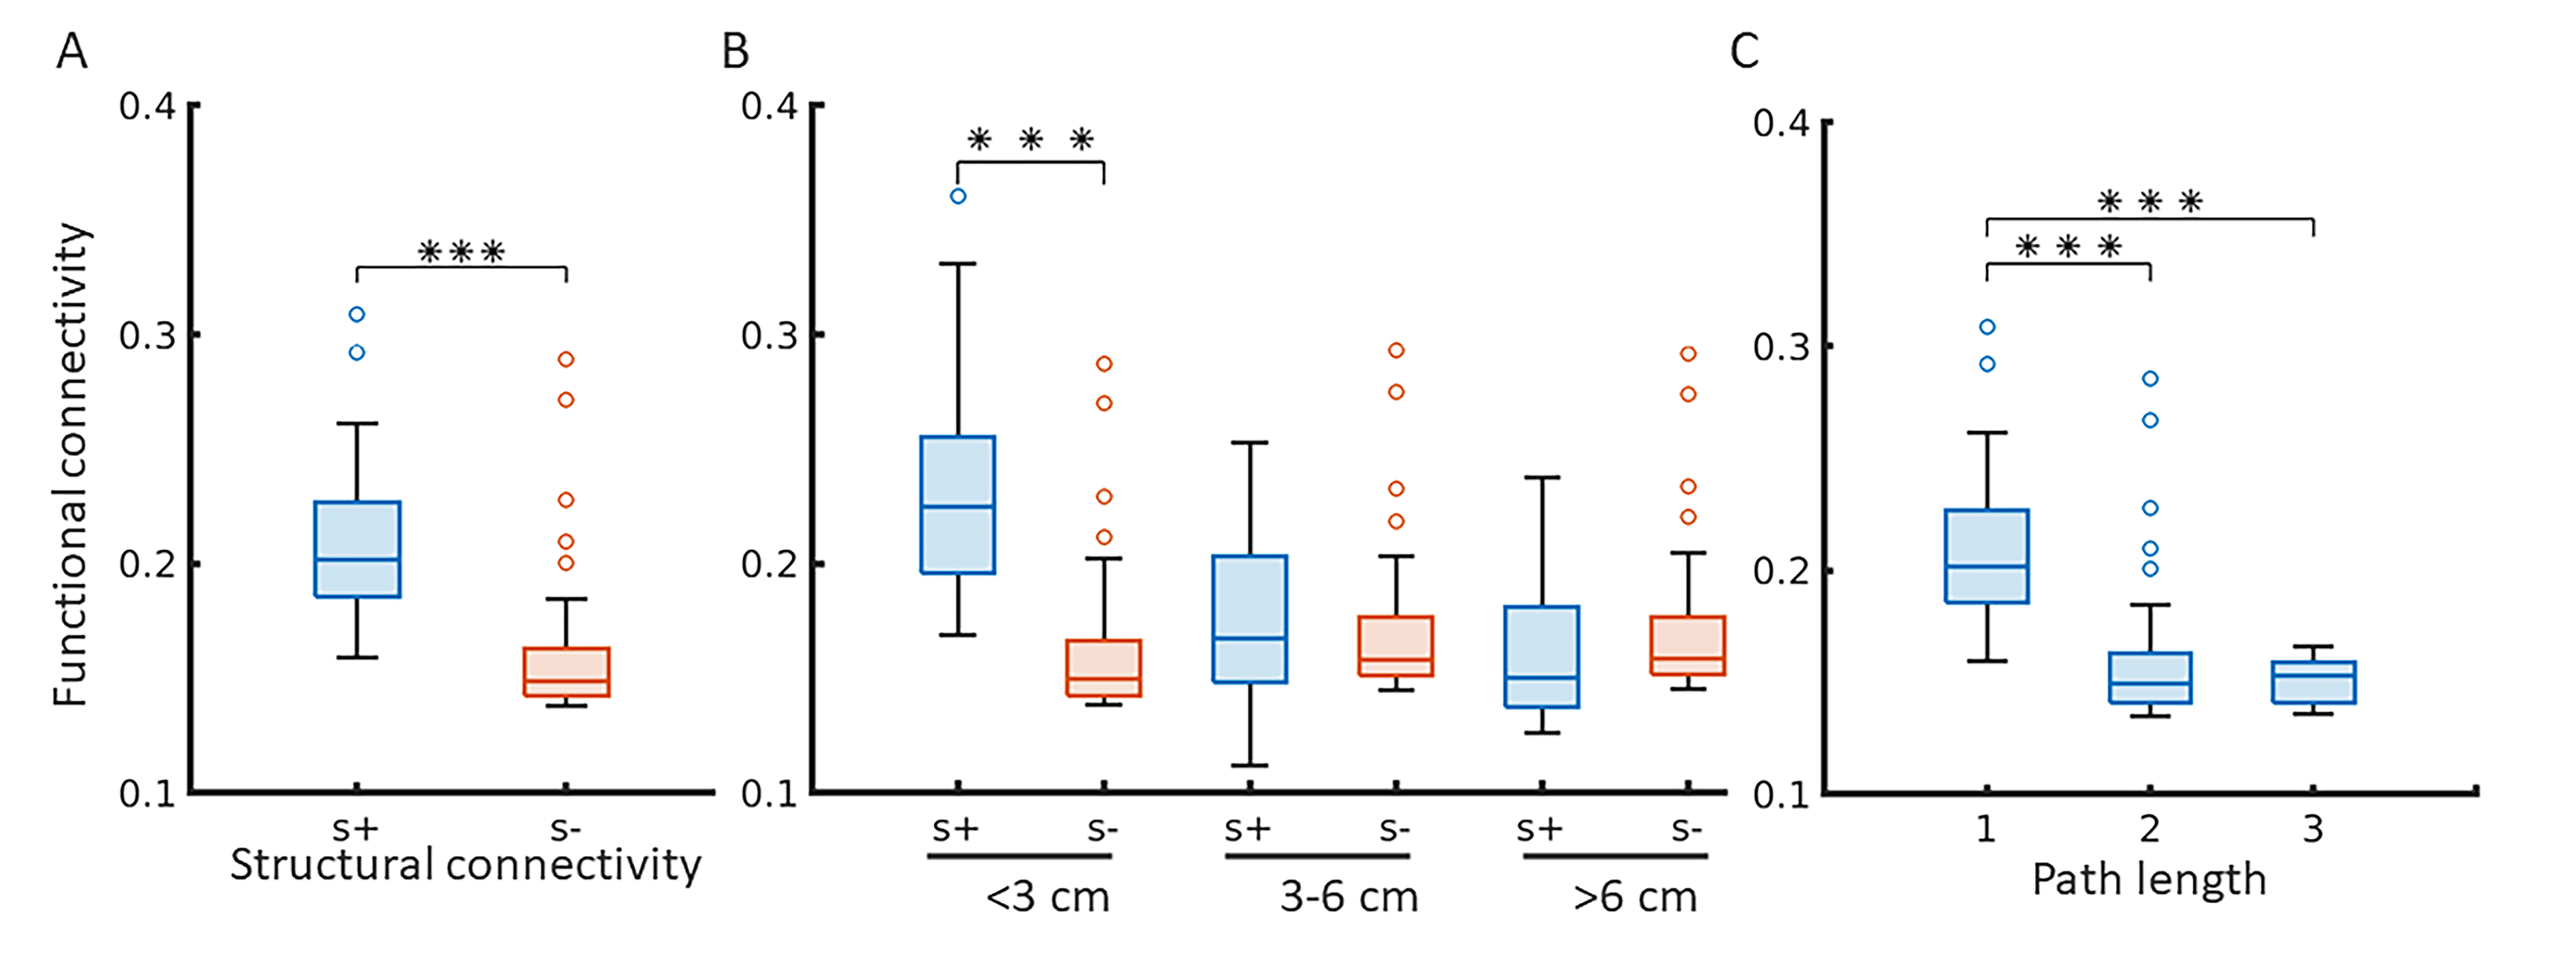
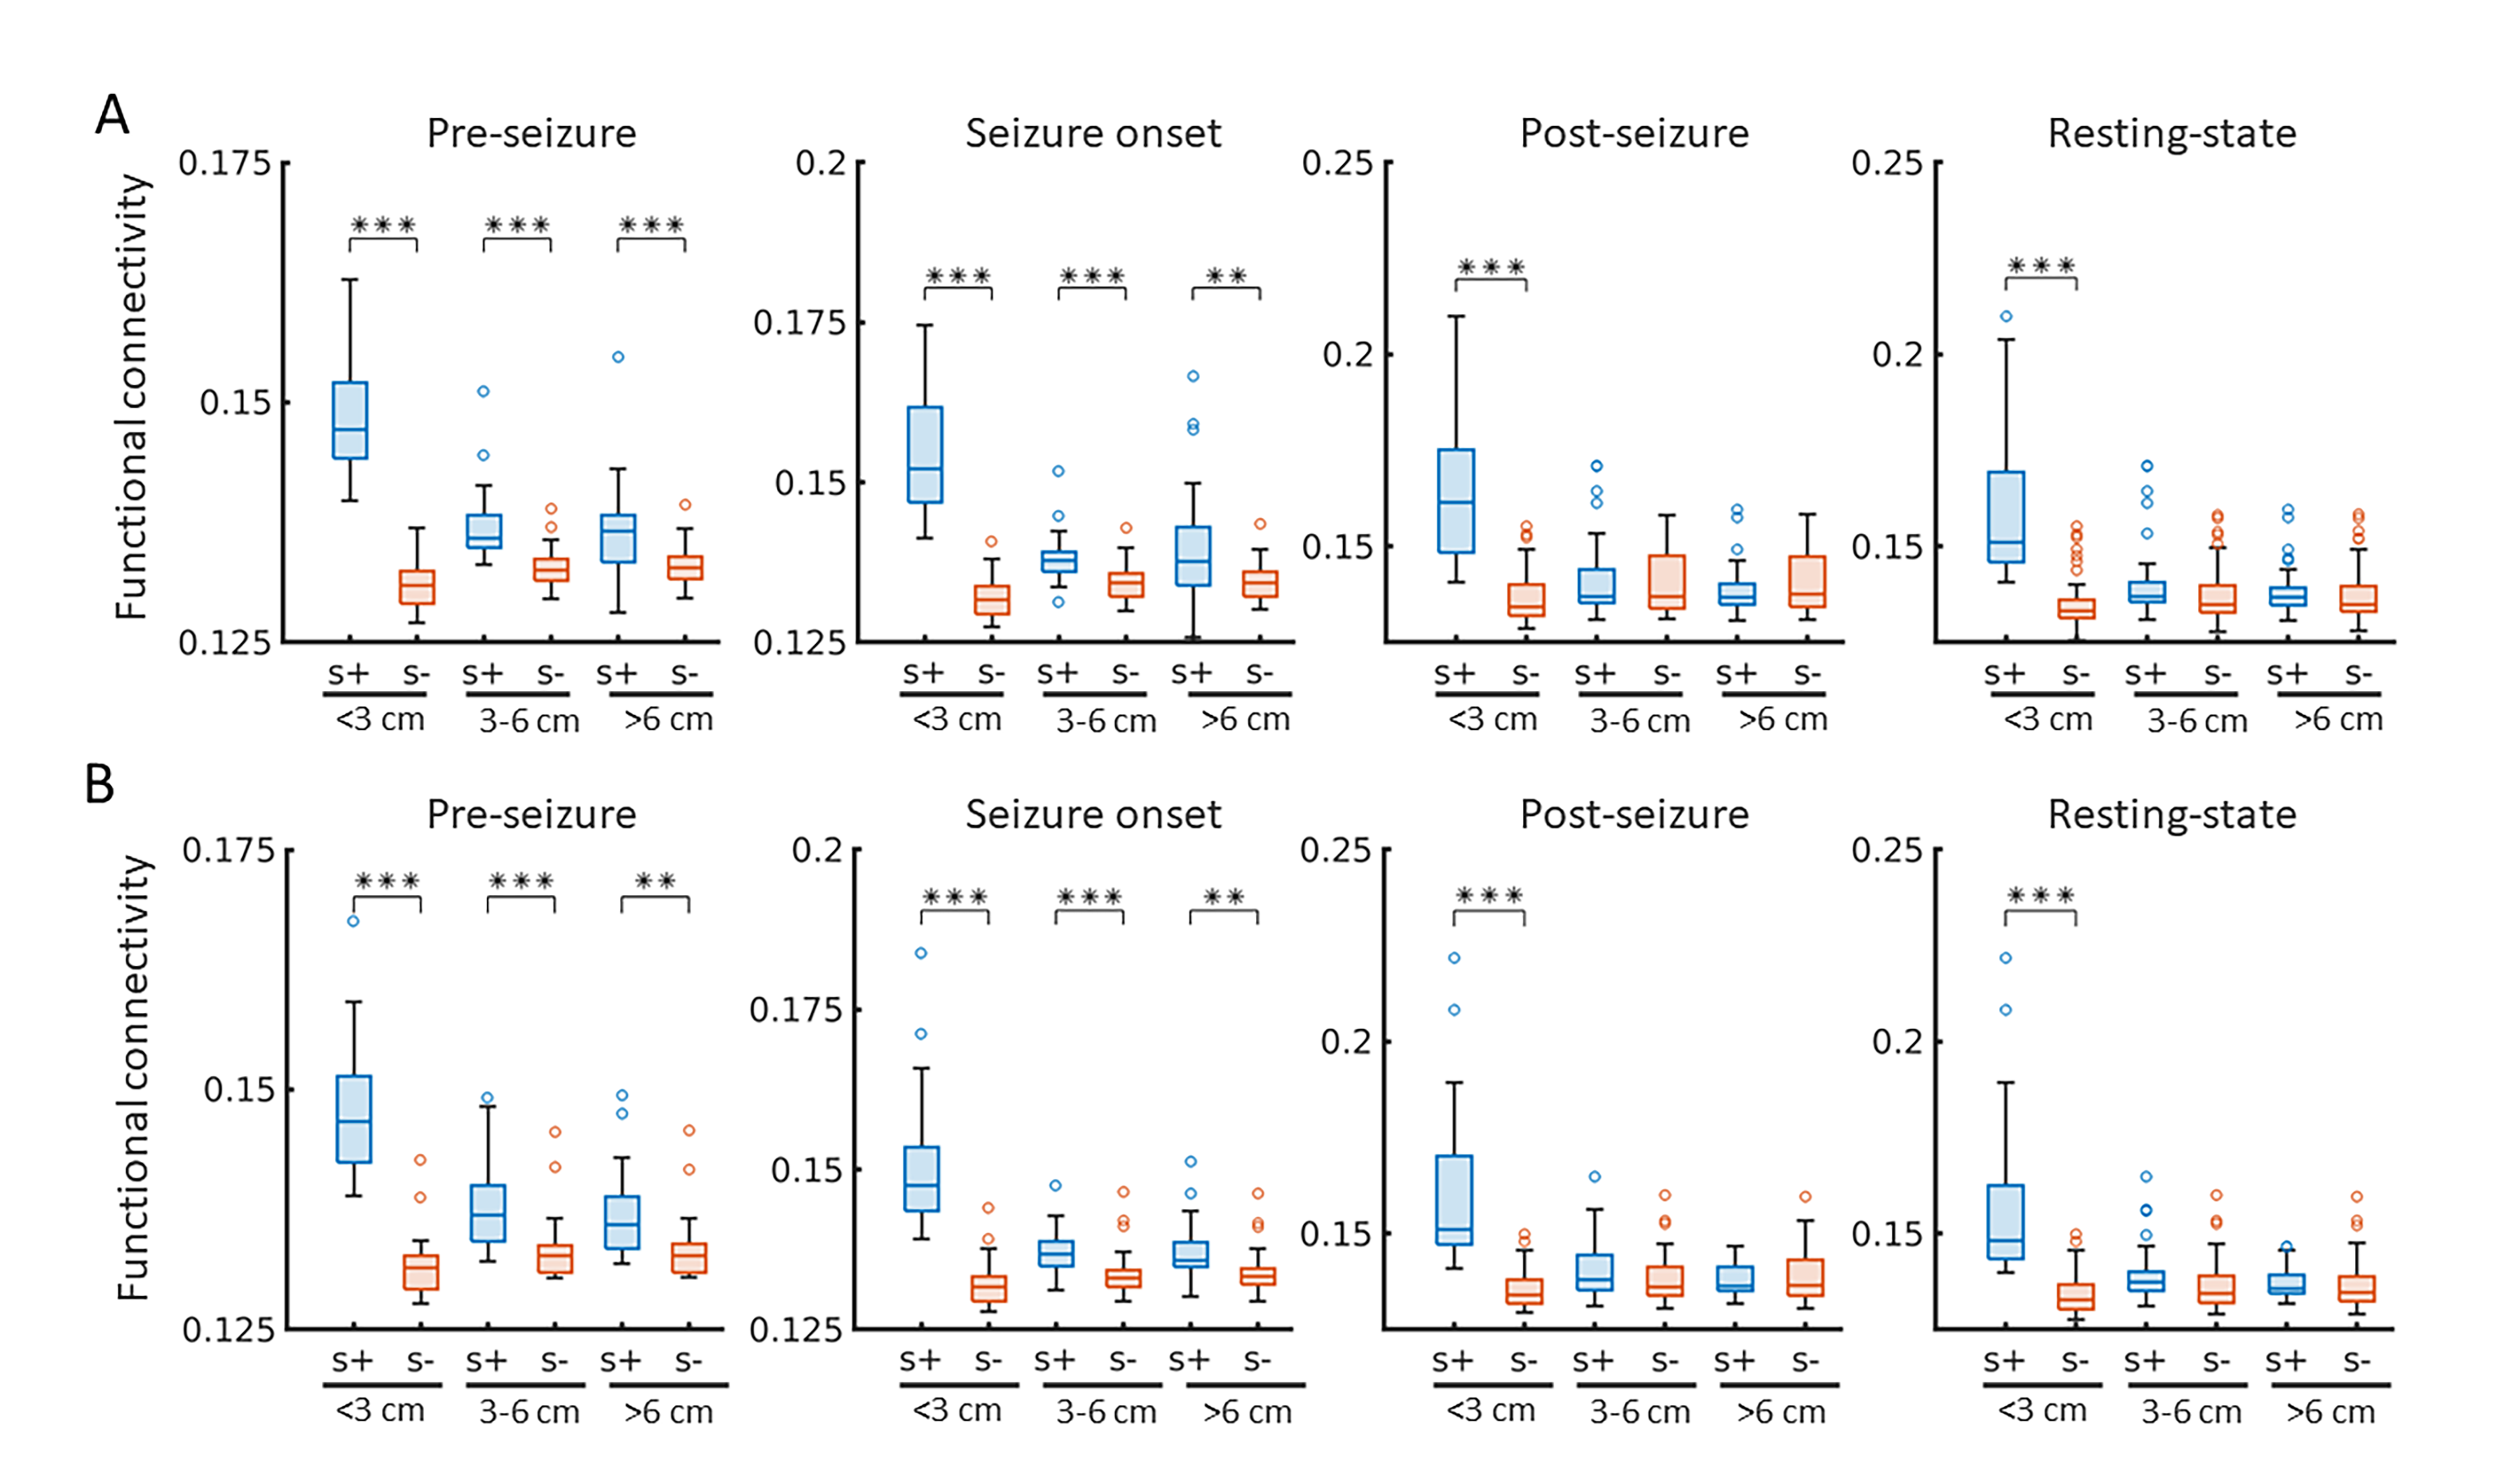
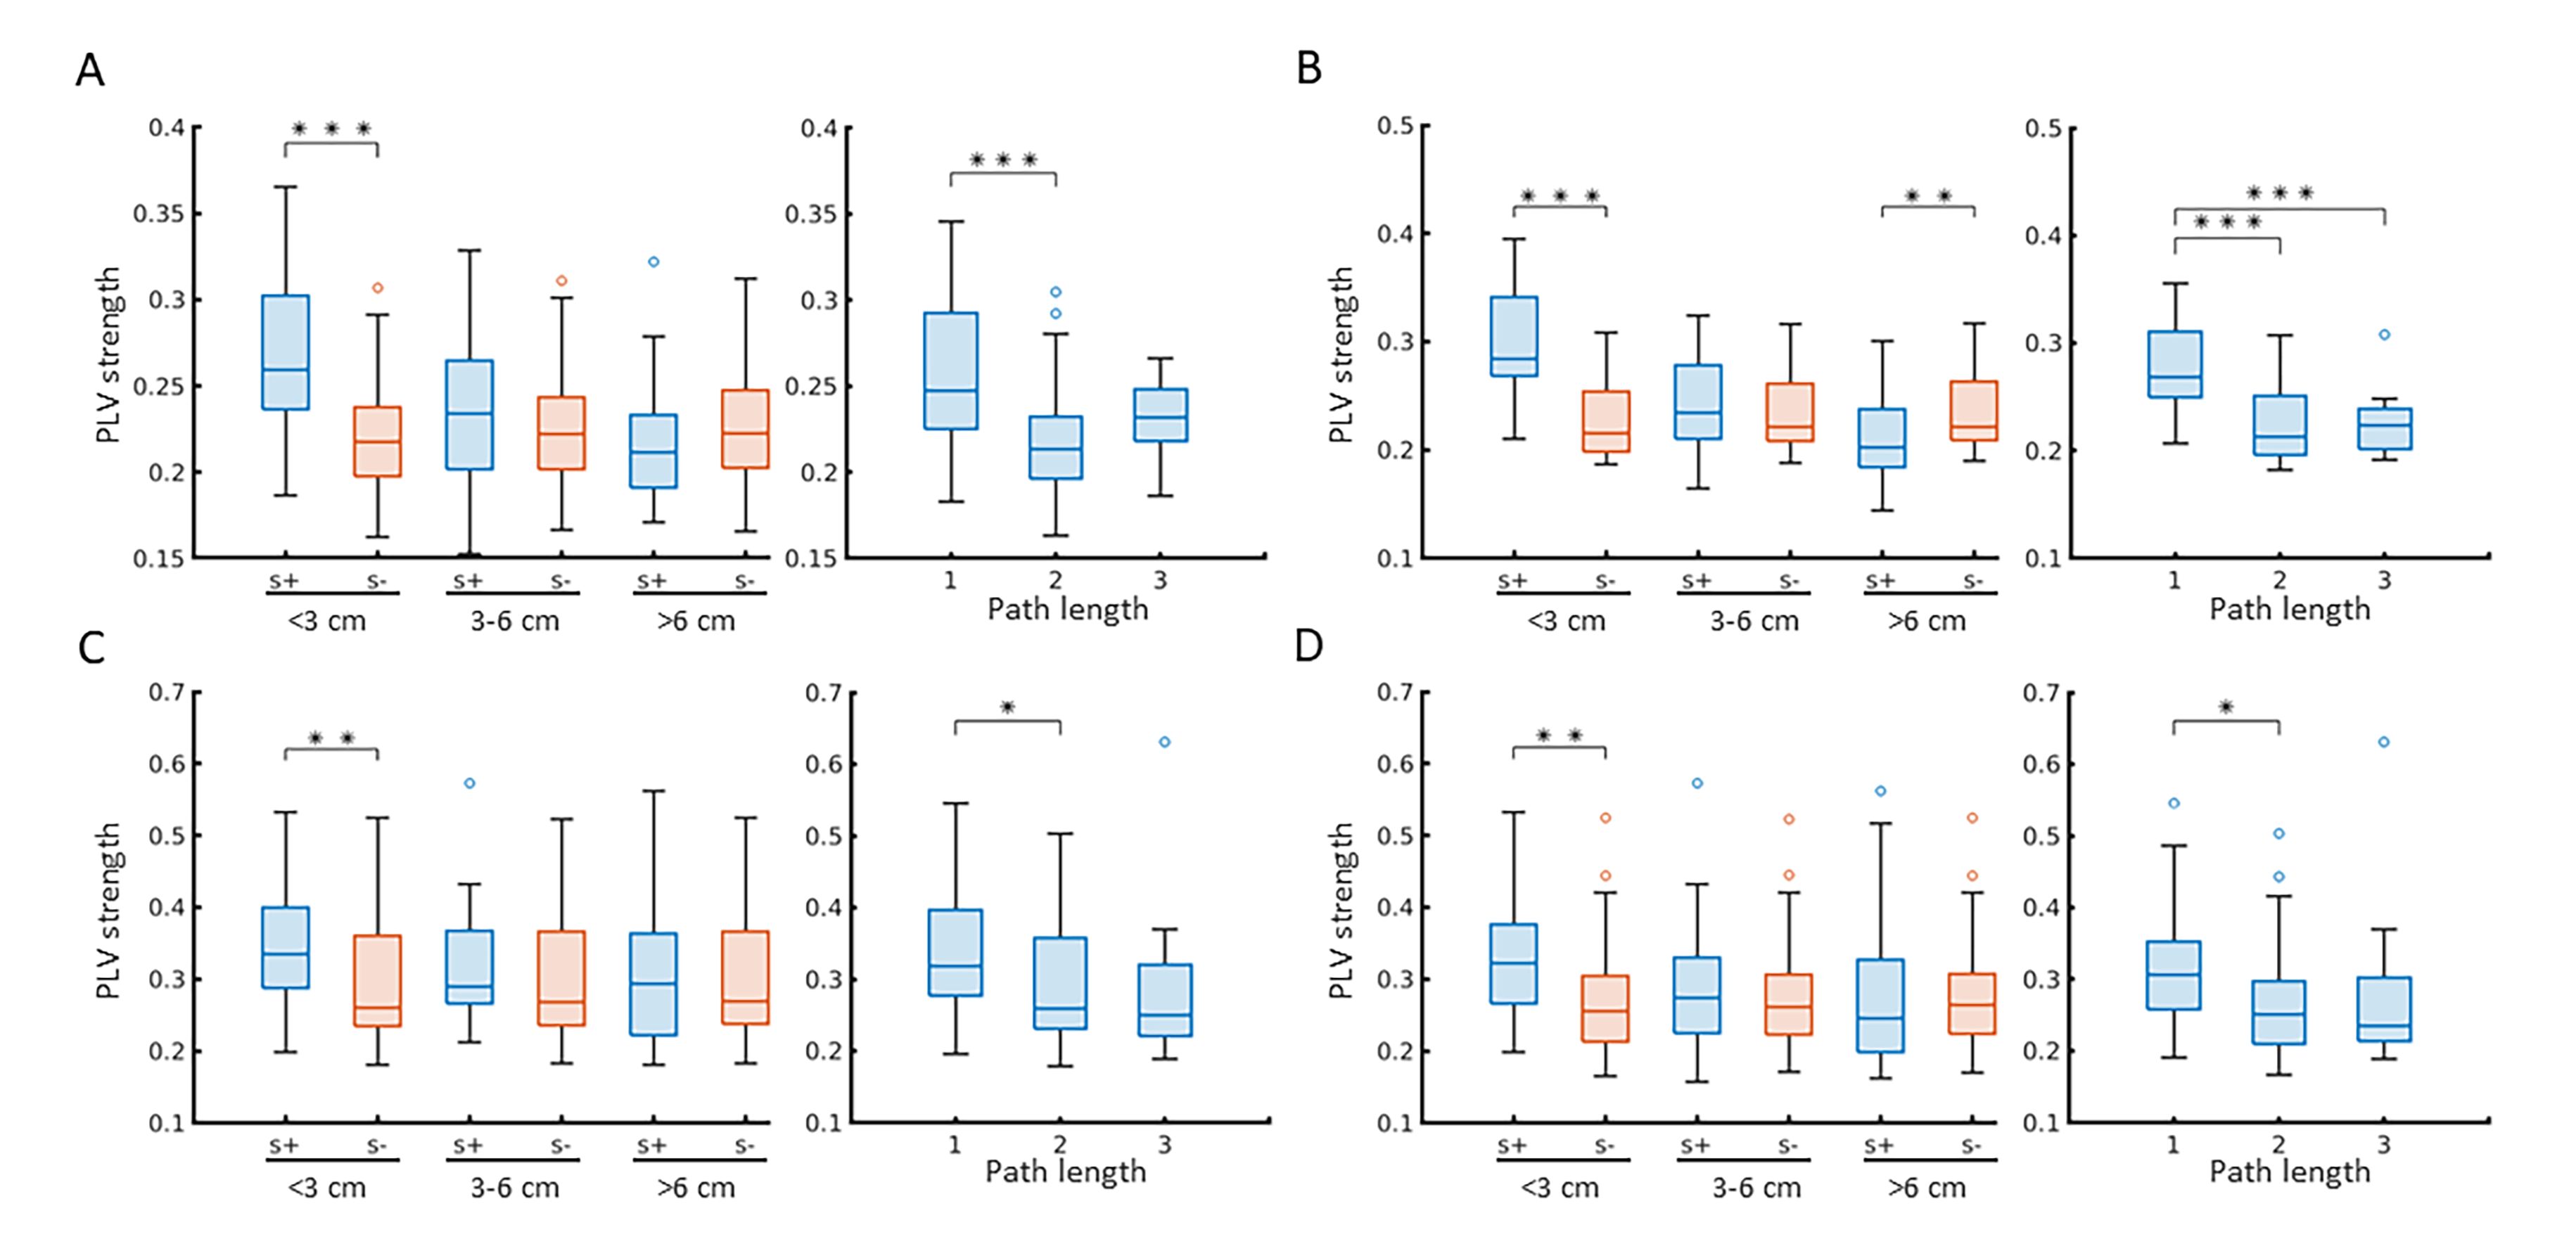
Across all different neuronal activity frequencies, regardless of seizure or resting state, mean functional coherence connectivity between structurally connected nodes was significantly stronger compared to structurally disconnected nodes (Fig. 2A); When taking the inter-node distance into consideration, only structurally connected nodes within short distances (<3 cm) exhibit much higher connectivity strength (Fig. 2B); Node pairs with direct white matter connectivity (path length=1) had significantly higher functional connectivity than those with indirect connections (path lengths longer than 1) (Fig. 2C). Further, for high-frequency electrical signal (ripple and fast ripple) that appears pre-seizure and at seizure onset, structurally connected nodes at longer distances (3-6cm and >6 cm) also exhibit significantly higher connectivity compared to structurally disconnected nodes at the same distance (Fig. 3). The paired nodes with structural connection within short distances or with direct connection also exhibit higher PLV strength (Fig. 4). All of the structural features (structural connectivity, inter-node distance, path length) have exhibited a significant effect on functional coherence connectivity and PLV networks (Table 1).Conclusion
Our study analyzed the relationship between neural electrical activity and white matter connectivity, showing dependence of spectral coherence and phase synchronization on structural features, including structural connectivity, path length, and node distance. These findings highlight the interdependence of functional and structural networks in the human brain.Acknowledgements
N/AReferences
1. Avena-Koenigsberger A, Misic B, Sporns O. Communication dynamics in complex brain networks. Nat Rev Neurosci. 2017;19(1):17-33.
2. Park HJ, Friston K. Structural and functional brain networks: from connections to cognition. Science. 2013;342(6158):1238411.
3. Bota M, Sporns O, Swanson LW. Architecture of the cerebral cortical association connectome underlying cognition. Proc Natl Acad Sci U S A. 2015;112(16):E2093-2101.
4. Yeh FC, Panesar S, Fernandes D, et al. Population-averaged atlas of the macroscale human structural connectome and its network topology. Neuroimage. 2018;178:57-68.
5. Yeh FC. Population-based tract-to-region connectome of the human brain and its hierarchical topology. Nat Commun. 2022;13(1):4933.
6. Englot DJ, Konrad PE, Morgan VL. Regional and global connectivity disturbances in focal epilepsy, related neurocognitive sequelae, and potential mechanistic underpinnings. Epilepsia. 2016;57(10):1546-1557.
7. Mullin JP, Shriver M, Alomar S, et al. Is SEEG safe? A systematic review and meta-analysis of stereo-electroencephalography-related complications. Epilepsia. 2016;57(3):386-401.
8. Englot DJ. A modern epilepsy surgery treatment algorithm: Incorporating traditional and emerging technologies. Epilepsy Behav. 2018;80:68-74.
9. Li G, Jiang S, Chen C, et al. iEEGview: an open-source multifunction GUI-based Matlab toolbox for localization and visualization of human intracranial electrodes. J Neural Eng. 2019;17(1):016016.
10. Destrieux C, Fischl B, Dale A, Halgren E. Automatic parcellation of human cortical gyri and sulci using standard anatomical nomenclature. Neuroimage. 2010;53(1):1-15.
11. van Mierlo P, Papadopoulou M, Carrette E, et al. Functional brain connectivity from EEG in epilepsy: seizure prediction and epileptogenic focus localization. Prog Neurobiol. 2014;121:19-35.
12. Lachaux JP, Rodriguez E, Martinerie J, Varela FJ. Measuring phase synchrony in brain signals. Hum Brain Mapp. 1999;8(4):194-208.
13. Chu CJ, Tanaka N, Diaz J, et al. EEG functional connectivity is partially predicted by underlying white matter connectivity. Neuroimage. 2015;108:23-33.
Figures