3373
Towards an enhanced characterization of white matter pathologies with Q-FiberMapper 2.0
Tommy Boshkovski1, Óscar Peña-Nogales1, Paulo Rodrigues1, Vesna Prčkovska1, and Kire Trivodaliev1
1QMENTA Inc., Boston, MA, United States
1QMENTA Inc., Boston, MA, United States
Synopsis
Keywords: Brain Connectivity, Software Tools
FiberMapper 2.0 facilitates automatic (pre-) processing of MRI data, reconstructs major white matter tracts and derives imaging biomarkers along the tracts sensitive to a wide range of microstructural properties. Additionally, Q-FiberMapper 2.0 implements tract lesion burden analysis which together with the quantitative MR imaging biomarkers could be very useful for early diagnosis, evaluation and monitoring of different neurodegenerative and neuroinflammatory diseases that affect the white matter such as traumatic brain injury, multiple sclerosis, and others.INTRODUCTION
Different brain pathologies, in their early stages of progression, affect specific microstructural properties; thus, early detection of these pathologies requires more specific and sensitive biomarkers. As a result, recent studies1 have investigated the potential for using complementary quantitative MRI (qMRI) measures, which are more sensitive to specific microstructural features, such as myelin water fraction (MWF), quantitative susceptibility mapping (QSM), longitudinal relaxation time (qT1), longitudinal relaxation rate (R1) and others. For example, MWF1 and R12 have been shown to correlate to clinical subtypes of Parkinson’s disease, while QSM has demonstrated promise in identifying biomarkers for Alzheimer’s disease, Parkinson’s disease, and multiple sclerosis, among others1. While multiple qMRI approaches for estimating these quantitative metrics exist, there is a need of connecting them with other MRI techniques to leverage diagnosis.Diffusion MRI allows a non-invasive approach to dissect major white matter tracts and probe the brain microstructural properties. The standard diffusion MRI technique used in the clinical studies is Diffusion Tensor Imaging (DTI), from which one can extract scalar maps, such as fractional anisotropy (FA) and mean diffusivity (MD), which give general information about the white matter microstructure, however, they are not specific to a particular microstructural feature3. For example, it is well known that the FA is influenced by multiple factors including tissue geometry, axonal diameter, fiber density, and the degree of myelination4. These aspects make diffusion a powerful but underused technique.
Q-FiberMapper5 is a diffusion framework for tractography and tractometry that automatically preprocesses MR images, reconstructs 33 major white matter tracts, and derives information about the white matter integrity from the standard DTI scalar maps. In this work, we extend its functionalities by incorporating both automatic processing of qMRI images and automatic extraction of quantitative MRI biomarkers along the major white matter tracts. We also implement a lesion burden analysis on the white matter tracts as a part of the framework. This automatic and joint processing aims at overcoming the limitations and lack of usage of qMRI and diffusion techniques in the clinical routine.
METHODS
The previous implementation of the Q-FiberMapper5 implemented a tailored pre-processing of T1 and diffusion images, segmentation of the 33 major white matter tracts and extraction of standard clinical DTI scalar maps that allow general assessment of white matter integrity. All of the results were then packed into a well-structured, easy to read PDF report.Q-FiberMapper 2.0 introduces qMRI analysis to strengthen the assessment of different white matter pathologies. Aside from the original input (T1w and diffusion MRI), it takes as input a set of weighted images, tags the different modalities automatically, and processes the data to estimate qMRI maps. The processing of the set of weighted images data and, therefore, the estimation of the qMRI maps is done by the methods implemented in qMRILab6, an open-source tool for qMRI analysis. Depending on the qMRI data provided to the framework, the relevant module, as implemented in qMRLab6, is executed to estimate the quantitative maps. Then the estimated maps are coregistered to the diffusion space so that Q-FiberMapper 2.0 can extract the statistics of the qMRI measures along the tract, as well as estimate the qMRI tract profile. Additionally, if there are white matter lesions, Q-FiberMapper using LST-LPA algorithms7, automatically segments the lesions and provides statistics for the tract lesion burden.
RESULTS
Aside from the tract profile and tract statistics computed for the standard DTI-derived measures (MD, FA, number of streamlines), Q-FiberMapper 2.0 also computes additional tract profiles and statistics from the qMRI maps that are more sensitive to the underlying microstructure. Fig. 1 shows an estimated tract profile based on the T1 and FA values along the arcuate fasciculus.Fig. 2 shows an example statistic of the lesion burden on the right inferior fronto-occipital fasciculus. The tract is shown to be in visual agreement with the lesion expanding on its vicinity.
DISCUSSION and CONCLUSION
We proposed an update of the Q-FibberMapper to enhance characterization of white matter pathologies by means of quantitative maps. Results suggest the potential of this approach for characterization of white matter pathologies such as Traumatic brain injury, Alzheirmer disease, Parkinson’s disease, Multiple Sclerosis. It further makes qMRI easily accessible to clinicians, by allowing them to evaluate the qMRI maps at tract level.Acknowledgements
No acknowledgement found.References
- Seiler, Alexander, et al. "Multiparametric quantitative MRI in neurological diseases." Frontiers in Neurology 12 (2021): 640239.
- Boshkovski, Tommy, et al. "The Myelin‐Weighted Connectome in Parkinson's Disease." Movement Disorders 37.4 (2022): 724-733.
- Boshkovski, Tommy, et al. "The R1-weighted connectome: complementing brain networks with a myelin-sensitive measure." Network Neuroscience 5.2 (2021): 358-372.
- Jones, Derek K., Thomas R. Knösche, and Robert Turner. "White matter integrity, fiber count, and other fallacies: the do's and don'ts of diffusion MRI." Neuroimage 73 (2013): 239-254.
- Boshkovski, Tommy, et al. "Q-FiberMapper-A framework for tractography and tractometry of clinical data." Proc. Intl. Soc. Mag. Reson. Med. 30 (2022)
- Karakuzu, Agah, et al. "qMRLab: Quantitative MRI analysis, under one umbrella." Journal of Open Source Software 5.53 (2020): 2343.
- Schmidt, Paul. Bayesian inference for structured additive regression models for large-scale problems with applications to medical imaging. Diss. lmu, 2017.
Figures
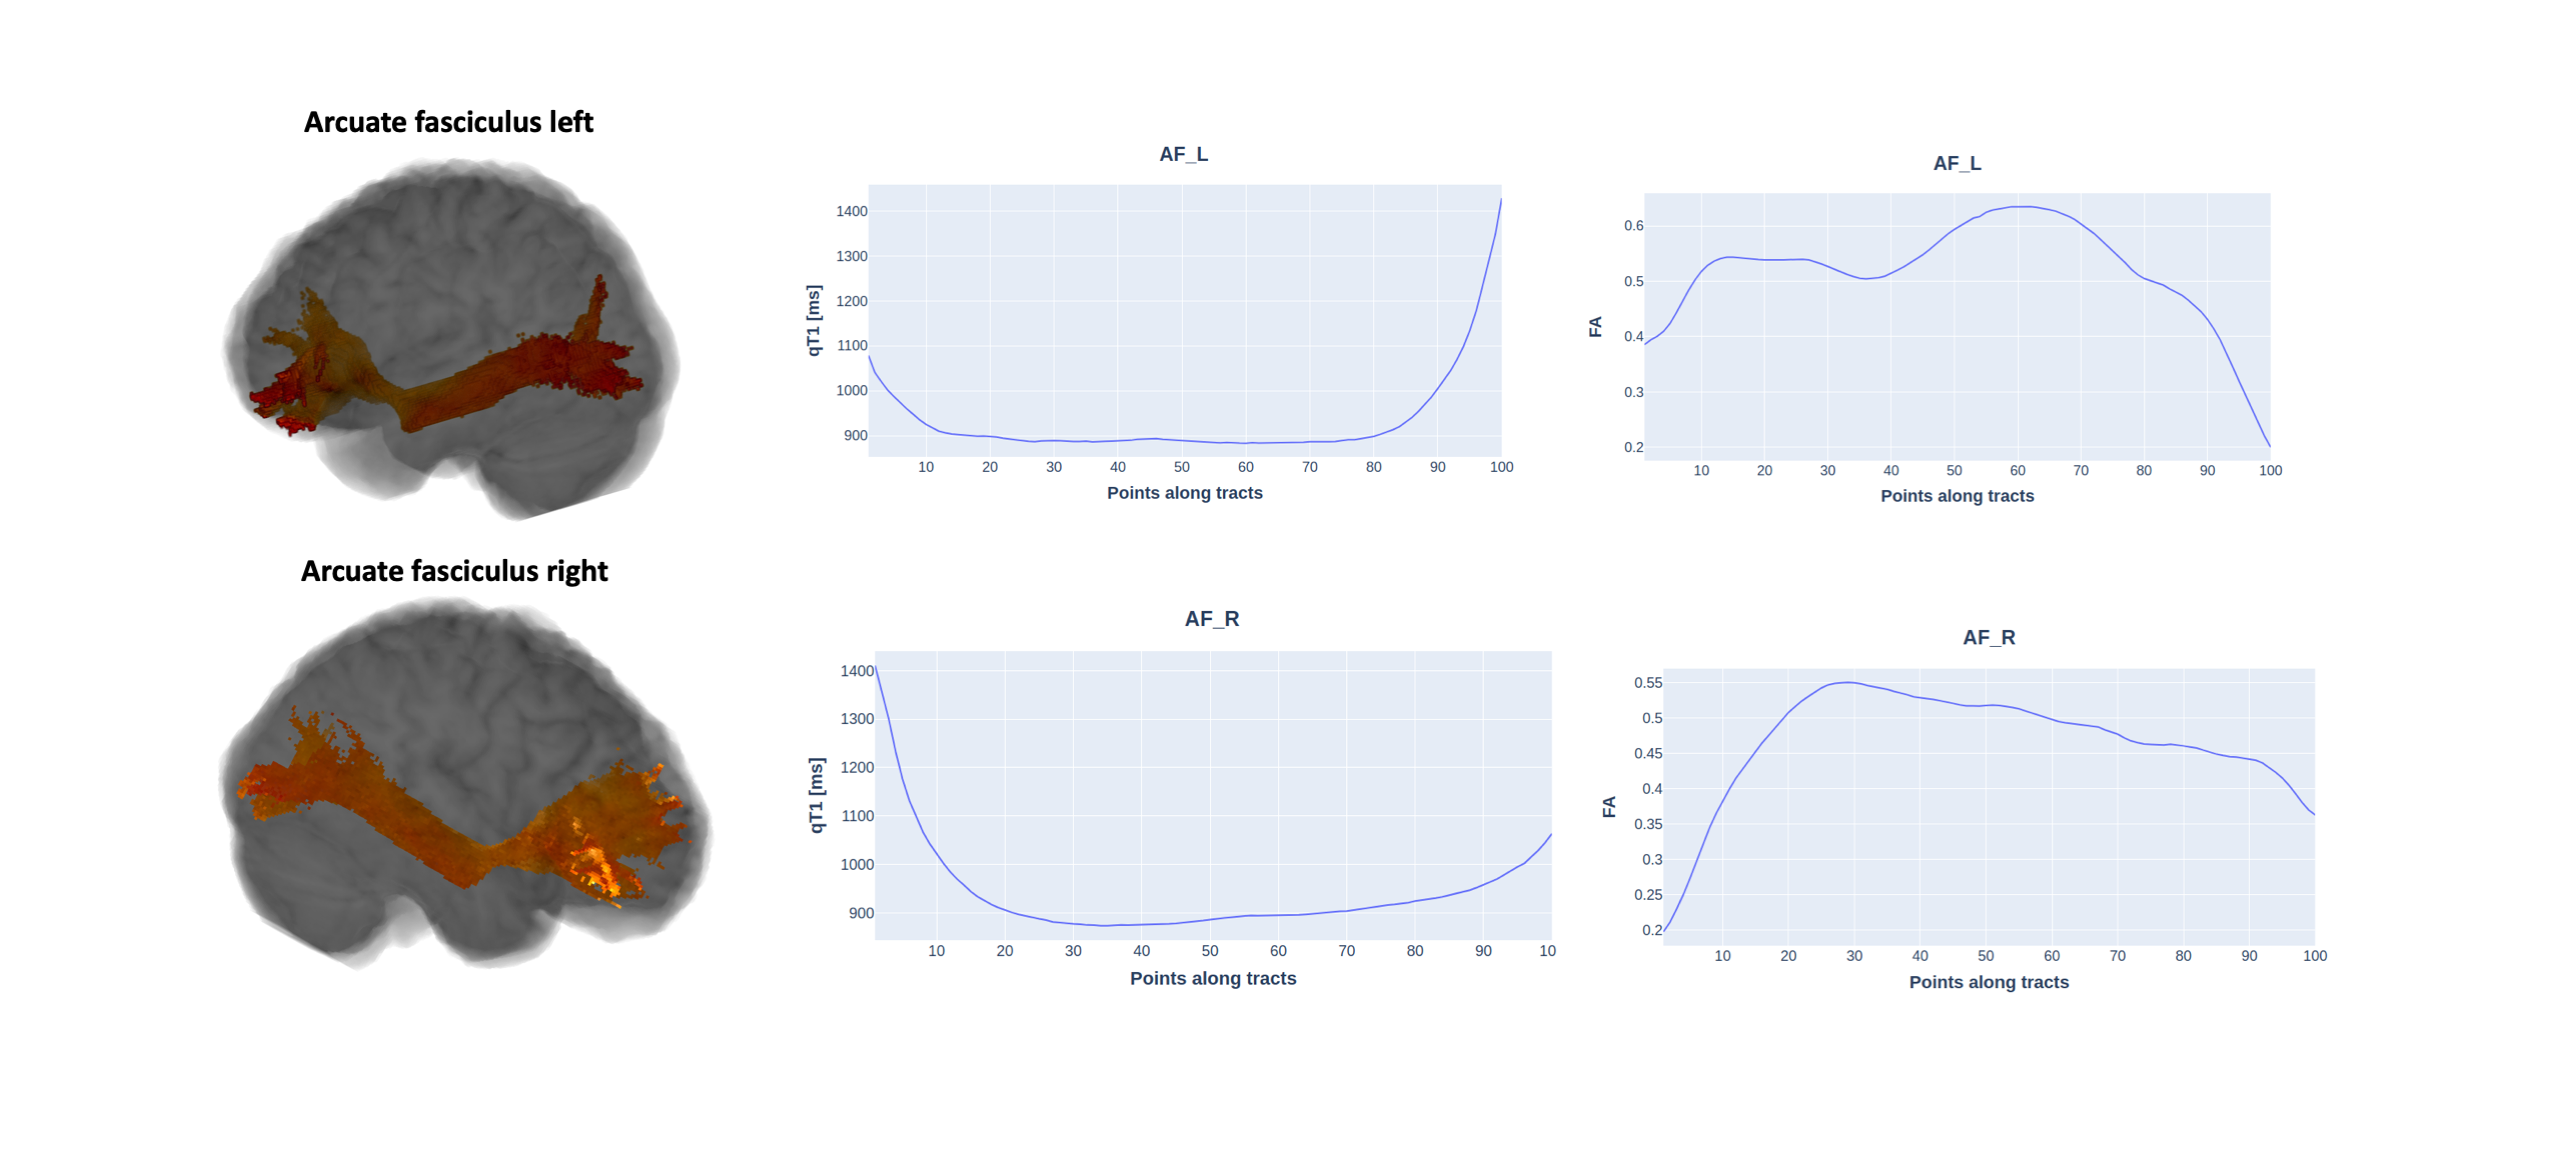
Fig. 1. Example of the reconstruction of the left and right parts of arcuate fasciculus (first and second row respectively) and its tract profiles computed for the qT1 (middle column) and FA (right column). The tract profile is computed as a weighted average of the FA and T1 values at 100 points along the tract.
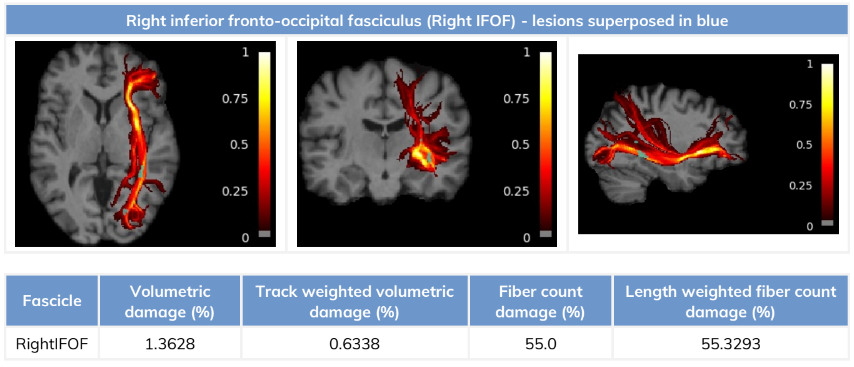
Fig. 2. Example of the lesion burden on the inferior fronto-occipital fasciculus (IFOF). The color bar associated with the tract reflects the fiber density, while the blue marks overlaid on the tract is represented lesions.
DOI: https://doi.org/10.58530/2023/3373