3372
Associations of white matter connections with neurocognitive development in healthy children1Diagnostic Imaging, St. Jude Children's Research Hospital, Memphis, TN, United States
Synopsis
Keywords: Brain Connectivity, Normal development, Connectome
We investigated the associations between structural connectivity and neurocognitive development in healthy children using MRI and behavioral data from 42 subjects belonging to Lifespan Human Connectome Project Development dataset. Diffusion MRI data were analysed using multi-shell multi-tissue constrained spherical deconvolution model to compute fiber orientation distribution functions before probabilistic fiber tracking was performed to obtain whole brain tractograms. Connectivity matrices were computed based on streamline density using nodes from HCP-MMP1 parcellation. Multiple significant correlations between connectivity and cognitive scores measuring working memory, processing speed and executive functioning were identified in this study.Purpose
The human brain undergoes dramatic changes in structural and functional organization throughout childhood. Understanding brain behavior relationships, as the brain develops, provides critical insights on the complex dynamic links between structure and function of brain structures. Structural connectivity has been widely used in studying brain structural organization via quantifying inter-region connections in white matter with the help of advanced diffusion MRI models. In this study, we investigated the associations between structural connectivity and cognitive development in healthy children using the Lifespan Human Connectome Project development (HCP-D) dataset.1 The identified relations between white matter connections and neurocognitive measures can be used to establish reference brain behavior relations in typical brain development which could be useful in identifying altered relations in pathological conditions.Methods
We included 42 healthy subjects (21 female) from the HCP-D dataset in the age range of 8-14 years. MRI data consisting of T1w images and diffusion MRI were used for this study. The imaging protocol includes the following parameters: Siemens 3T scanner, T1w: TR/TI = 2500/1000 ms, TE = 1.8/3.6/5.4/7.2 ms, flip angle of 8 deg, diffusion MRI: 2 shells (b = 1500 and 3000 s/mm2) and we used volumes from 99 gradient directions acquired in reverse phase encoding AP-PA directions. Neuropsychological scores included in this study are NIH Toolbox Pattern Comparison Processing Speed Test which is a measure of speed of processing (PS), List Sorting Working Memory Test which is a measure of working memory (WM) and Dimensional Change Card Sort Test which is a measure of executive cognitive flexibility (EF).Structural connectivity computation involved generating structural connectomes based on MRtrix3 using a multi-shell multi-tissue constrained spherical deconvolution (MSMT-CSD) model.2 Diffusion MRI data was processed using the MRtrix3 connectome pipeline which includes preprocessing, MSMT-CSD reconstruction followed by probabilistic tractography, and computing connectome matrices based on weighted streamline density.3 Parcellations for computing the connectome consisted of 380 regions from the HCP-MMP1 atlas.4 Eighty-two regions were identified from Glasser et al corresponding to the most highly activated regions in the 2BK-0BK task and connectivity matrices of 82 x 82 were extracted for every subject.4
Statistical analyses were performed using Python statsmodels5 to calculate correlations between neurocognitive scores and the connectome edges. Spearman correlation coefficients were calculated by correcting the connectome values for age. Age corrected scores were used for neurocognitive measures from NIH toolbox. The population included an equal number of males and females, alleviating a separate need for sex correction. We have not corrected the p-values for multiple comparison corrections owing to the small number of subjects and larger number of regions for this initial analysis. We plan to include the p-value correction in the follow-up study where a larger number of subjects are to be added from the HCP-D dataset.
Results
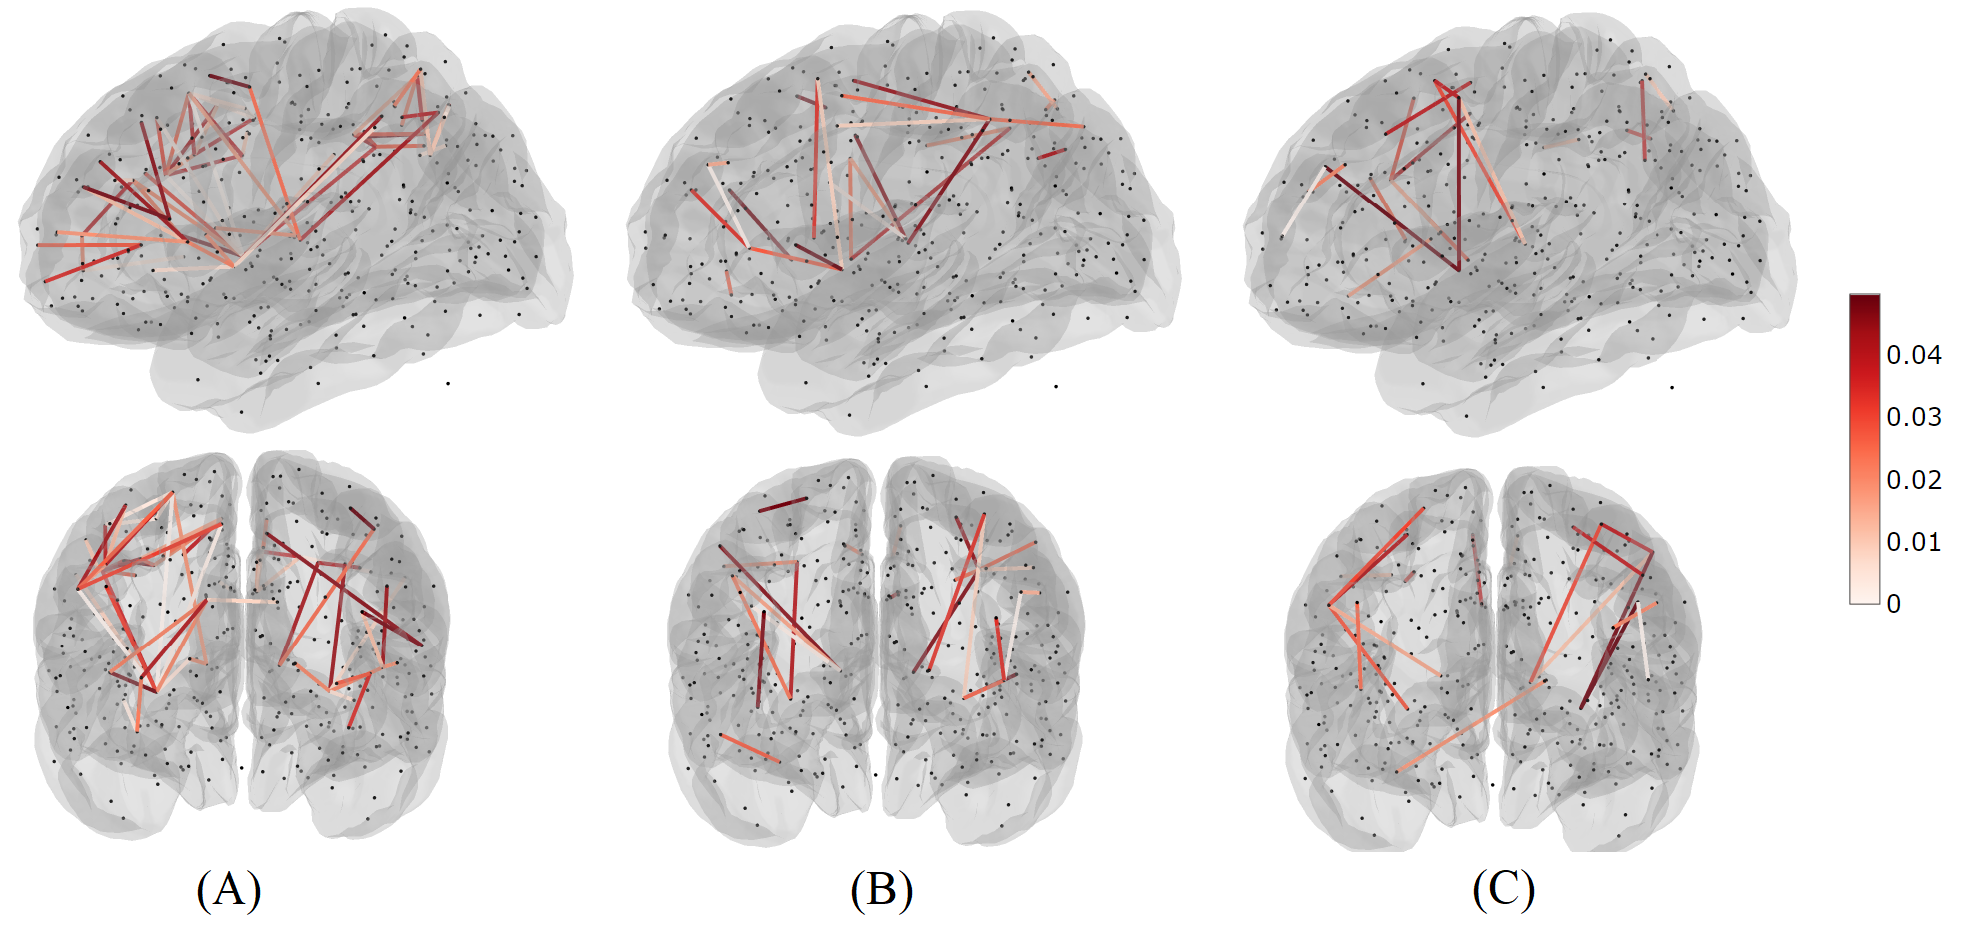
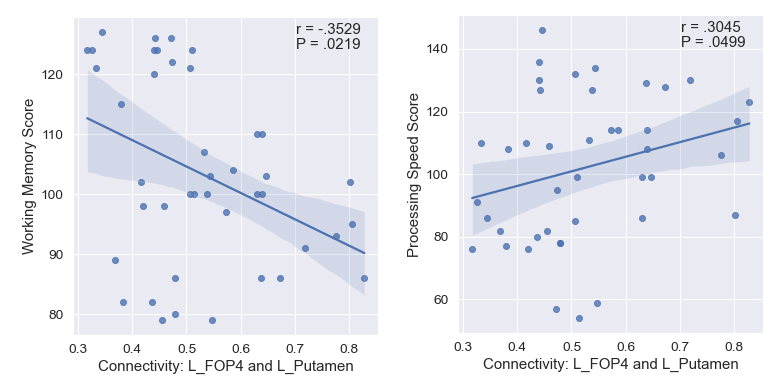
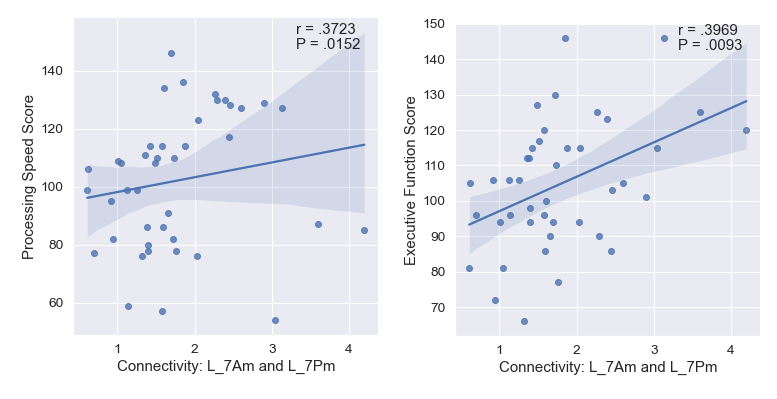
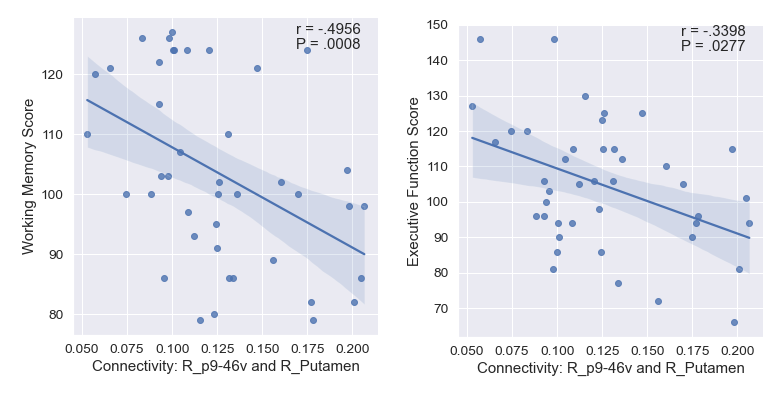
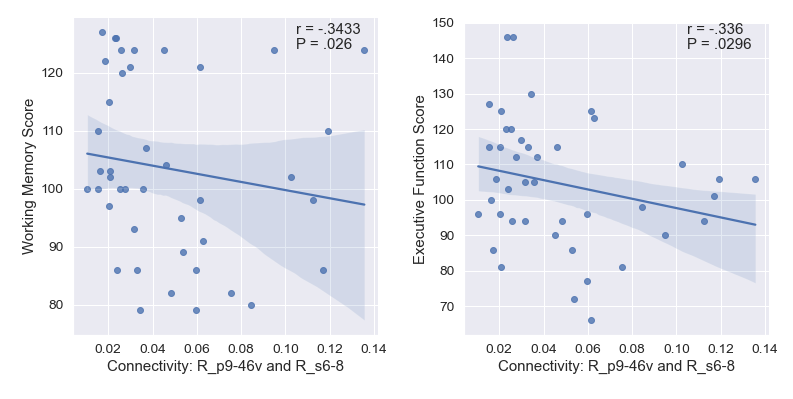
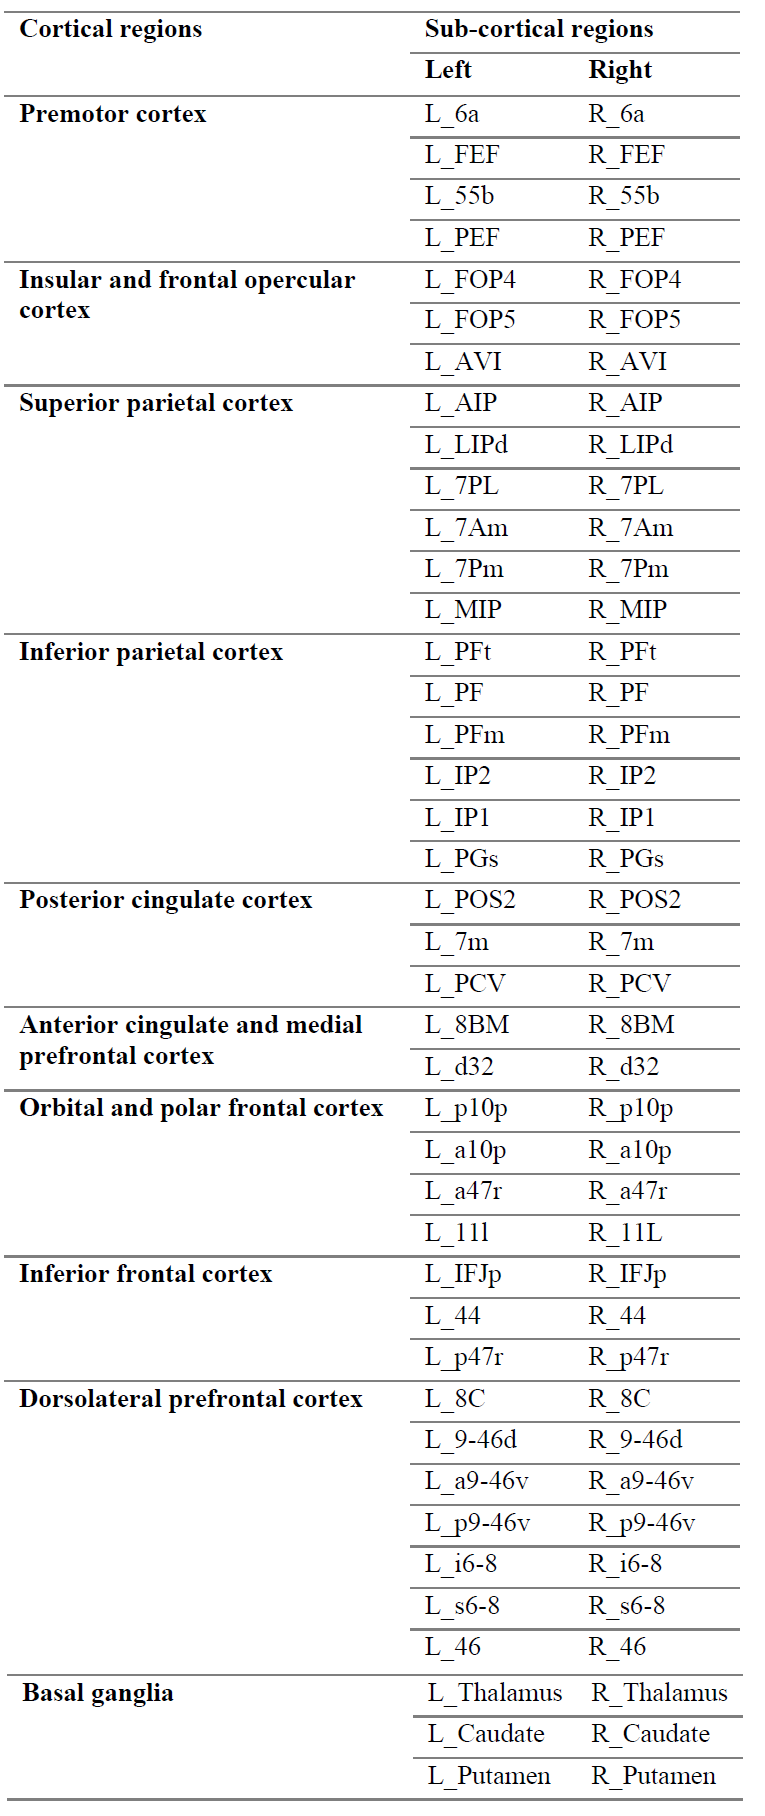
The list of 82 regions included in this study are listed in Table 1 along with the cortical region to which it belongs. We observed 61 significant negative correlations between connectivity and WM, 24 significant positive correlations for PS, and 18 significant correlations (9 positive) for EF (uncorrected P <= 0.05). The significant correlations were illustrated in Figure 1 with top and bottom rows showing the edges in a glass brain in sagittal and coronal views respectively. Figure 1A shows the edges which demonstrated significant relationships with the WM score. Similarly, Figure 1B and Figure 1C show edges significantly related to PS and EF scores respectively. There were a few edges which showed common relationships across the cognitive scores. For instance, the edge connecting L_FOP4 and L_Putamen was correlated significantly to both WM and PS scores (Figure 2). Additionally, the edge connecting L_Am and L_7Pm was correlated significantly to both PS and EF scores (Figure 3) and edges connecting R_p9-46v to R_Putamen and R_p9-46v to R_s6-8 were correlated significantly to both WM and PS scores (Figure 4-5).Discussion
The specific structural connectivity network being investigated in this study was determined based on fMRI results showing increased activation during a working memory task. Therefore, it is not surprising that the largest number of significant correlations were with the WM performance. The second most common correlation was with measures of PS, which is necessary to support WM performance. WM is part of the larger domain of EF and the correlations were similar but to a lesser degree. While the directionality of the correlations was as anticipated for PS with stronger connectivity corresponding to faster processing speed, the directionality was reversed for WM and mixed for EF. This may be due to a more efficient and more widely distributed network requiring less connectivity strength to perform a similar task. This will require additional investigation with a larger sample from the HCP-D dataset.Conclusion
The findings in this study demonstrated significant associations between white matter connections and three cognitive scores measuring working memory, processing speed and executive functioning. The findings suggest potential links between structural connectivity and cognition in children which needs to be studied further including larger population and could potentially be used to assess pediatric patients with medical conditions.Acknowledgements
No acknowledgement found.References
1. Harms MP, Somerville LH, Ances BM, Andersson J, Barch DM, Bastiani M, Bookheimer SY, Brown TB, Buckner RL, Burgess GC, Coalson TS, Chappell MA, Dapretto M, Douaud G, Fischl B, Glasser MF, Greve DN, Hodge C, Jamison KW, Jbabdi S, Kandala S, Li X, Mair RW, Mangia S, Marcus D, Mascali D, Moeller S, Nichols TE, Robinson EC, Salat DH, Smith SM, Sotiropoulos SN, Terpstra M, Thomas KM, Tisdall MD, Ugurbil K, van der Kouwe A, Woods RP, Zöllei L, Van Essen DC, Yacoub E. Extending the Human Connectome Project across ages: Imaging protocols for the Lifespan Development and Aging projects. Neuroimage. 2018 Dec;183:972-984.
2. B. Jeurissen, J.-D. Tournier, T. Dhollander, A. Connelly, and J. Sijbers. Multi-tissue constrained spherical deconvolution for improved analysis of multi-shell diffusion MRI data. NeuroImage, 103 (2014), pp. 411–426.
3. J.-D. Tournier, R. E. Smith, D. Raffelt, R. Tabbara, T. Dhollander, M. Pietsch, D. Christiaens, B. Jeurissen, C.-H. Yeh, and A. Connelly. MRtrix3: A fast, flexible and open software framework for medical image processing and visualisation. NeuroImage, 202 (2019), pp. 116–37.
4. Glasser, M. F., Coalson, T. S., Robinson, E. C., Hacker, C. D., Harwell, J., Yacoub, E., et al. (2016). A multi-modal parcellation of human cerebral cortex. Nature, 1–11.
5. Seabold, Skipper, and Josef Perktold. “statsmodels: Econometric and statistical modeling with python.” Proceedings of the 9th Python in Science Conference. 2010.
Figures