3370
Mapping the individual human cortex using multidimensional MRI and unsupervised learning1The Johns Hopkins Hospital, Baltimore, MD, United States, 2National Institute on Aging, Baltimore, MD, United States, 3University of Washington, Seattle, WA, United States, 4National Institute of Child Health and Human Development, Bethesda, MD, United States
Synopsis
Keywords: Gray Matter, Machine Learning/Artificial Intelligence
Histology-based cellular composition and tissue architecture provide the biological basis for the brain’s cytoarchitectonic areas and for characterizing neuropathology. Noninvasive methods to assess cortical cyto- and myeloarchitectonic features are therefore urgently needed. In an ex vivo human brain study, we used multidimensional diffusion-relaxation MRI to investigate changes in spectral signatures with cortical depth. We designed an unsupervised segmentation procedure that captures this information and provides cortical laminar maps, which were co-registered to histological images and compared. The ability to map cortical cytoarchitectonic features noninvasively makes multidimensional MRI a promising tool for studying whole-brain cortical organization.Introduction
Gray matter (GM) architecture and neuroanatomical regions are largely defined by the cortical layers, which play a critical role in development and connectivity, and which affect brain function and pathology. However, current noninvasive techniques for characterizing the GM laminar composition remain inadequate.1 Although MRI currently cannot provide the exquisite microscopic resolution that optogenetic methods like Brainbow do,2 chemical and microstructural information encoded simultaneously via relaxation (T1 and T2) and diffusion mechanisms provides a wealth of sub-voxel morphological and compositional features.3,4 Recent advances in multidimensional MRI yield high-dimensional image data, in which each voxel may contain a 2- or higher dimensional distribution encoding the correlation of the investigated MR properties.To date, defining cortical lamina is only possible cytologically. We hypothesize here that voxelwise multidimensional T1-T2-diffusion distributions change across the width of the human cortex, and that these changes correspond to the known laminar structure. We propose the use of a modified Wasserstein distance, which arises from the idea of optimal mass transport,5 to be used as a novel distance measure between multidimensional spectra. Based on this distance measure, we then design and implement an unsupervised segmentation procedure to derive the cortical layers from multidimensional MRI data.
Methods
We investigated fixed ex vivo cerebral cortical tissue specimens without any known pathology derived from three control brain donors (ages 48,30,83 years). Multidimensional MRI T1-T2, T1-diffusion (T1-MD), and T2-MD data with 56, 302, and 302 images, respectively, using an inversion-recovery diffusion EPI sequence, were acquired at 200µm isotropic resolution on a 7T Bruker MRI scanner according to a previously published sampling scheme.6 Data were denoised,7 and then processed as previously described.8,9 Tissue specimens were then sectioned serially into 5µm-thick sections at 100µm intervals. Sections were Nissl stained to visualize cell nuclei and were used to train a deep learning convolutional neural network (DenseNet, HALO AI, New Mexico, USA) for histological tissue classification into cortical regions based on the expression patterns of the different layers: layer I (molecular layer), layer II (external granular layer), layer III (external pyramidal layer), layer IV (Internal granular layer), layer V (internal pyramidal) and layer VI (multiform layer). The histological and MRI datasets were co-registered using previously published methods.8All voxelwise T1-T2, T1-MD, and T2-MD spectra were smoothed using a Gaussian filter with a small offset added such that the signals were all strictly positive. For each subject, a within-subject reference density was calculated from the relaxometry-diffusometry spectra across all voxels by computing the Euclidean mean. Pairwise linear optimal transport (LOT) distances were computed5 for each spectrum $$$\Phi_{N}$$$ with respect to this common reference $$$\Phi_{0}$$$ for all $$$N$$$ voxels across the three-dimensional volume within each individual high-dimensional brain image. All computations were performed in MATLAB (Mathworks, USA).
Results
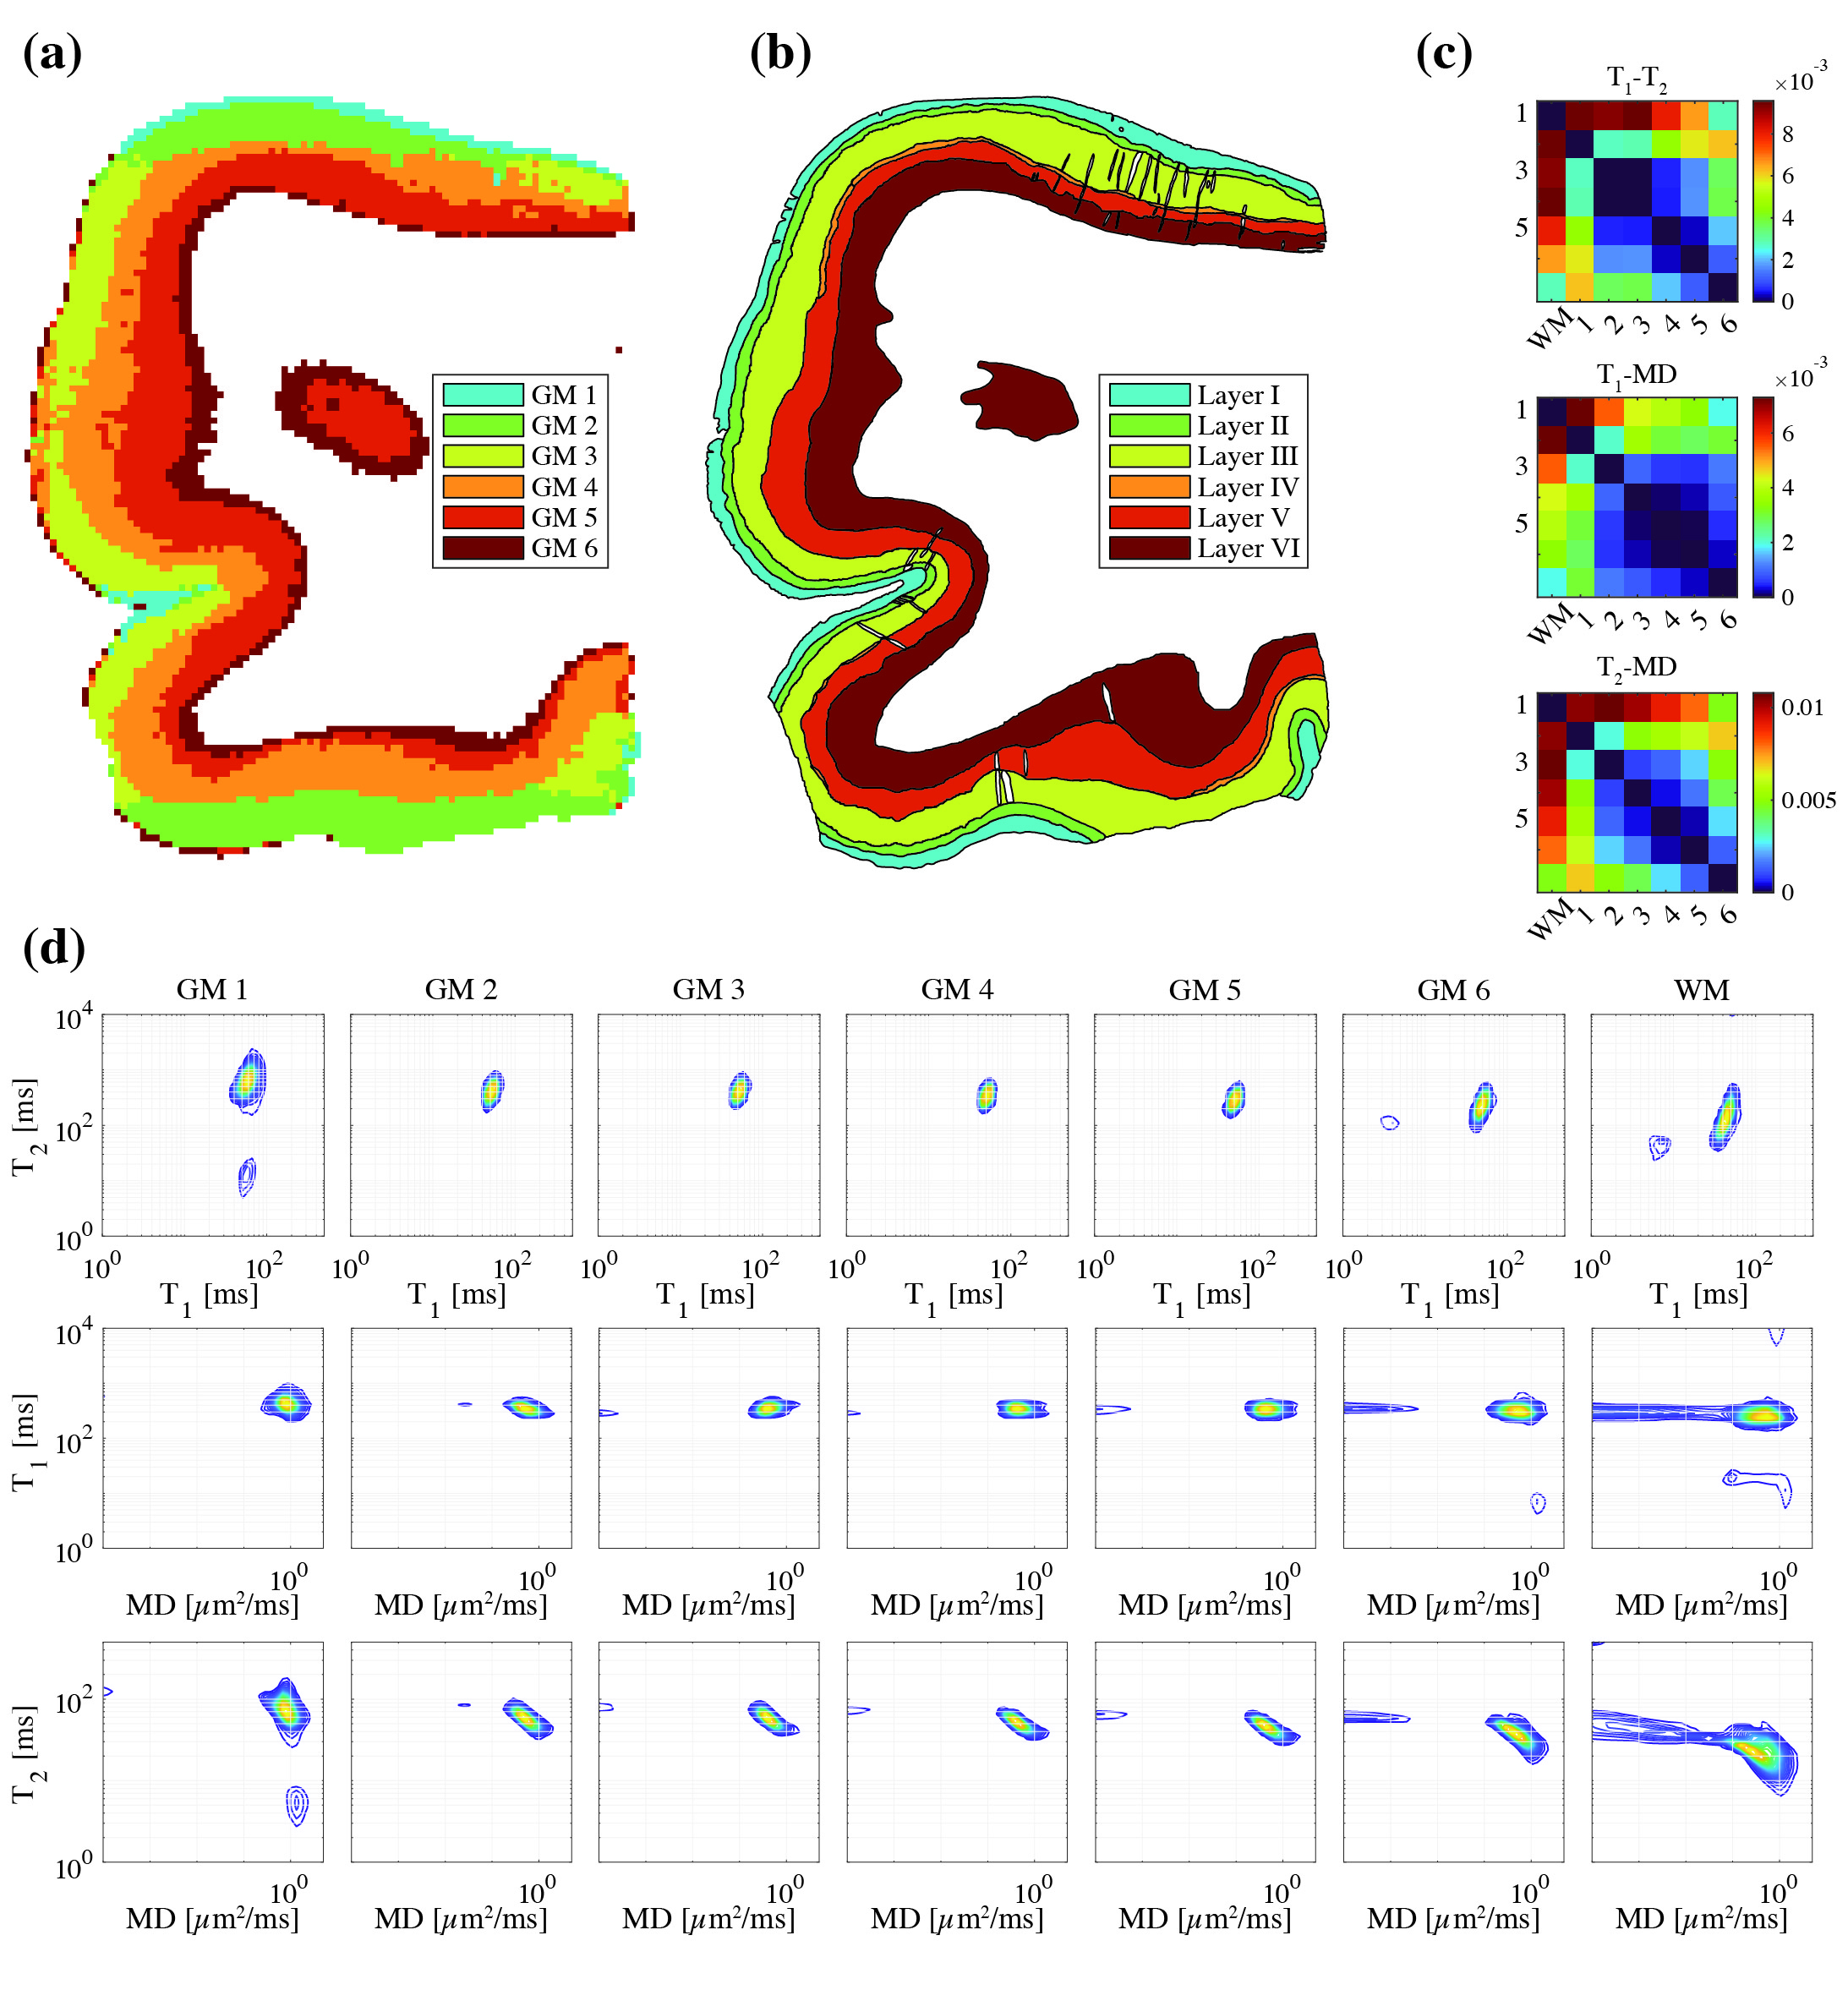
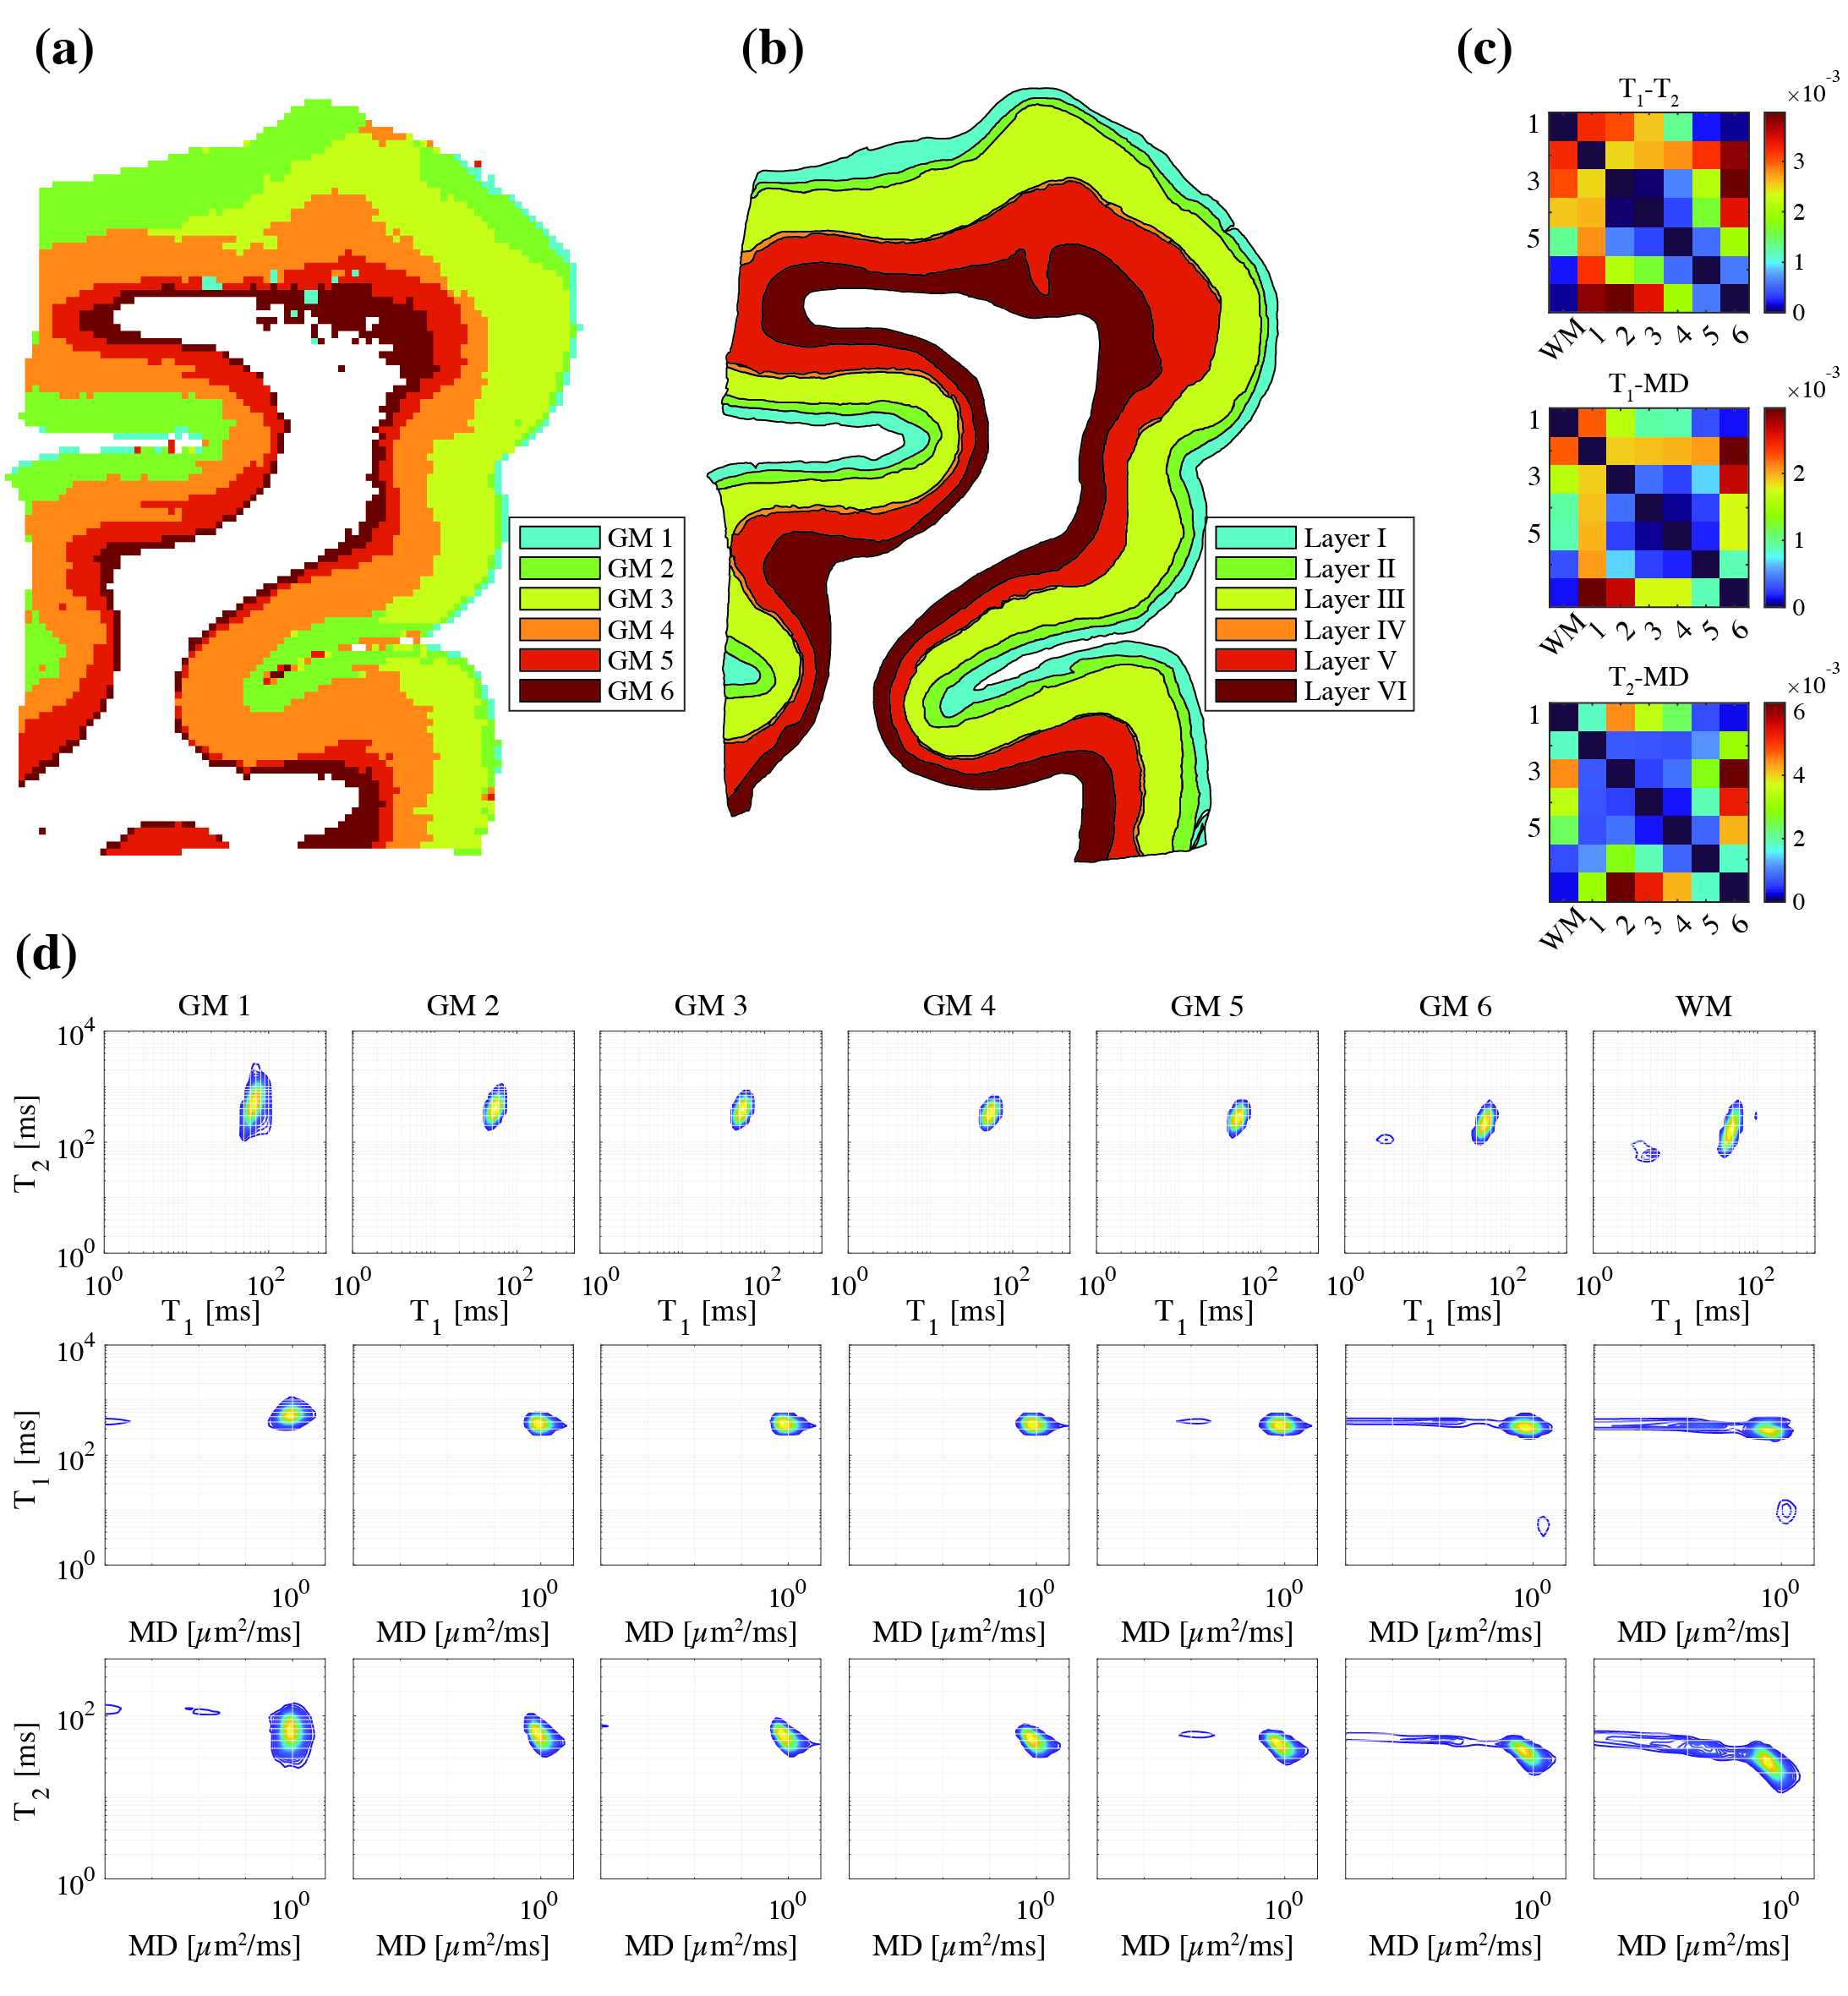
Unsupervised learning using k-means clustering was performed in the modified 2-Wasserstein metric space. Clustering was done in two steps: first, segmenting gray and white matter, and background noise (Figure 1). And next, segmenting the GM further into cortical lamina using six clusters to reflect the number of known cortical layers in the human cortex. Each k-means clustering step was iterated 100 times with random initializations according to the K-means++ algorithm.10Figures 2-4 show representative slices across three different subjects of MRI- and histology-based cortical lamina segmentation (panels a and b). Visual inspection confirms that although not perfectly aligned due to limitations in registering MRI and histological data, the unsupervised MRI- and histology-based laminar segmentations exhibited similar trends. The pairwise LOT distance between each cluster centroid is summarized in a confusion matrix, shown in panel c. In general, clusters that are radially contiguous have centroids that are more similar in the metric space. For example, clusters 1,5,6 mutually have lower LOT distances between their centroids than to clusters 2,3, and 4 for Subject 1. Similar patterns are seen in Subjects 2 and 3.
In addition, the cluster mean distributions were visualized in panel d to investigate the spectral signatures of each cluster. From the outermost GM layer to WM, a gradual shift towards shorter T1 and T2 values, as well as the emergence of slow diffusivity and short T1 components, are evident.
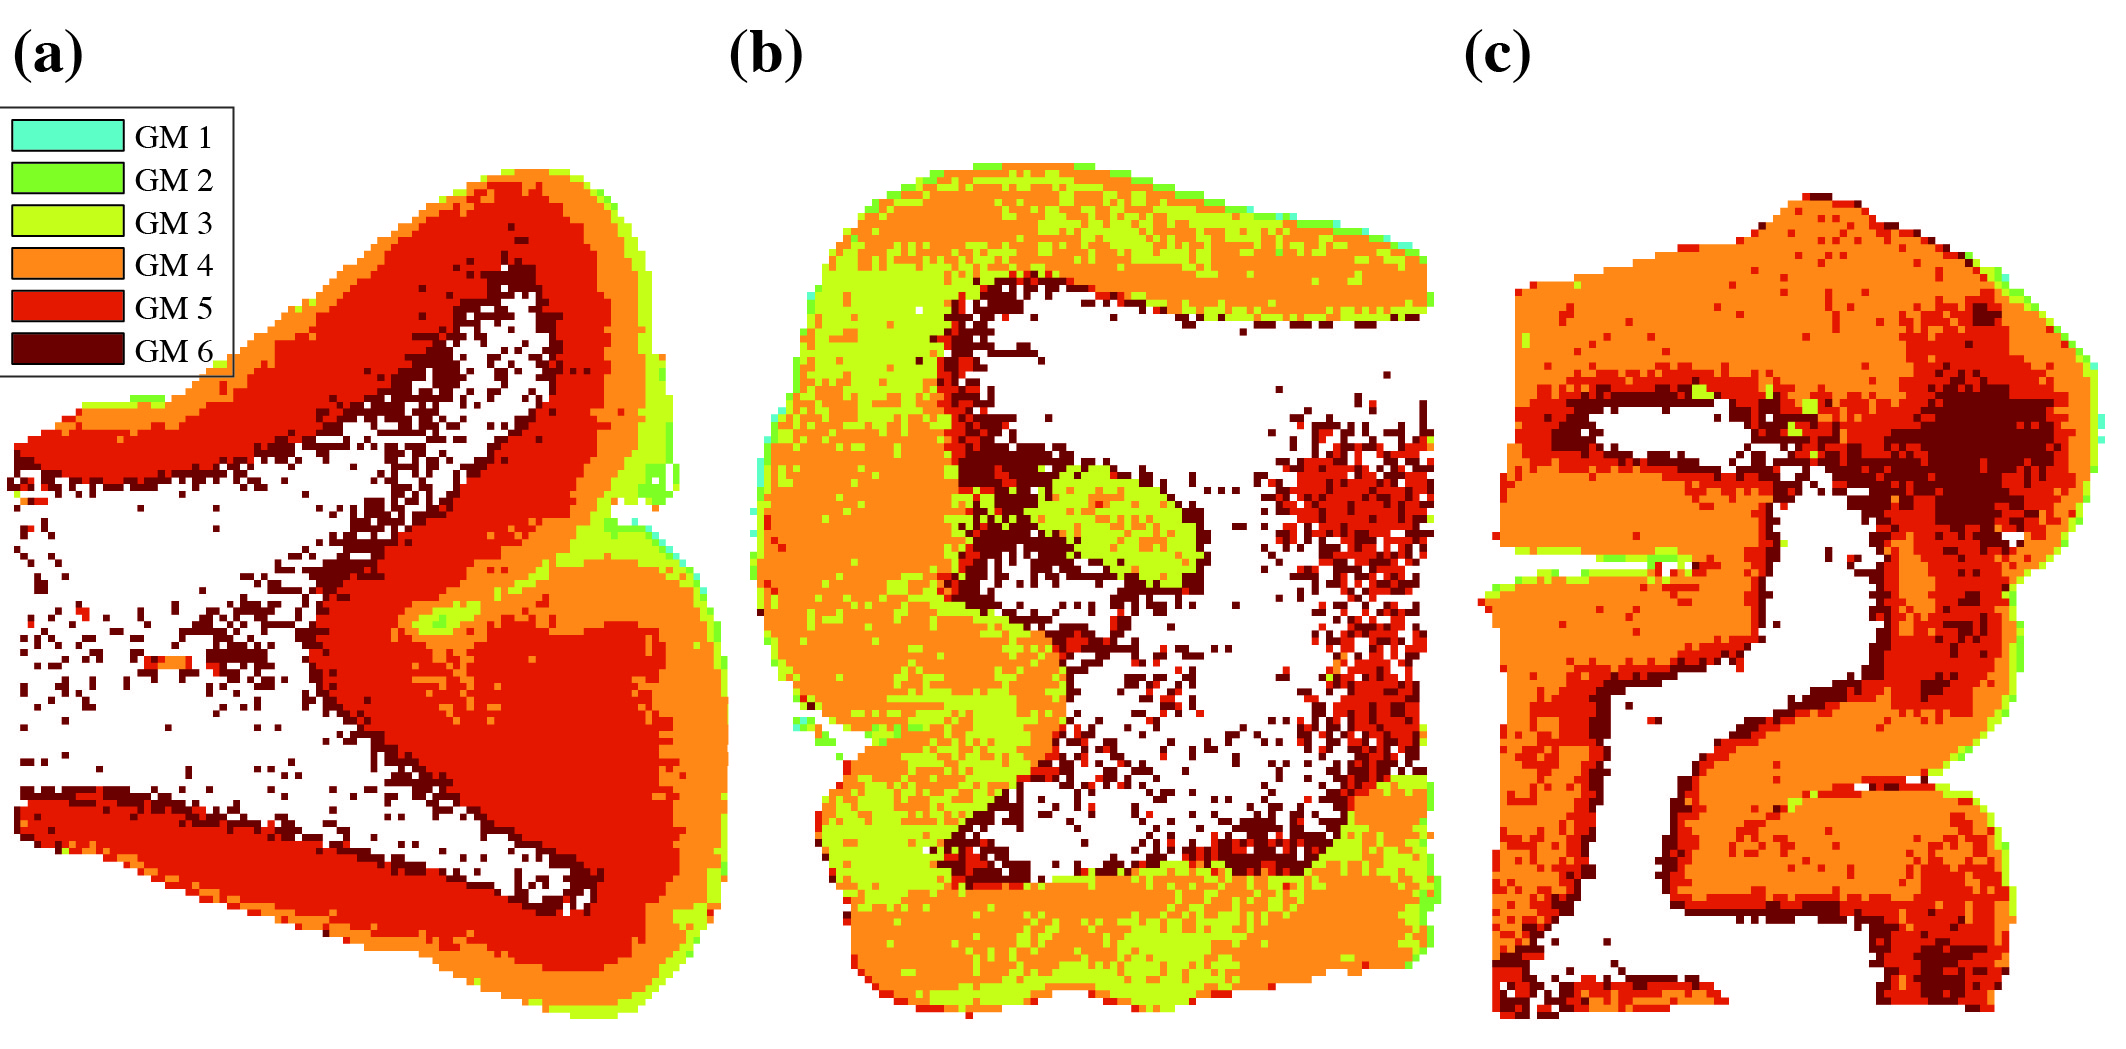
To enable comparisons between the multidimensional MRI laminar segmentations and conventional MRI sequences used in clinical practice, scalar maps of T1, T2, fractional anisotropy (FA), radial, axial, and mean diffusivities were calculated. The same k-means clustering procedure was executed to identify discrete clusters using these scalar metrics as features (Figure 5).
Discussion
By harnessing the rich information content probed via multidimensional MRI and combining it with optimal mass transport-based unsupervised learning, we demonstrate mapping of GM laminar composition. The MRI-based maps delineate contiguous cortical lamina based on spectral signatures captured by multidimensional MRI agnostic spatial location. We observed a pronounced slow diffusivity component in subcortical WM that progressively diminishes toward the cortical surface, possibly indicating a change in cellularity. These novel maps, together with histological validation, suggest that each cortical layer contains a unique microstructural signature that can be measured using multidimensional MRI. In the future, this approach can be used to investigate a multitude of pathologies involving the human cortex to which clinical MRI sequences are insensitive.Acknowledgements
This work was supported by the Intramural Research Program of the National Institute on Aging of the National Institutes of Health.References
1. Assaf, Y. (2019). Imaging laminar structures in the gray matter with diffusion MRI. NeuroImage, 197, 677–688.
2. Livet, J., Weissman, T. A., Kang, H., Draft, R. W., Lu, J., Bennis, R. A., Sanes, J. R., & Lichtman, J. W. (2007). Transgenic strategies for combinatorial expression of fluorescent proteins in the nervous system. Nature, 450(7166), 56–62.
3. Benjamini, D., & Basser, P. J. (2020). Multidimensional correlation MRI. NMR in Biomedicine, 33(12).
4. Slator, P. J., Palombo, M., Miller, K. L., Westin, C., Laun, F., Kim, D., Haldar, J. P., Benjamini, D., Lemberskiy, G., de Almeida Martins, J. P., & Hutter, J. (2021). Combined diffusion‐relaxometry microstructure imaging: Current status and future prospects. Magnetic Resonance in Medicine.
5. S Kolouri, S Park, M Thorpe, D Slepcev, GK Rohde, Transport-based analysis, modeling, and learning from signal and data distributions, 2016, arXiv preprint arXiv:1609.04767
6. Benjamini, D., Priemer, D. S., Perl, D. P., Brody, D. L., & Basser, P. J. (2022). Mapping astrogliosis in the individual human brain using multidimensional MRI. Brain. https://doi.org/10.1093/brain/awac298
7. Benjamini, D., Bouhrara, M., Komlosh, M. E., Iacono, D., Perl, D. P., Brody, D. L., & Basser, P. J. (2021). Multidimensional MRI for Characterization of Subtle Axonal Injury Accelerated Using an Adaptive Nonlocal Multispectral Filter. Frontiers in Physics, 9.
8. Benjamini, D., Iacono, D., Komlosh, M. E., Perl, D. P., Brody, D. L., & Basser, P. J. (2021). Diffuse axonal injury has a characteristic multidimensional MRI signature in the human brain. Brain, 144(3), 800–816.
9. Benjamini, D., & Basser, P. (2016). Use of marginal distributions constrained optimization (MADCO) for accelerated 2D MRI relaxometry and diffusometry. Journal of Magnetic Resonance, 271, 40–45.
10. Arthur, David, and Sergi Vassilvitskii. “K-means++: The Advantages of Careful Seeding.” SODA ‘07: Proceedings of the Eighteenth Annual ACM-SIAM Symposium on Discrete Algorithms. 2007, pp. 1027–1035.
Figures
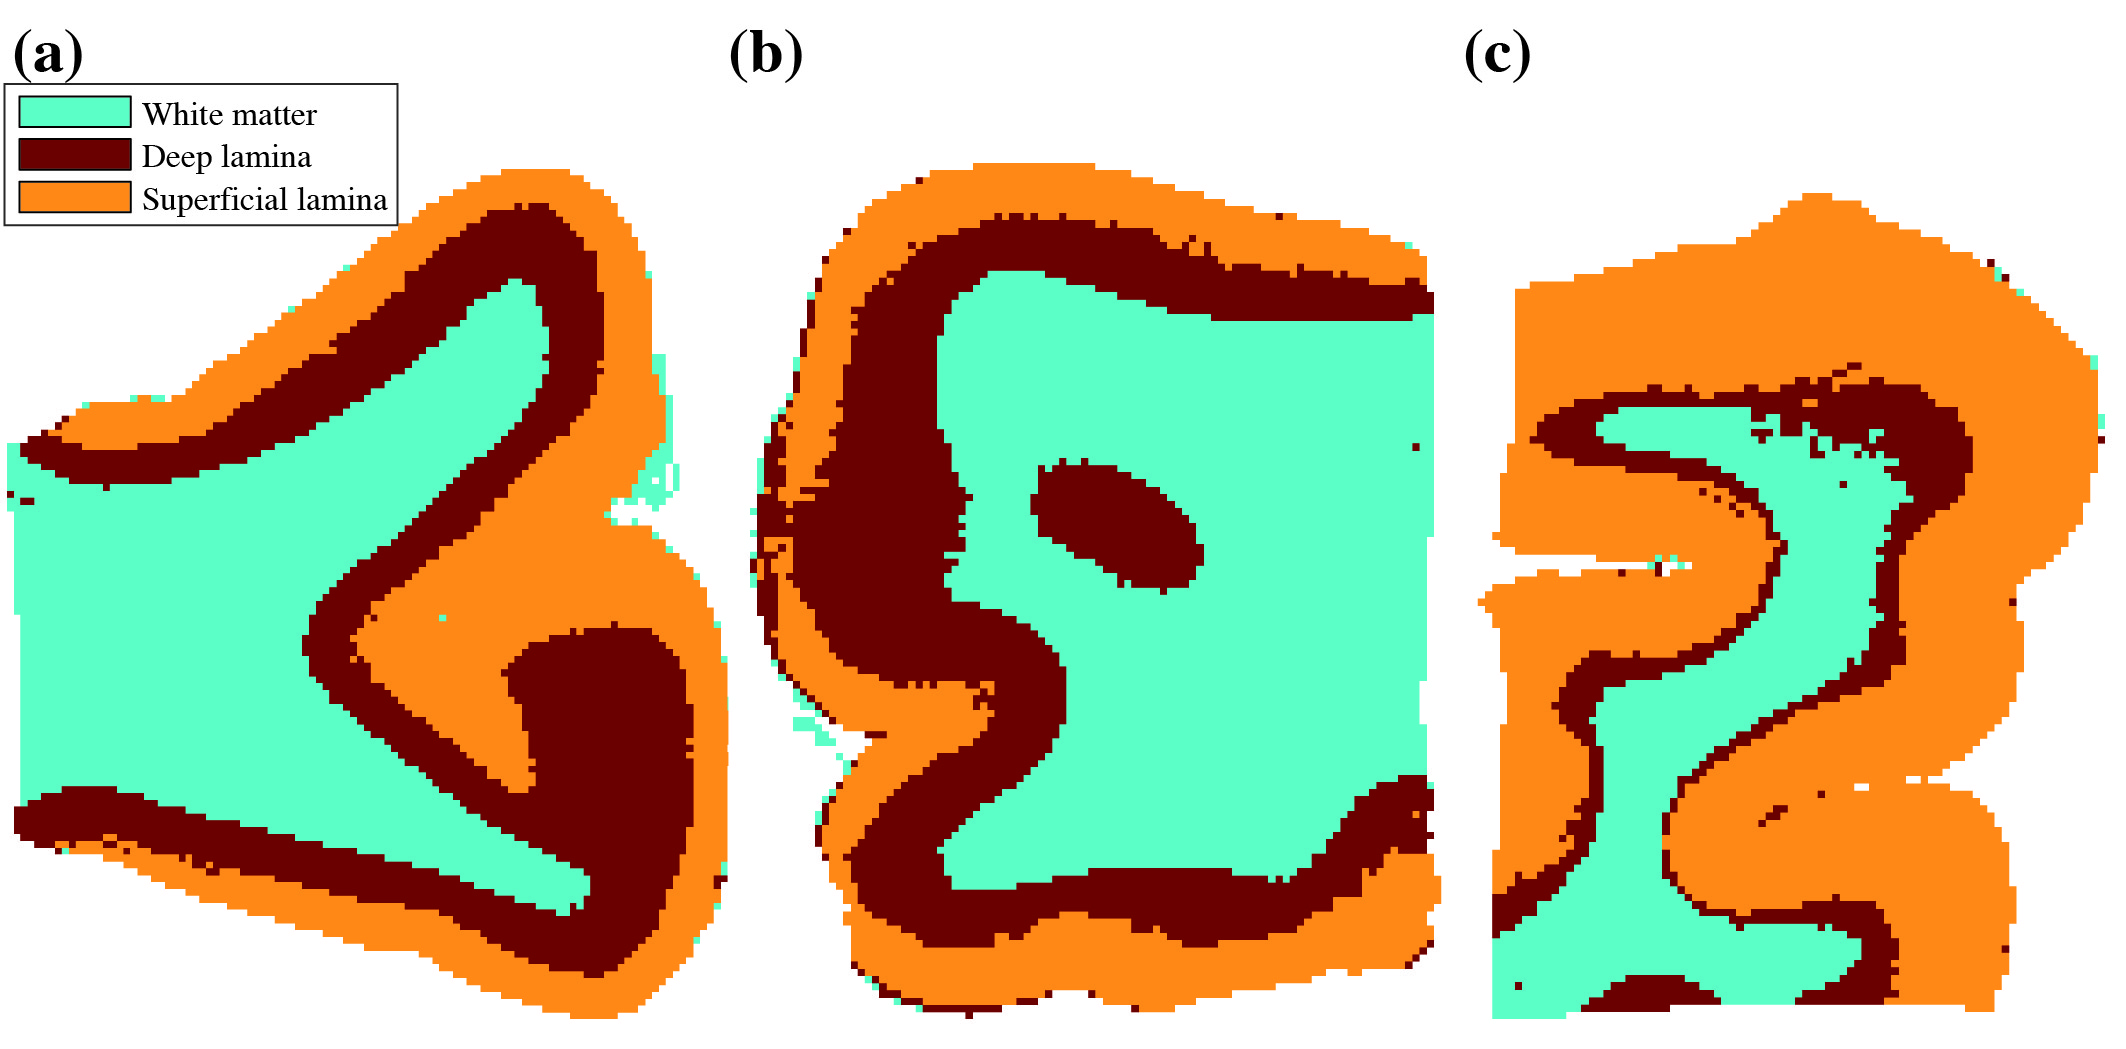
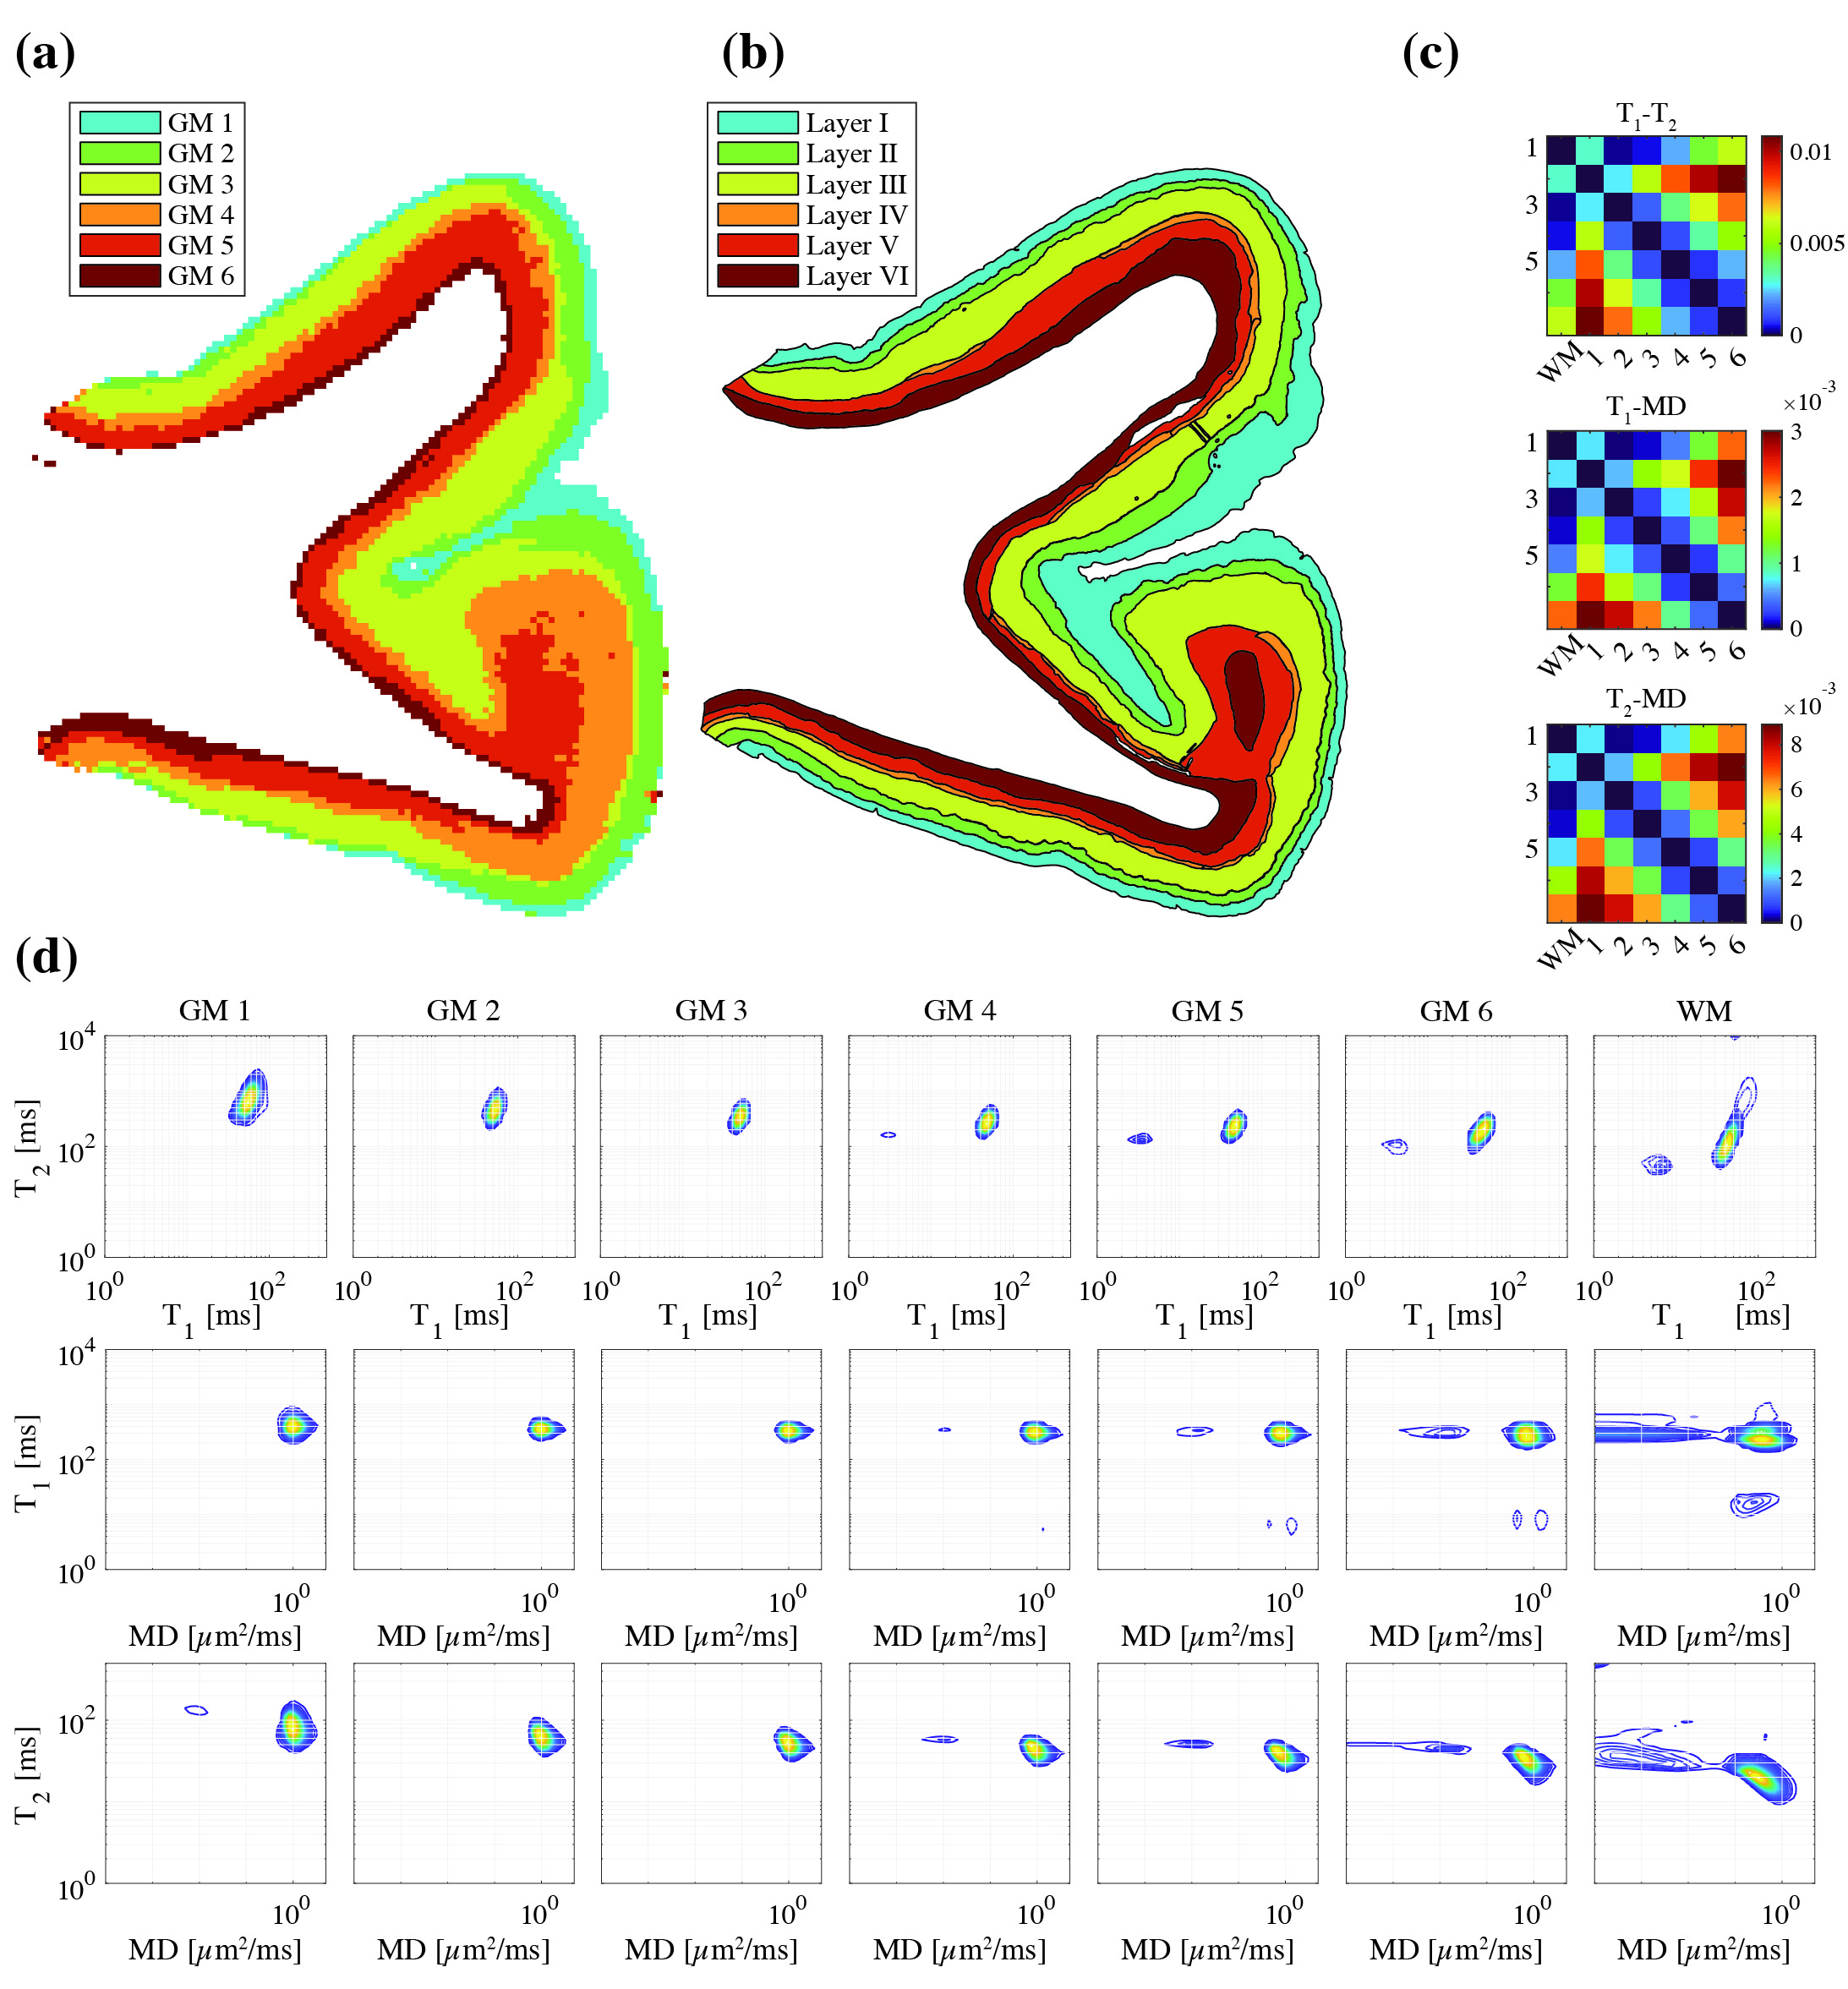
Figure 2. Subject 1: (a) cortical lamina segmented by k-means clustering in the 2-Wasserstein space. (b) The segmented Nissl-stained histology images are shown side-by-side. (c) Pairwise 2-Wasserstein distance between each cluster centroid. (d) Per-cluster mean T1-T2, T1-MD, and T2-MD distributions.