3369
Differential Gray Matter Volume Loss in Controlled and Uncontrolled Type 2 Diabetes Mellitus Over Time1Anesthesiology, University of California Los Angeles, Los Angeles, CA, United States, 2UCLA School of Nursing, University of California Los Angeles, Los Angeles, CA, United States, 3Medicine, University of California Los Angeles, Los Angeles, CA, United States, 4Radiology, University of California Los Angeles, Los Angeles, CA, United States, 5Bioengineering, University of California Los Angeles, Los Angeles, CA, United States, 6Brain Research Institute, University of California Los Angeles, Los Angeles, CA, United States
Synopsis
Keywords: Gray Matter, Diabetes
Patients with Type 2 diabetes mellitus (T2DM) show brain tissue changes in mood and cognitive control sites, functions that are deficient in the condition. However, the extent of brain gray matter volume loss in various sites, as well as progression of volume loss with time in controlled and uncontrolled T2DM adults are unclear. We observed higher gray matter volume loss in crucial brain areas involved in cognition and mood control in T2DM adults with uncontrolled glucose levels and accelerated progression after 6-months of follow-up. These findings indicate the need for optimal glucose management in T2DM adults.Purpose
Type 2 diabetes mellitus (T2DM) patients show brain tissue volume changes in sites that mediate mood and cognitive functions that are commonly deficient in the condition.1-6 The presence of cognitive decline and depression and anxiety in T2DM patients worsens prognosis of underlying disease, impacts compliance to medical treatment, and uncontrolled T2DM may affect more brain tissue and exacerbate the condition. However, it is unclear whether brain gray matter volume loss varies with time between T2DM adults with controlled and uncontrolled hemoglobin A1c levels that can be examined with high-resolution T1-weighted imaging using voxel-based morphometry (VBM). Voxel-based morphometry (VBM), an automatic quantitative technique, allows whole-brain voxel-wise comparisons of gray matter (GM) volumes between groups. In the present study, our aim was to examine differential GM volume changes in controlled and uncontrolled T2DM adults compared to healthy control subjects, and whether those changes progress with time in T2DM adults.Materials and methods
We examined 47 T2DM adults (age, 56.8±7.6 years; body-mass-index (BMI), 29.3±5.2 kg/m2; 25 male; HbA1C, 7.0±1.4 %; disease duration, 11.4±7.9 years), who were followed at 6 months, and 88 healthy control subjects (age, 54.4±5.1 years; BMI, 26.1±3.5 kg/m2; 46 male) using a 3.0-Tesla MRI (Magnetom Prisma; Siemens). Of 47 T2DM, 26 T2DM adults were with controlled glucose (hemoglobin A1c [A1C] <7%) levels and 21 T2DM adults with uncontrolled glucose levels (A1C ≥ 7%). Two high-resolution T1-weighted image series were collected using the magnetization-prepared rapid acquisition gradient-echo pulse sequence [repetition-time=2200ms; echo-time=2.34/2.41ms; inversion time=900 ms; flip angle=9°; matrix size=320×320; field-of-view=230×230mm2; slice thickness=0.9mm)]. Both high-resolution T1-weighted images were realigned, averaged, and partitioned into gray matter, white matter, and cerebrospinal fluid (CSF) tissue types. The DARTEL toolbox was used to generate the flow fields for normalization of GM maps to MNI space. The modulated normalized GM volume maps were smoothed and compared between groups using analysis of covariance [ANCOVA, SPM12; controlled T2DM at baseline vs control subjects, uncontrolled T2DM at baseline vs control subjects, covariates, age and sex; p<0.001). Paired samples t-test (SPM12) was performed between controlled T2DM at baseline vs at 6-months follow-up, and uncontrolled T2DM at baseline vs at 6-months follow-up, using the smoothed GM volume maps. High resolution T1-weighted images of a control subject were normalized to a common space and used as background images for structural identification.Results
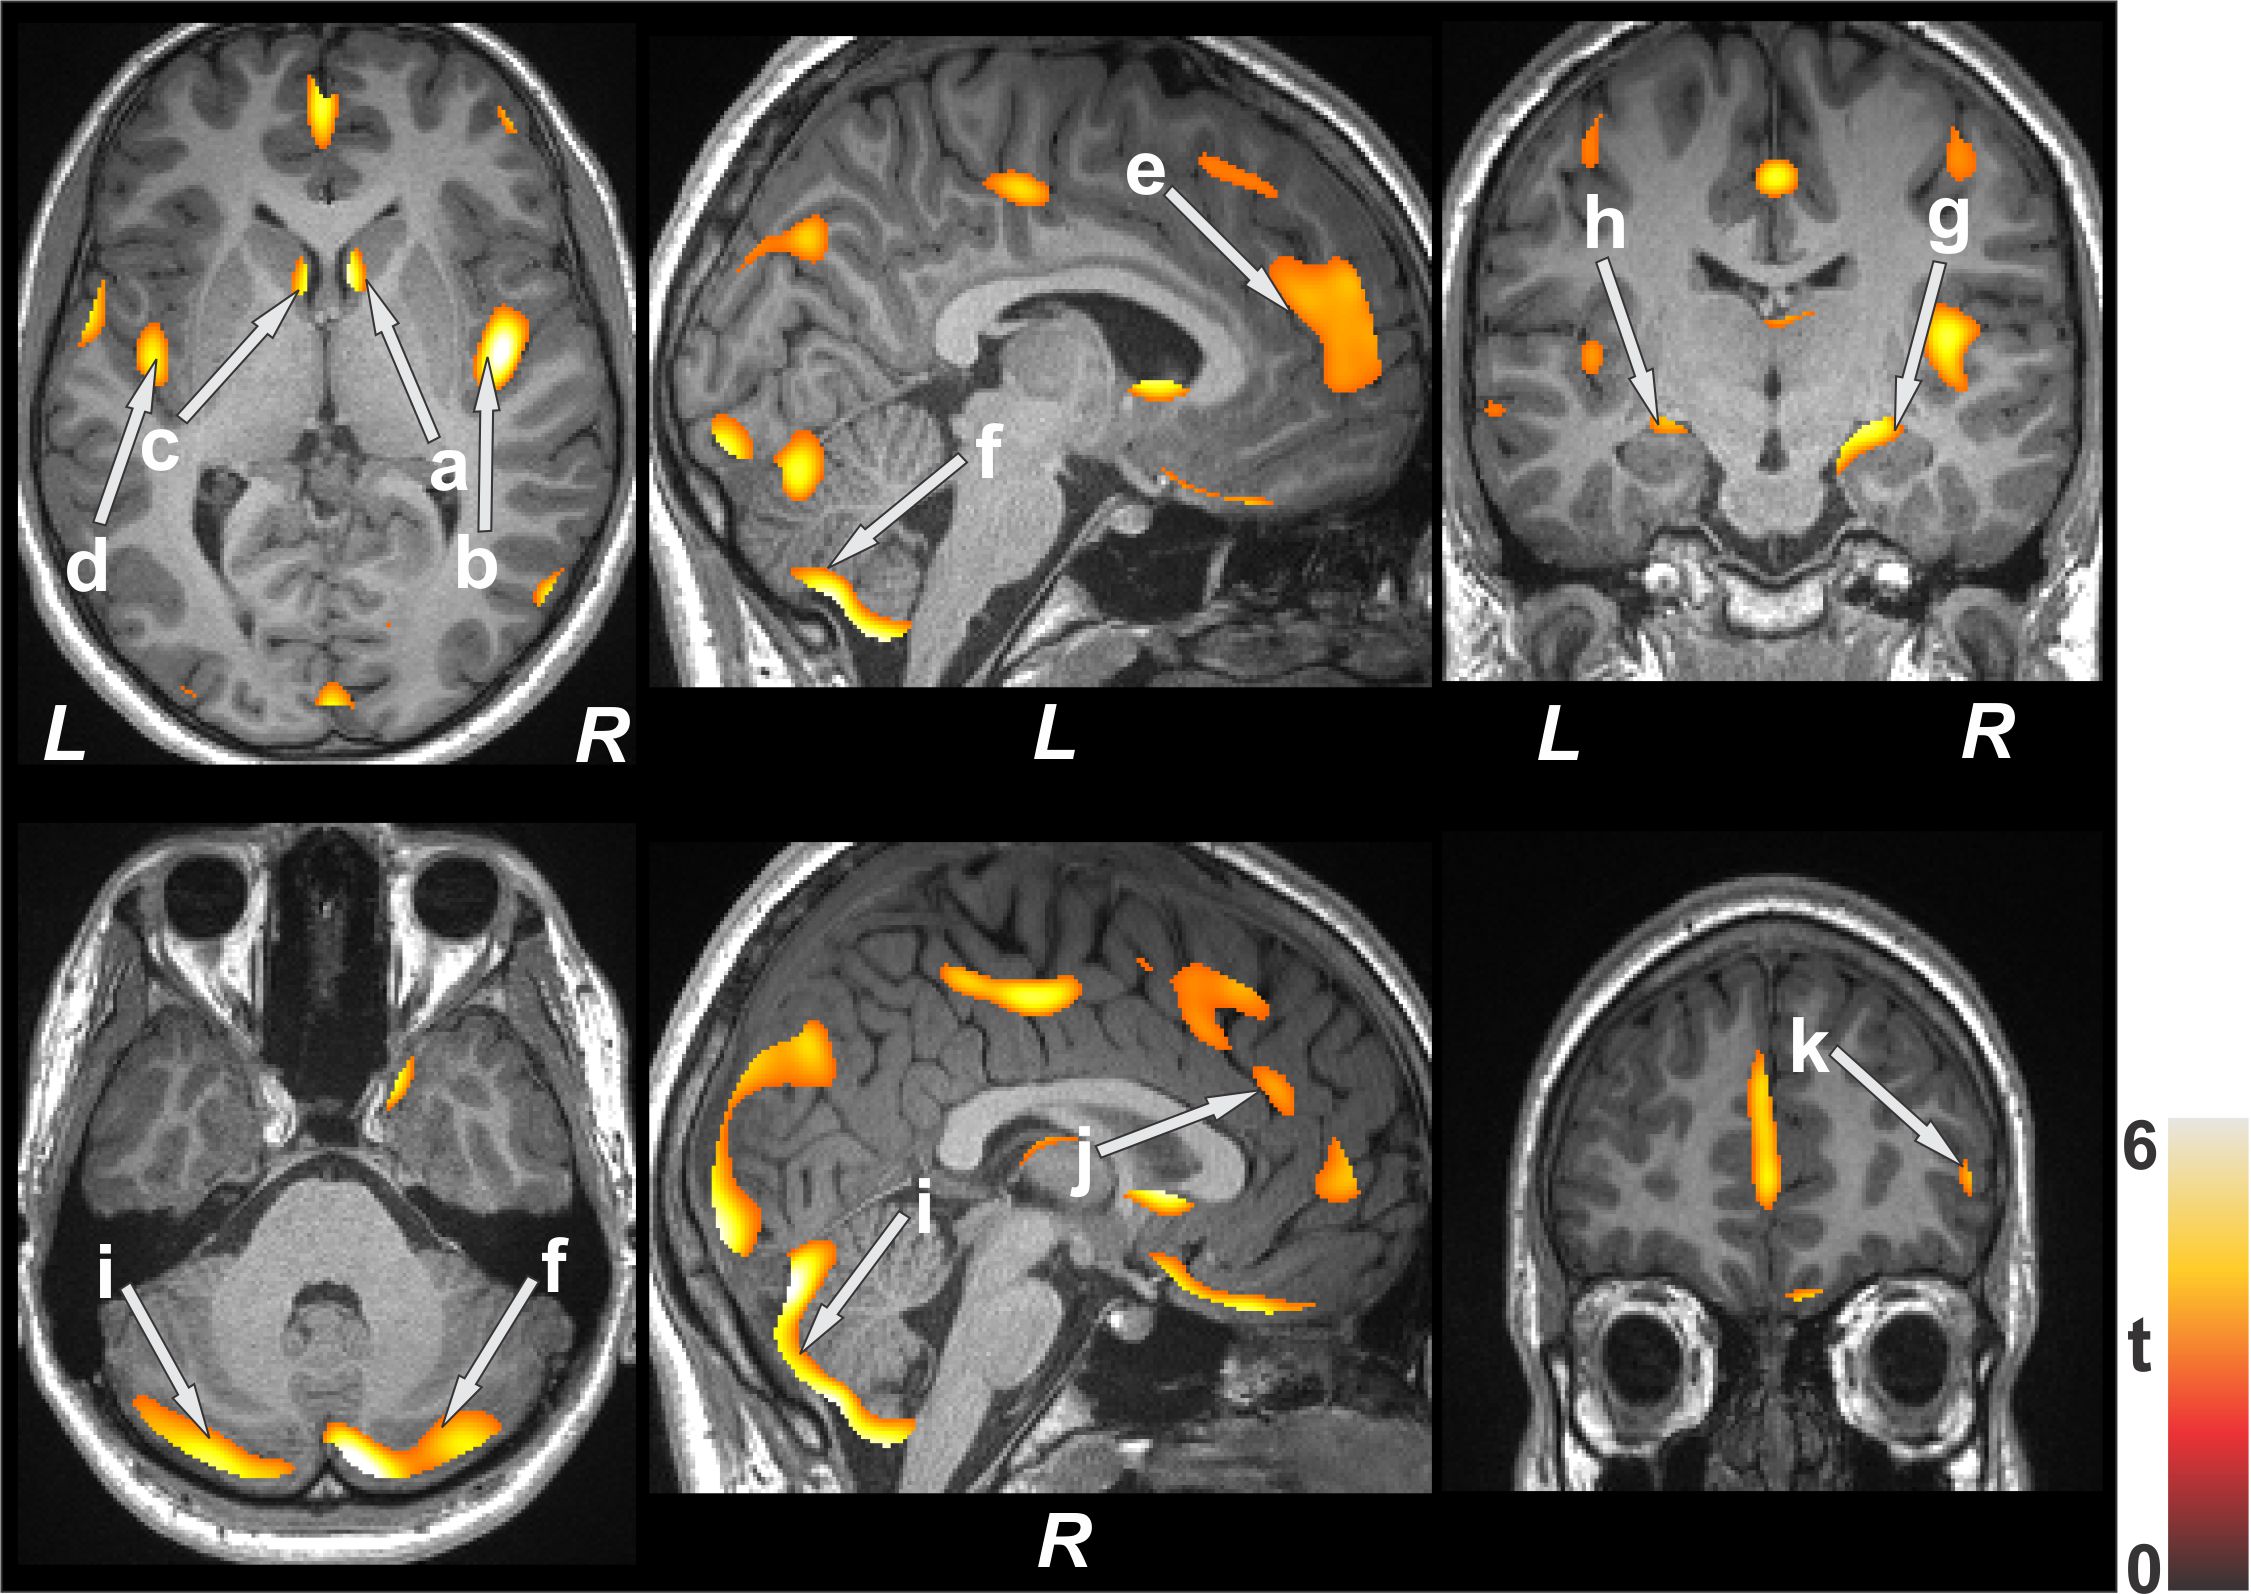
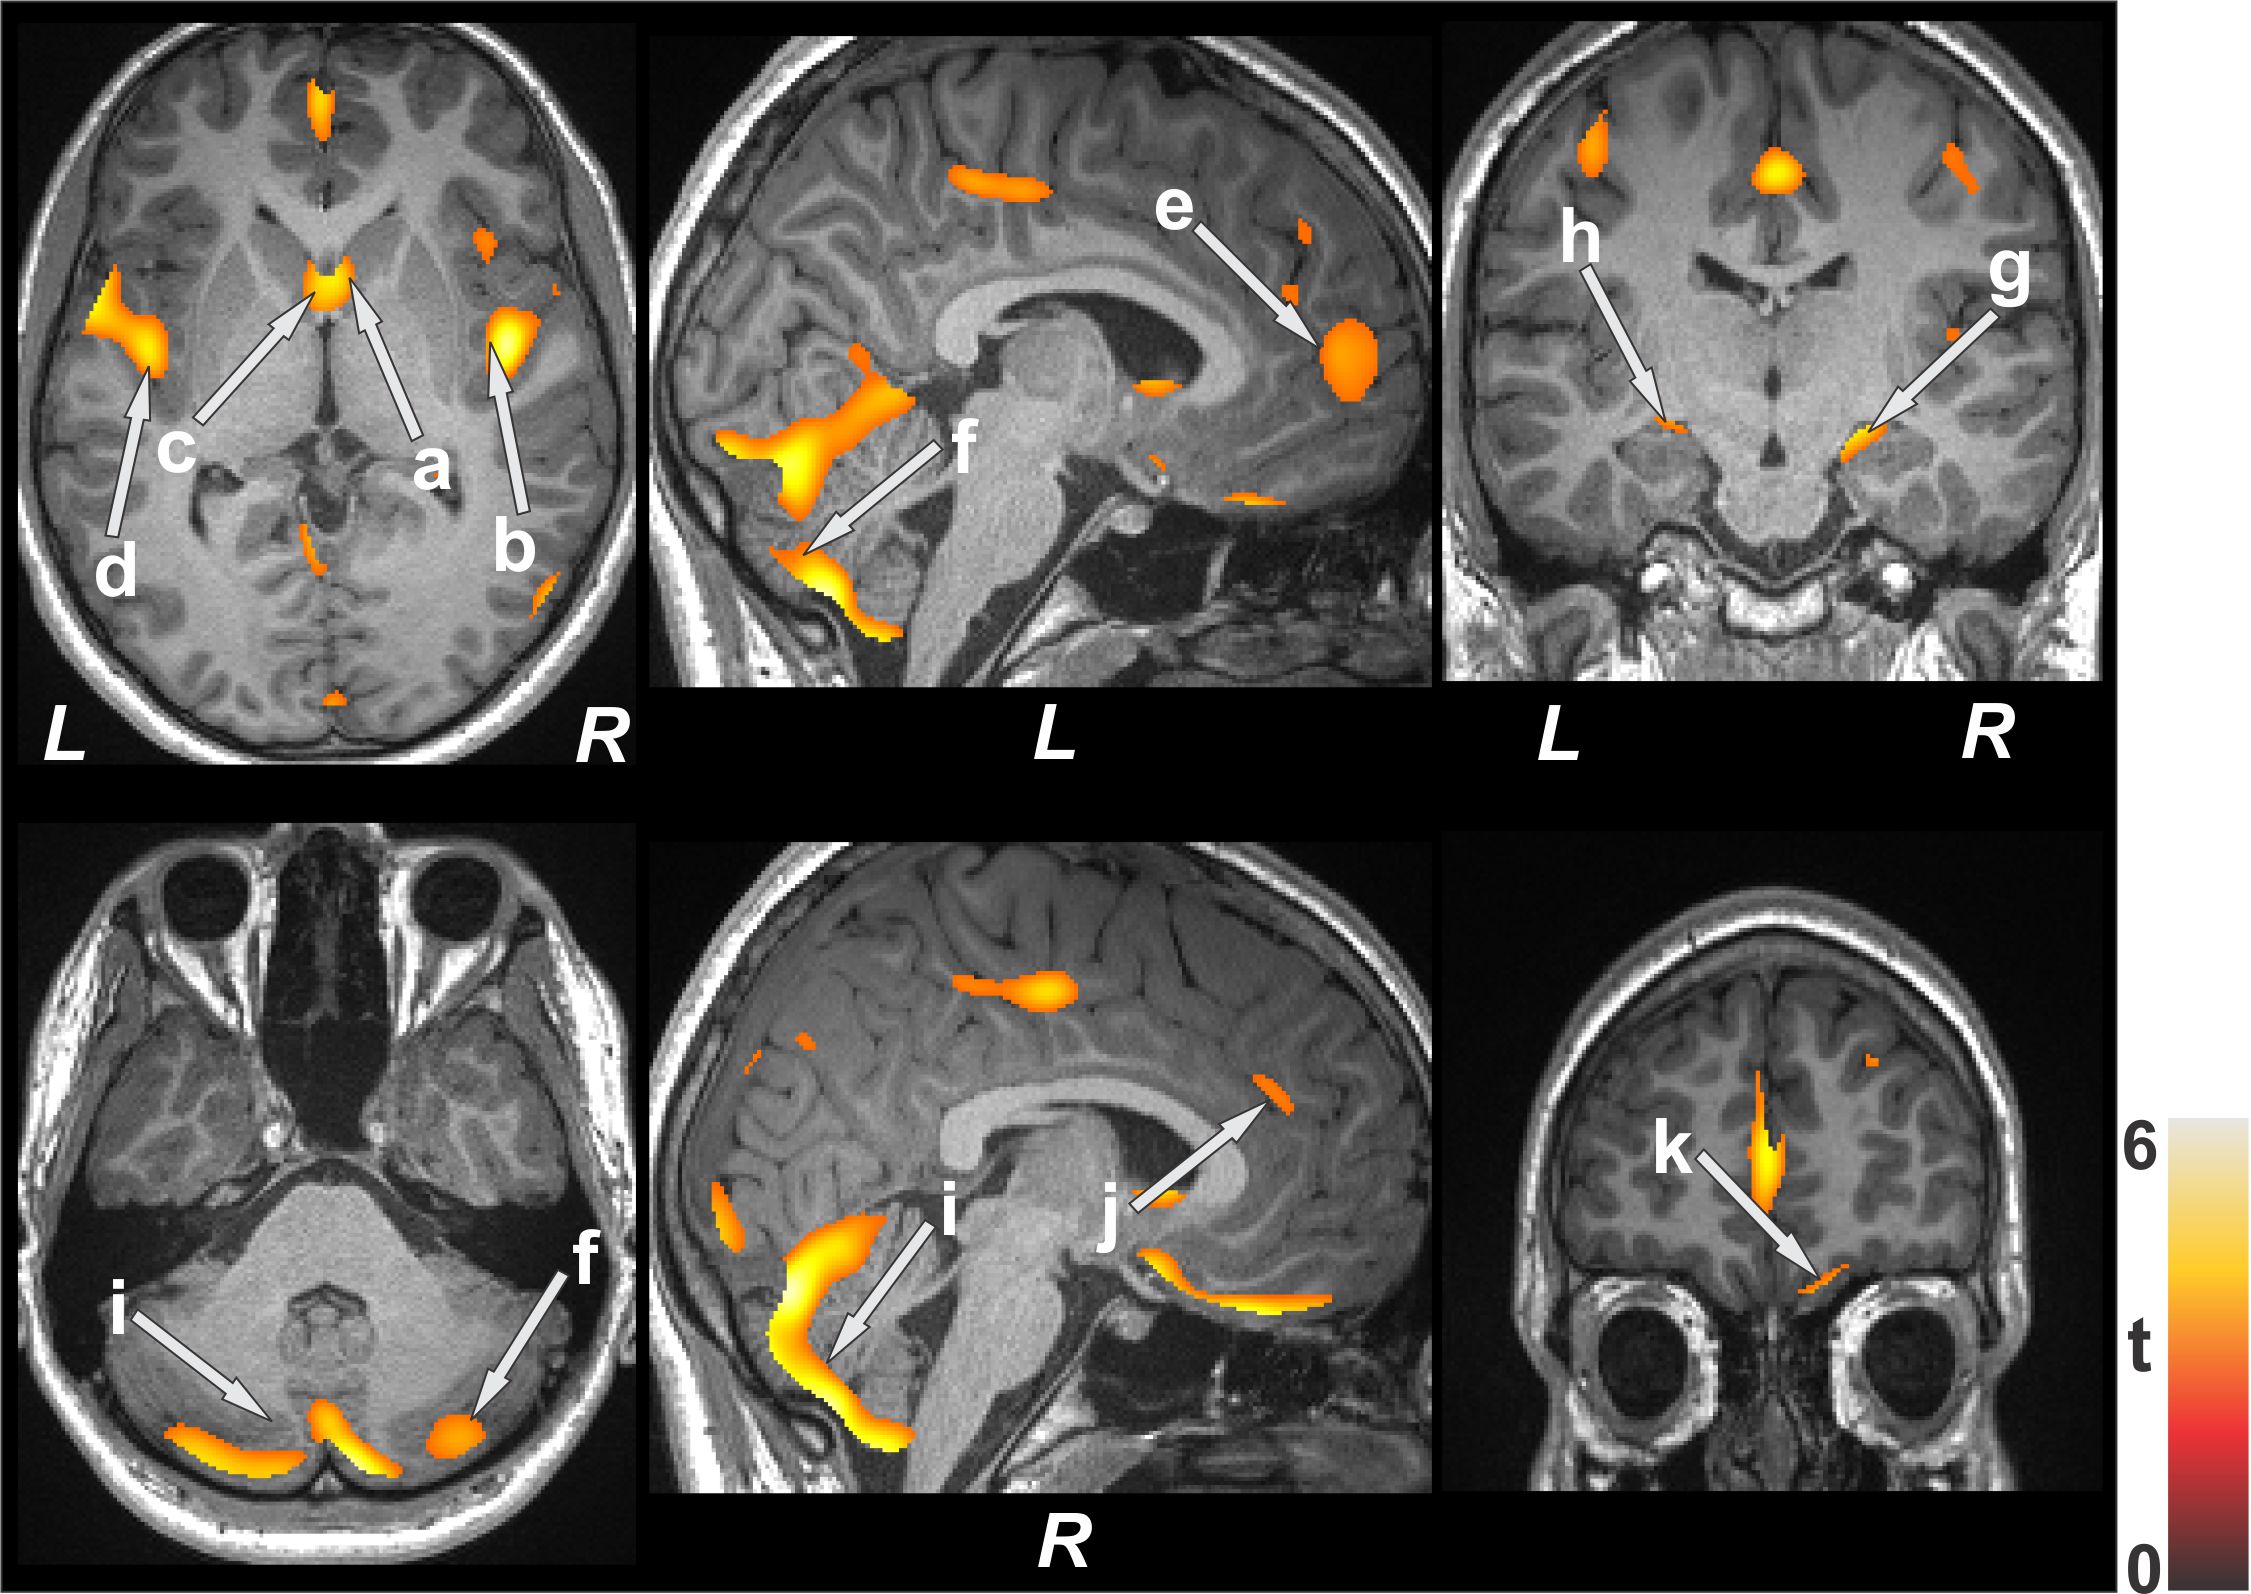
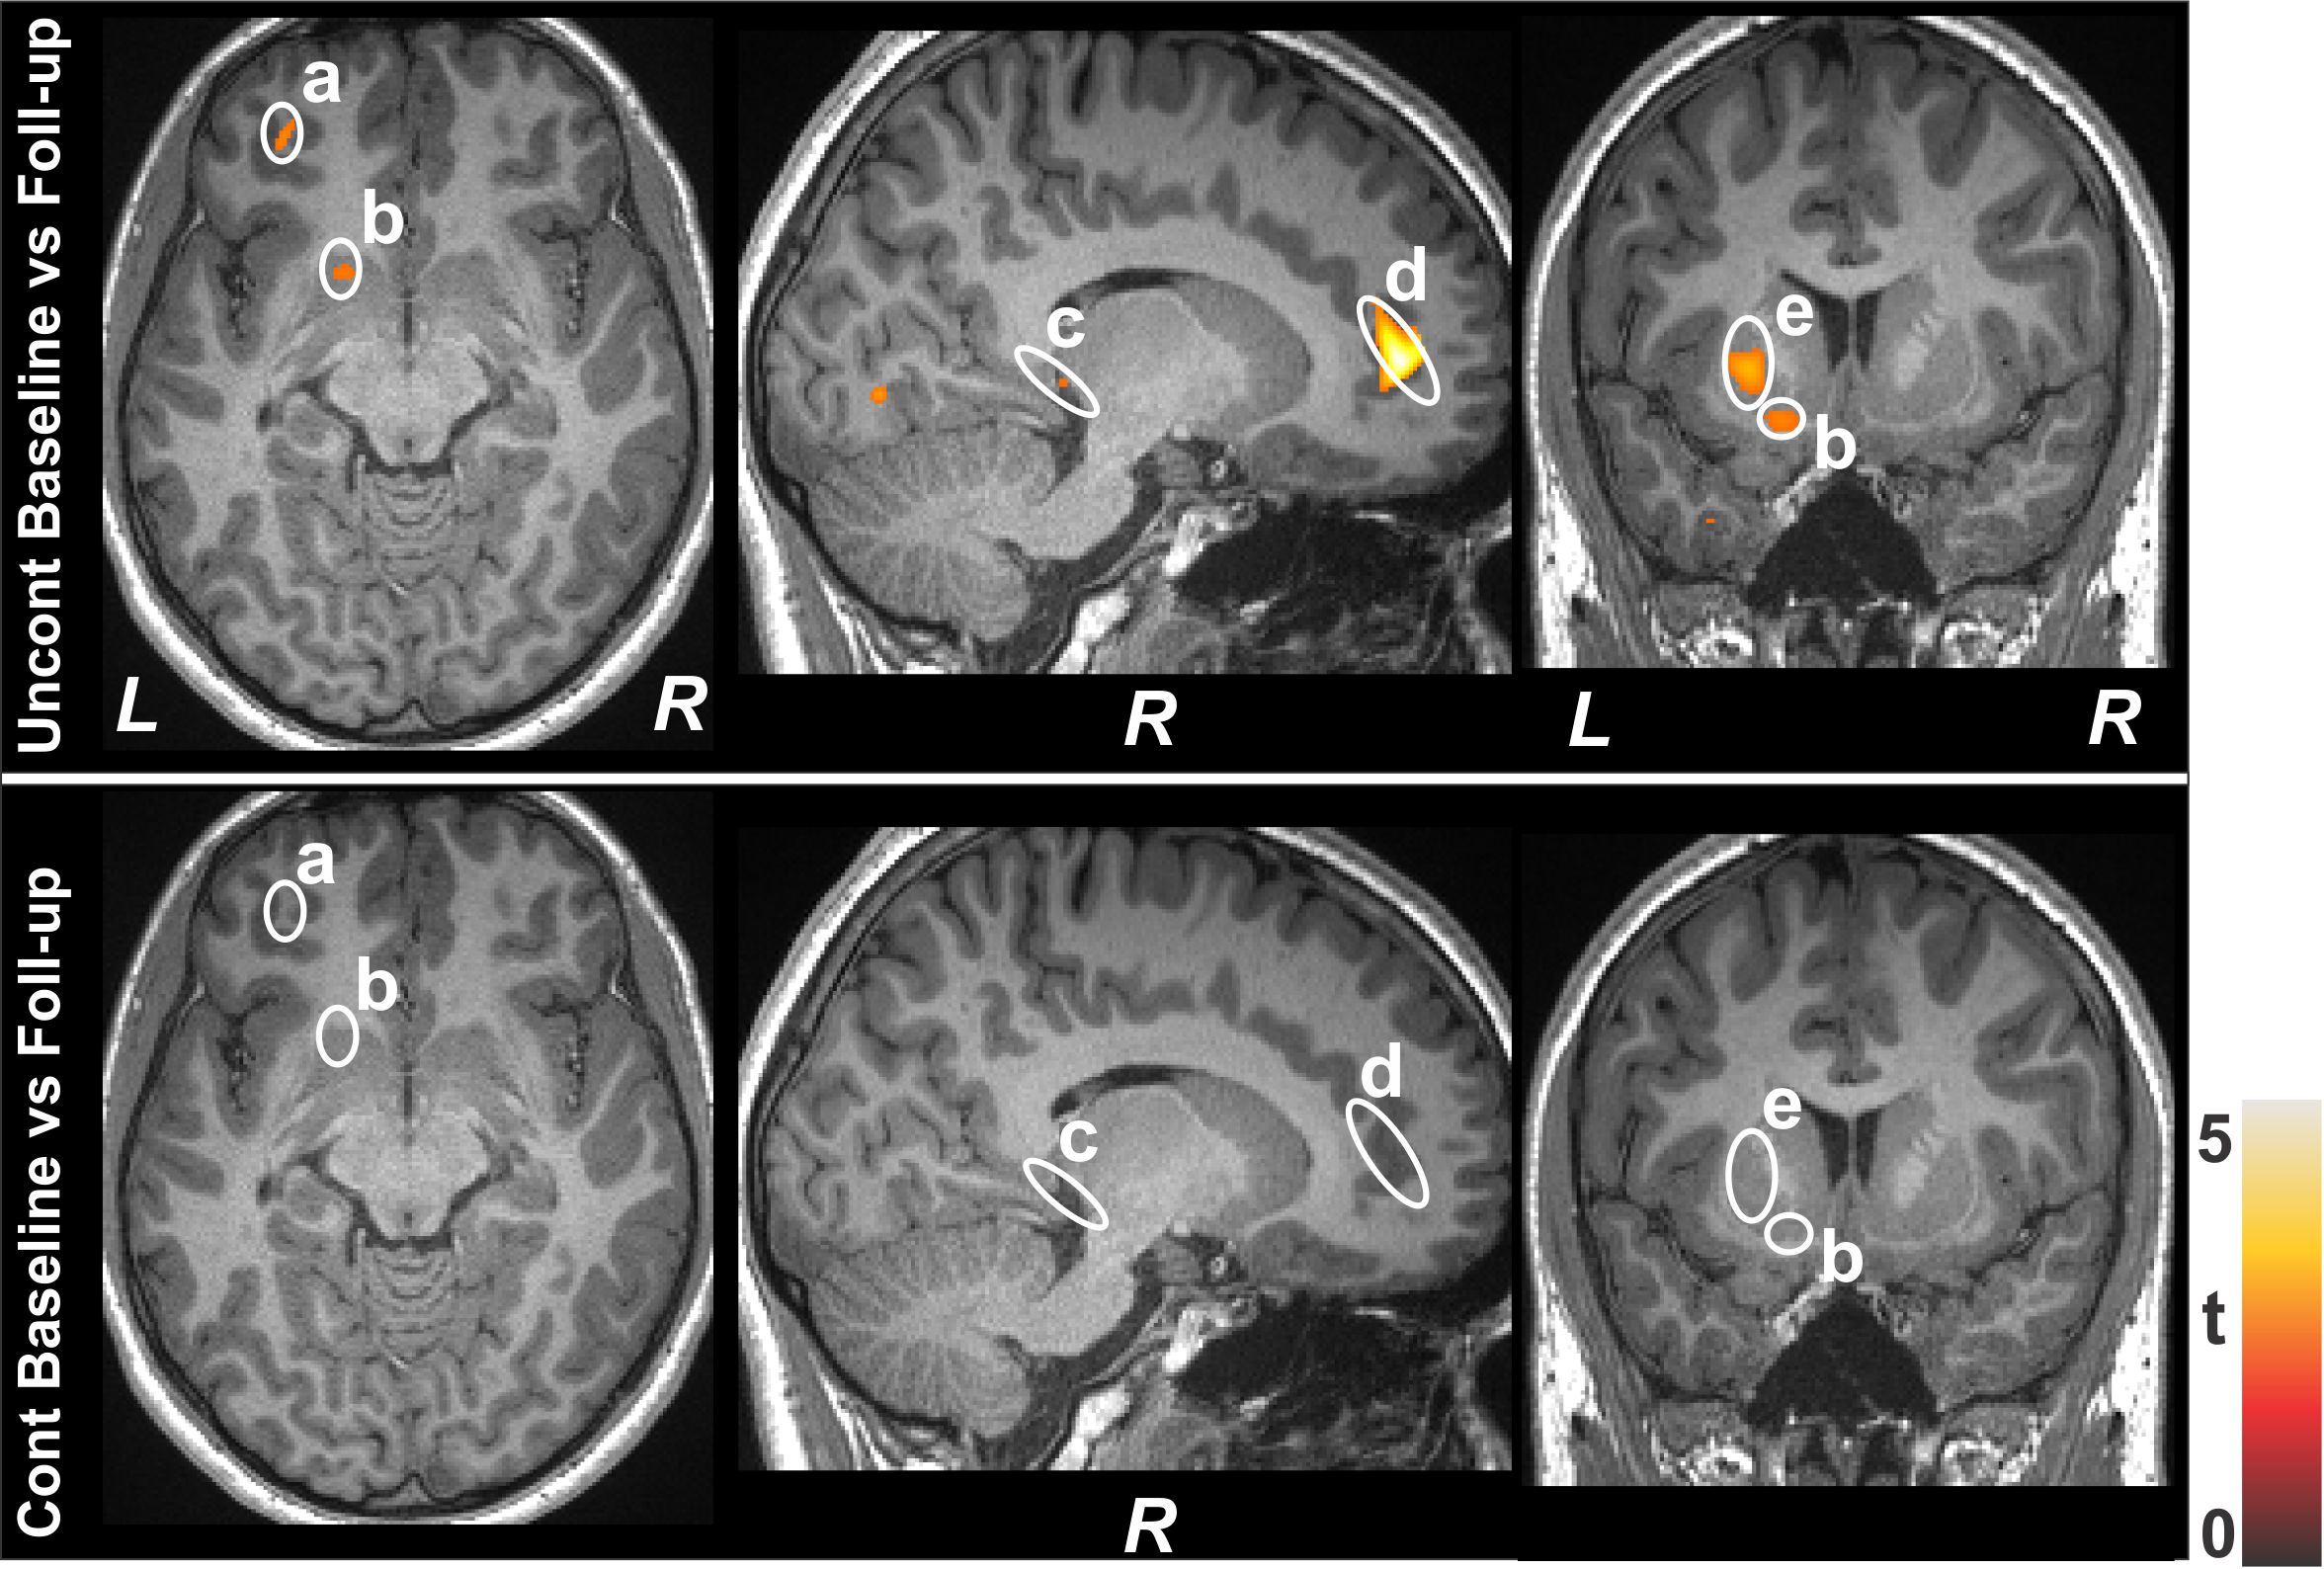
No significant differences in age and sex emerged between T2DM and control subjects (age, p=0.06; sex, p=0.92). However, BMI was significantly increased in T2DM adults (p<0.001). Multiple brain areas showed reduced gray matter volumes in uncontrolled T2DM adults at baseline compared to control subjects (Fig.1), including the caudate (a, c), insular cortices (b, d), anterior cingulate (e, j), cerebellum (f, i), hippocampus (g, h), and prefrontal cortices (k). Similar regions showed gray matter volume loss in controlled T2DM adults at baseline with less wide-spread areas compared to control subjects (Fig. 2). Gray matter volume reduction continued at 6 months follow-up in uncontrolled T2DM patients compared with their baseline (Fig. 3) at several selected brain sites, including the prefrontal cortices (a), caudate (b), hippocampus (c), anterior cingulate (d), and putamen (e). However, limited sites, including prefrontal cortices showed reduced gray matter volumes at 6 months in controlled T2DM adults over baseline.Discussion
Uncontrolled T2DM patients showed significant widespread gray matter volume loss over controlled T2DM adults in areas that are involved in depression, anxiety, and cognition regulation. Accelerated progression of brain volume loss was observed in uncontrolled T2DM patients at 6- months at several crucial brain sites, which may result from underlying metabolic dysfunction associated with the condition.Conclusion
T2DM adults with uncontrolled glucose levels may be at increased risk of extensive gray matter volume loss in critical brain areas that are involved in cognition and mood control. The findings indicate the need for optimal glucose management in T2DM adults. High-resolution T1-weighted imaging and VBM procedures may be promising tools to examine such changes in the condition.Acknowledgements
This work was supported by National Institutes of Health R01 NR017190 and 3R01NR017190-03S1.References
1. Brain atrophy in type 2 diabetes: regional distribution and influence on cognition. Diabetes Care. 2013;36:4036-4042.
2. Zhang Y, Zhang X, Zhang J, et al. Gray matter volume abnormalities in type 2 diabetes mellitus with and without mild cognitive impairment. Neurosci Lett. 2014;562:1-6.
3. Gold SM, Dziobek I, Sweat V, et al. Hippocampal damage and memory impairments as possible early brain complications of type 2 diabetes. Diabetologia. 2010;53:2298-2306.
4. Roy B, Ehlert L, Mullur R, et al. Regional brain gray matter changes in patients with type 2 diabetes mellitus. Sci Rep. 2020; 10:9925.
5. Kumar A, Haroon E, Darwin C, et al. Gray matter prefrontal changes in type 2 diabetes detected using MRI. J Magn Reson Imaging. 2008;27:14-19.
6. Hirabayashi N, Hata J, Furuta Y, et al. Association between diabetes and gray matter atrophy patterns in a general older japanese population: the Hisayama study. Diabetes Care. 2022;45:1364–1371.
Figures