3367
Investigating Regional Changes in Brain Magnetic Susceptibility in Tanzanian Children with Sickle Cell Anaemia at 1.5 Tesla1Department of Medical Physics and Biomedical Engineering, University College London, London, United Kingdom, 2Imaging and Biophysics, Developmental Neurosciences, UCL Great Ormond Street Institute of Child Health, London, United Kingdom, 3Department of Radiology & Imaging, Muhimbili University of Health and Allied Sciences, Dar Es Salaam, Tanzania
Synopsis
Keywords: Gray Matter, Susceptibility
Although sickle cell anaemia (SCA) affects the brain, causing stroke and neurocognitive complications, its pathophysiological mechanisms are poorly understood. Quantitative Susceptibility Mapping (QSM) reveals alterations in tissue composition. Therefore, we applied QSM to investigate changes in brain susceptibility in 168 SCA patients compared to 47 healthy controls scanned at 1.5 Tesla in Tanzania. We found a significant susceptibility decrease in SCA vs. controls in the caudate nucleus and globus pallidus and a significant increase in susceptibility in the red nucleus and dentate. Blood haemoglobin levels had a significant positive correlation with susceptibility in the globus pallidus, caudate nucleus and putamen.
Introduction
Sickle cell anaemia (SCA) is a single-gene disorder affecting the Globin gene and is an important cause of stroke and other neurocognitive complications in children and young adults1. Abnormal cerebral haemodynamics appear to play an important role in the pathophysiology but the mechanism is poorly understood and the available data are conflicting. Therefore, aiming to provide insight into SCA disease processes in the brain, a Quantitative Susceptibility Mapping (QSM) pipeline has been developed to acquire regional magnetic susceptibility estimates in the brains of patients with SCA. Here, we compared these values to those in healthy controls to investigate the effect of SCA and blood haemoglobin on brain susceptibility in deep grey matter structures.
Methods
168 children with SCA and 47 healthy controls (with ages 14.8±4.2 years and 10.9±3.4 years, respectively) were imaged with a T2*-weighted multi-echo 3D gradient-echo (GRE) sequence for QSM, and a high-resolution T1-weighted structural scan. All images were acquired at 1.5T at the Muhimbili National Hospital, Tanzania with either an 8-channel RF coil or a birdcage coil. 3D GRE sequence parameters were: 160 x 160 x 93 matrix, 1.5 mm isotropic resolution, 27.4 ms TR, 4.28 ms TE1, 4.94ms ΔTE, 5 echoes, 15° flip angle, and a 287 Hz/pixel bandwidth.QSM was performed using the following pipeline: Nonlinear fitting2 of the complex data with iFieldCorrection3 to remove residual phase inconsistencies, SEGUE phase unwrapping4, PDF background field removal5, and susceptibility calculation using the iterative Tikhonov method6 with a regularization parameter = 0.028 (optimised using the L-curve method). Brain masks were obtained from the final echo magnitude image using FSL BET7 and combined with a noise mask obtained (by thresholding the inverse noise map from the nonlinear fit at its mean plus half the standard deviation) to remove noisy regions.
Image segmentations were obtained using MRICloud8, with the susceptibility maps and T1-weighted images (coregistered to the GRE magnitude images using FSL FLIRT9) used as input. The mean and standard deviation of the susceptibility and volume were calculated in eight deep-brain grey matter regions of interest (ROI) (Figure 1).
To account for the effect of age on brain susceptibility, linear fits of susceptibility against ln(age)10 were calculated for each ROI, for both SCA subjects and controls (Figure 2). The slopes of the calculated fits were used to correct the susceptibility values, using the mean age of the SCA subjects as the reference. The age-corrected susceptibility values were compared using analysis of variance (ANOVA) to assess the difference between the two groups. For the subjects with haemoglobin measurements (143 SCA and 30 controls), the effect of blood haemoglobin levels on susceptibility was also investigated using ANOVA.
Results
Significant positive correlations between susceptibility and age were found in all regions for the controls (Figure 2). In the SCA patients, significant positive correlations of susceptibility with age were found in the substantia nigra, red nucleus, dentate and globus pallidus. The results of the ANOVA statistical analysis are summarized in Figure 3. SCA patients were found to have a significantly lower mean age-corrected susceptibility in the caudate and the globus pallidus and significantly higher mean age-corrected susceptibility in the red nucleus and dentate (Figure 4). No significant differences between SCA subjects and controls were observed in any of the other regions. Haemoglobin showed a significant positive correlation with age-corrected susceptibility in the caudate, putamen and globus pallidus (Figure 5).Discussion
Prior work investigating susceptibility in SCA11,12 found increases in the red nucleus for an older (18.6±10.5 years) cohort of SCA patients in the UK, as observed here, but increases in the globus pallidus, in disagreement with our results. A separate analysis11 on a smaller, younger (9.9±2.1 years) cohort of Tanzanian children found significantly lower susceptibility in the putamen in SCA vs controls, and did not find any significant differences in the red nucleus, caudate nucleus or the globus pallidus, again disagreeing with our results. This discrepancy could be explained by the different age ranges of each cohort, as our previous UK study11 also showed faster increases in susceptibility over time in SCA patients relative to controls for most of the brain regions considered here. This differs from the results here, where controls see a greater increase in susceptibility over time for all of the regions considered. This could potentially be explained by the larger variation in susceptibilities in the SCA patients (Figure 4).Other factors not considered here may also have affected the results. For example, specific complications of SCA, like silent cerebral infarcts, have been associated with susceptibility changes in previous studies11,13.
These previous studies found either insignificant or negative effects of blood haemoglobin levels on susceptibility, which disagrees with our findings.
Future work will involve further optimization of the QSM pipeline to further reduce noise, which was high perhaps because of the short maximum TEs relative to T2* values at 1.5T.
Conclusion
We observed a significant increase in magnetic susceptibility in subjects with SCA relative to controls in the red nucleus and the dentate, and a significant decrease in susceptibility in the caudate nucleus and globus pallidus. Haemoglobin levels were positively correlated with susceptibility in the caudate, globus pallidus and putamen.Acknowledgements
This work is supported by the EPSRC-funded UCL Centre for Doctoral Training in Intelligent, Integrated Imaging in Healthcare (i4health) (EP/S021930/1)
References
1.Piel, F. B., Steinberg, M. H., & Rees, D. C. “Sickle Cell Disease”. New England Journal of Medicine, 376(16), 1561–1573, 2017
2. Tian Liu, Cynthia Wisnieff, Min Lou, Weiwei Chen, Pascal Spincemaille, and Yi Wang. “Nonlinear formulation of the magnetic field to source relationship for robust quantitative susceptibility mapping”. Magnetic Resonance in Medicine, 69(2):467–476, 2013.
3. Pascal Spincemaille, Alexey Dimov, and Yi Wang. “Correction of Residual Echo-to-Echo Phase Inconsistencies in Readout Phase Corrected Multi-Echo Gradient Echo for Quantitative Susceptibility Mapping”. In 4th International Workshop in MRI Phase Contrast & Quantitative Susceptbility Mapping, page 145, 2016.
4. Anita Karsa and Karin Shmueli. “SEGUE a Speedy rEgion-Growing algorithm for Unwrapping Estimated phase”. Proc. Joint Annual Meeting ISMRM-ESMRMB, Paris, France, PP:666, 2018.
5. Tian Liu, Ildar Khalidov, Ludovic de Rochefort, Pascal Spincemaille, Jing Liu, A. John Tsiouris, and Yi Wang. “A novel background field removal method for MRI using projection onto dipole fields (PDF)”. NMR in Biomedicine, 24(9): 1129–1136, 2011.
6. Anita Karsa, Shonit Punwani, and Karin Shmueli. “An optimized and highly repeatable MRI acquisition and processing pipeline for quantitative susceptibility mapping in the head-and-neck region”. Magnetic Resonance in Medicine, 84:3206–3222, 2020.
7. S.M. Smith. “Fast robust automated brain extraction”. Human Brain Mapping, 17(3):143-155, November 2002.
8. Li X, Chen L, Kutten K, et al. “Multi-atlas tool for automated segmentation of brain gray matter nuclei and quantification of their magnetic susceptibility”. Neuroimage, ;191:337-349 2019.
9. Jenkinson, M., Bannister, P., Brady, J. M. and Smith, S. M. “Improved Optimisation for the Robust and Accurate Linear Registration and Motion Correction of Brain Images”. NeuroImage, 17(2), 825-841, 2002.
10. Wei Li, Bing Wu, Anastasia Batrachenko, Vivian Bancroft-Wu, Rajendra A Morey, Vandana Shashi, Christian Langkammer, Michael D De Bellis, Stefan Ropele, Allen W Song, et al. Differential developmental trajectories of magnetic susceptibility in human brain gray and white matter over the lifespan. Human brain mapping, 35(6):2698–2713, 2014.
11. Russell Murdoch, “Developing MRI Quantitative Susceptibility Mapping to Investigate the Effect of Sickle Cell Anaemia on Brain Magnetic Susceptibility”, PhD thesis, University College London, 2022
12. Murdoch, R; Kawadler, J; Kirkham, F; Shmueli, K; (2019) MRI susceptibility mapping suggests elevated brain iron in sickle cell anaemia. In: Proceedings of the ISMRM 27th Annual Meeting & Exhibition. SMRT 28th Annual Meeting. (pp. pp. 1-3). International Society for Magnetic Resonance in Medicine (ISMRM)
13. Xin Miao, Soyoung Choi, Benita Tamrazi, Yaqiong Chai, Chau Vu, Thomas D. Coates, and John C. Wood. Increased brain iron deposition in patients with sickle cell disease: an mri quantitative susceptibility mapping study. Blood, 132:1618, 10 2018.
Figures
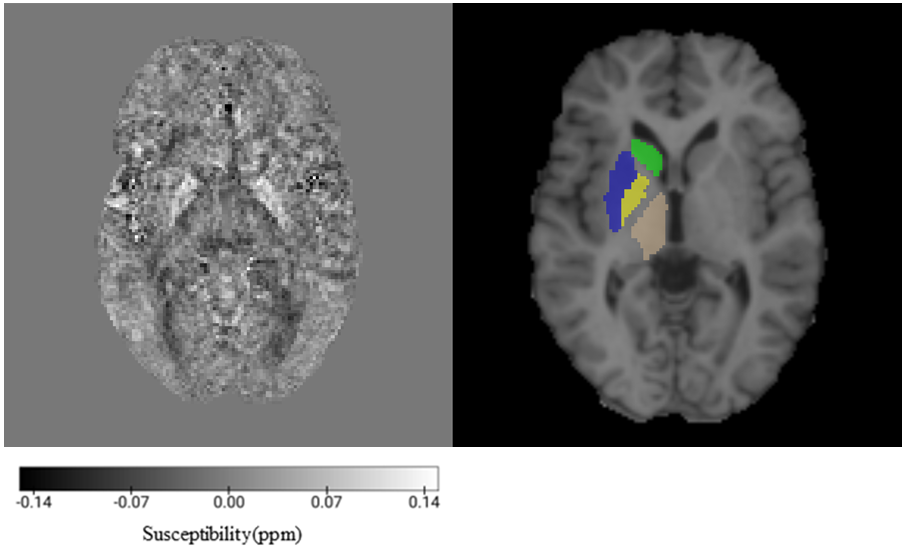
Figure 1: QSM and ROIs in an axial slice of a representative patient with SCA: (a) the susceptibility map; (b) coregistered T1W image with ROIs shown in one hemisphere: caudate – green, putamen – blue, globus pallidus – yellow, thalamus – brown.
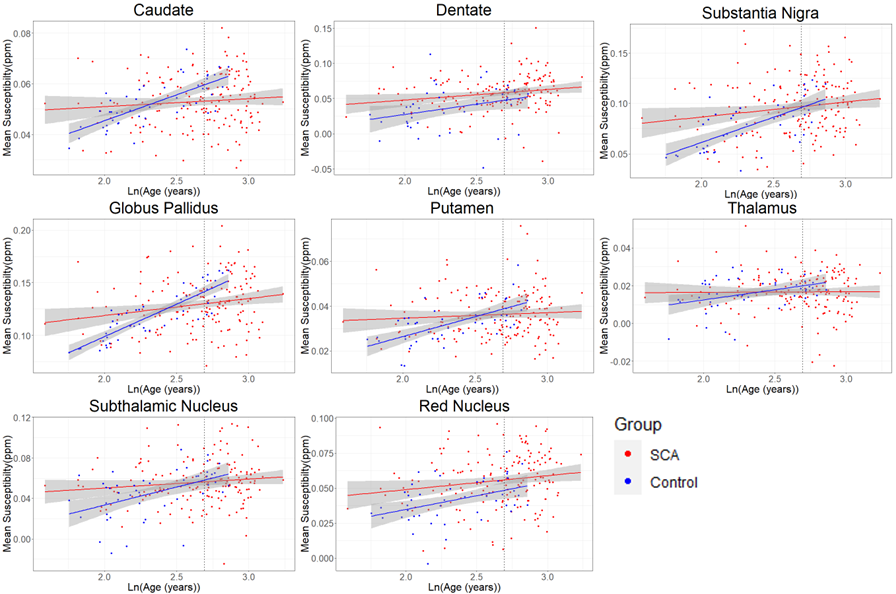
Figure 2: ROI mean susceptibility plotted as a function of ln(age) for each of the regions of interest. Linear fits for both the SCA patients and healthy controls are shown on each plot together with their 95% confidence intervals (shaded). The vertical dotted line on each plot shows the location of the mean SCA patient age, given by ln(14.9) = 2.70, used as a reference for age correction.

Figure 3: Table showing the results of ANOVA assessing the difference between the age-corrected mean susceptibility values for SCA subjects vs controls in each of the regions. Significance scores (p values) are shown in the final row, with statistically significant results (p<0.05) highlighted in bold.
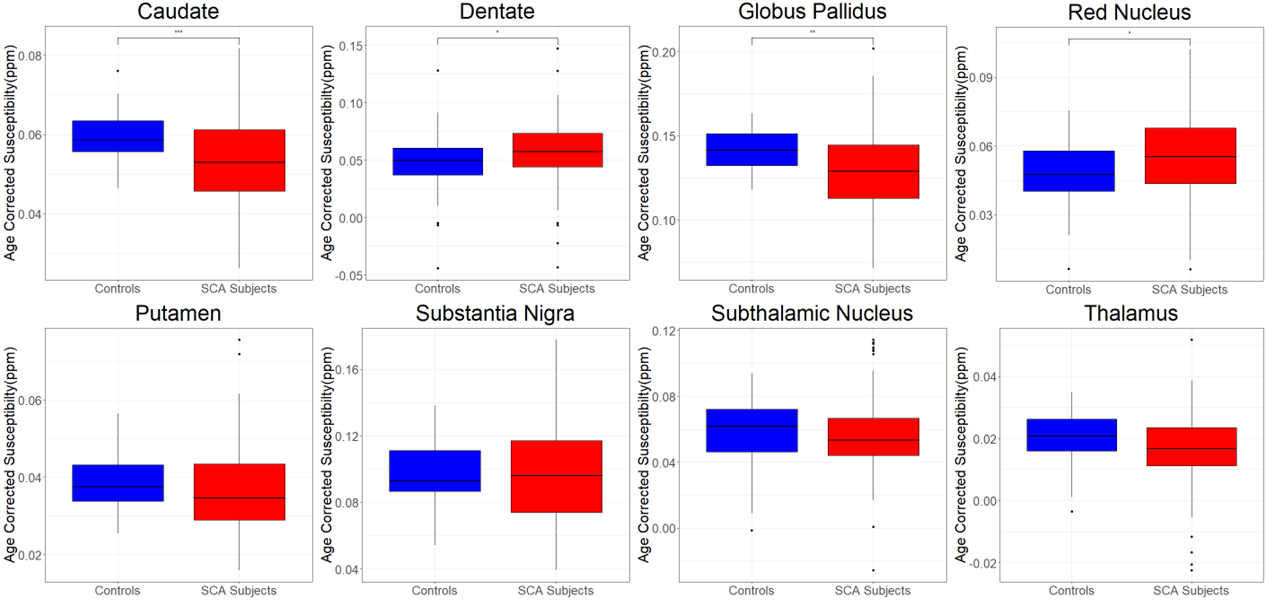
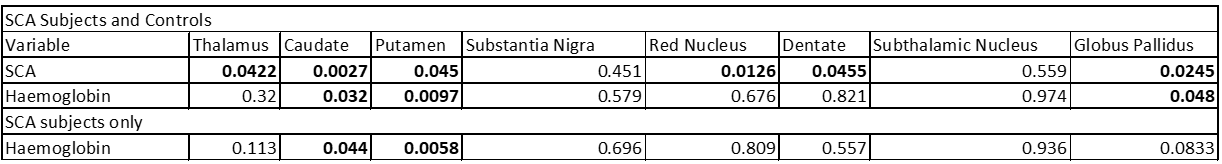
Figure 5: Table showing the results of ANOVA on the members of the cohort with haemoglobin measurements. P values are shown for the effect of SCA in the combined group and for the effect of haemoglobin in both the combined and SCA only groups with statistically significant results (p<0.05) highlighted in bold.