3366
Developmental Ramifications of the Screen Age: Uncovering Effects of Screen Time on Neural Maturation1Radiology and Medical Imaging, University of Virginia, East Greenwich, RI, United States, 2Radiology and Medical Imaging, University of Virginia, Charlottesville, VA, United States
Synopsis
Keywords: Gray Matter, Adolescents, Screen Time
Increased screen usage during adolescent development correlates with a complex response in the brain. Using a massive longitudinal human brain MRI dataset, we describe relationships between screen time and cellular microstructure across 13 cortical regions previously implicated in screen usage. Longitudinally, grey matter density had no relationship with screen time, and fractional anisotropy was significantly associated with screen time in only the ventromedial prefrontal cortex. However, microstructural 3T-CSD diffusion MRI metrics were significantly associated with increased screen time in 8 regions. The comparison between these results and typical age-associated development suggests potential negative implications of increased screen usage during adolescence.Introduction
Adolescence is a critical period for the growth and maturation of the brain and the development of cognitive capabilities that will affect the remainder of a child’s lifespan. As a result of technological advances and the COVID-19 pandemic, screen time usage is at an all-time high1. In adolescents, increased screen time has been linked to lower psychological well-being, but little is known about the relationship between screen time and neural development.2,3 This study examines structural and diffusion MRI scans from the longitudinal Adolescent Brain Cognitive Development (ABCD) study cohort to describe the effects of screen time on both grey matter density (GMD) and diffusion MRI (dMRI) tissue microstructure in the adolescent brain. 13 regions of interest (ROIs) are analyzed based on their involvement in control and reward systems from prior research on screen time in adolescence.3Methods
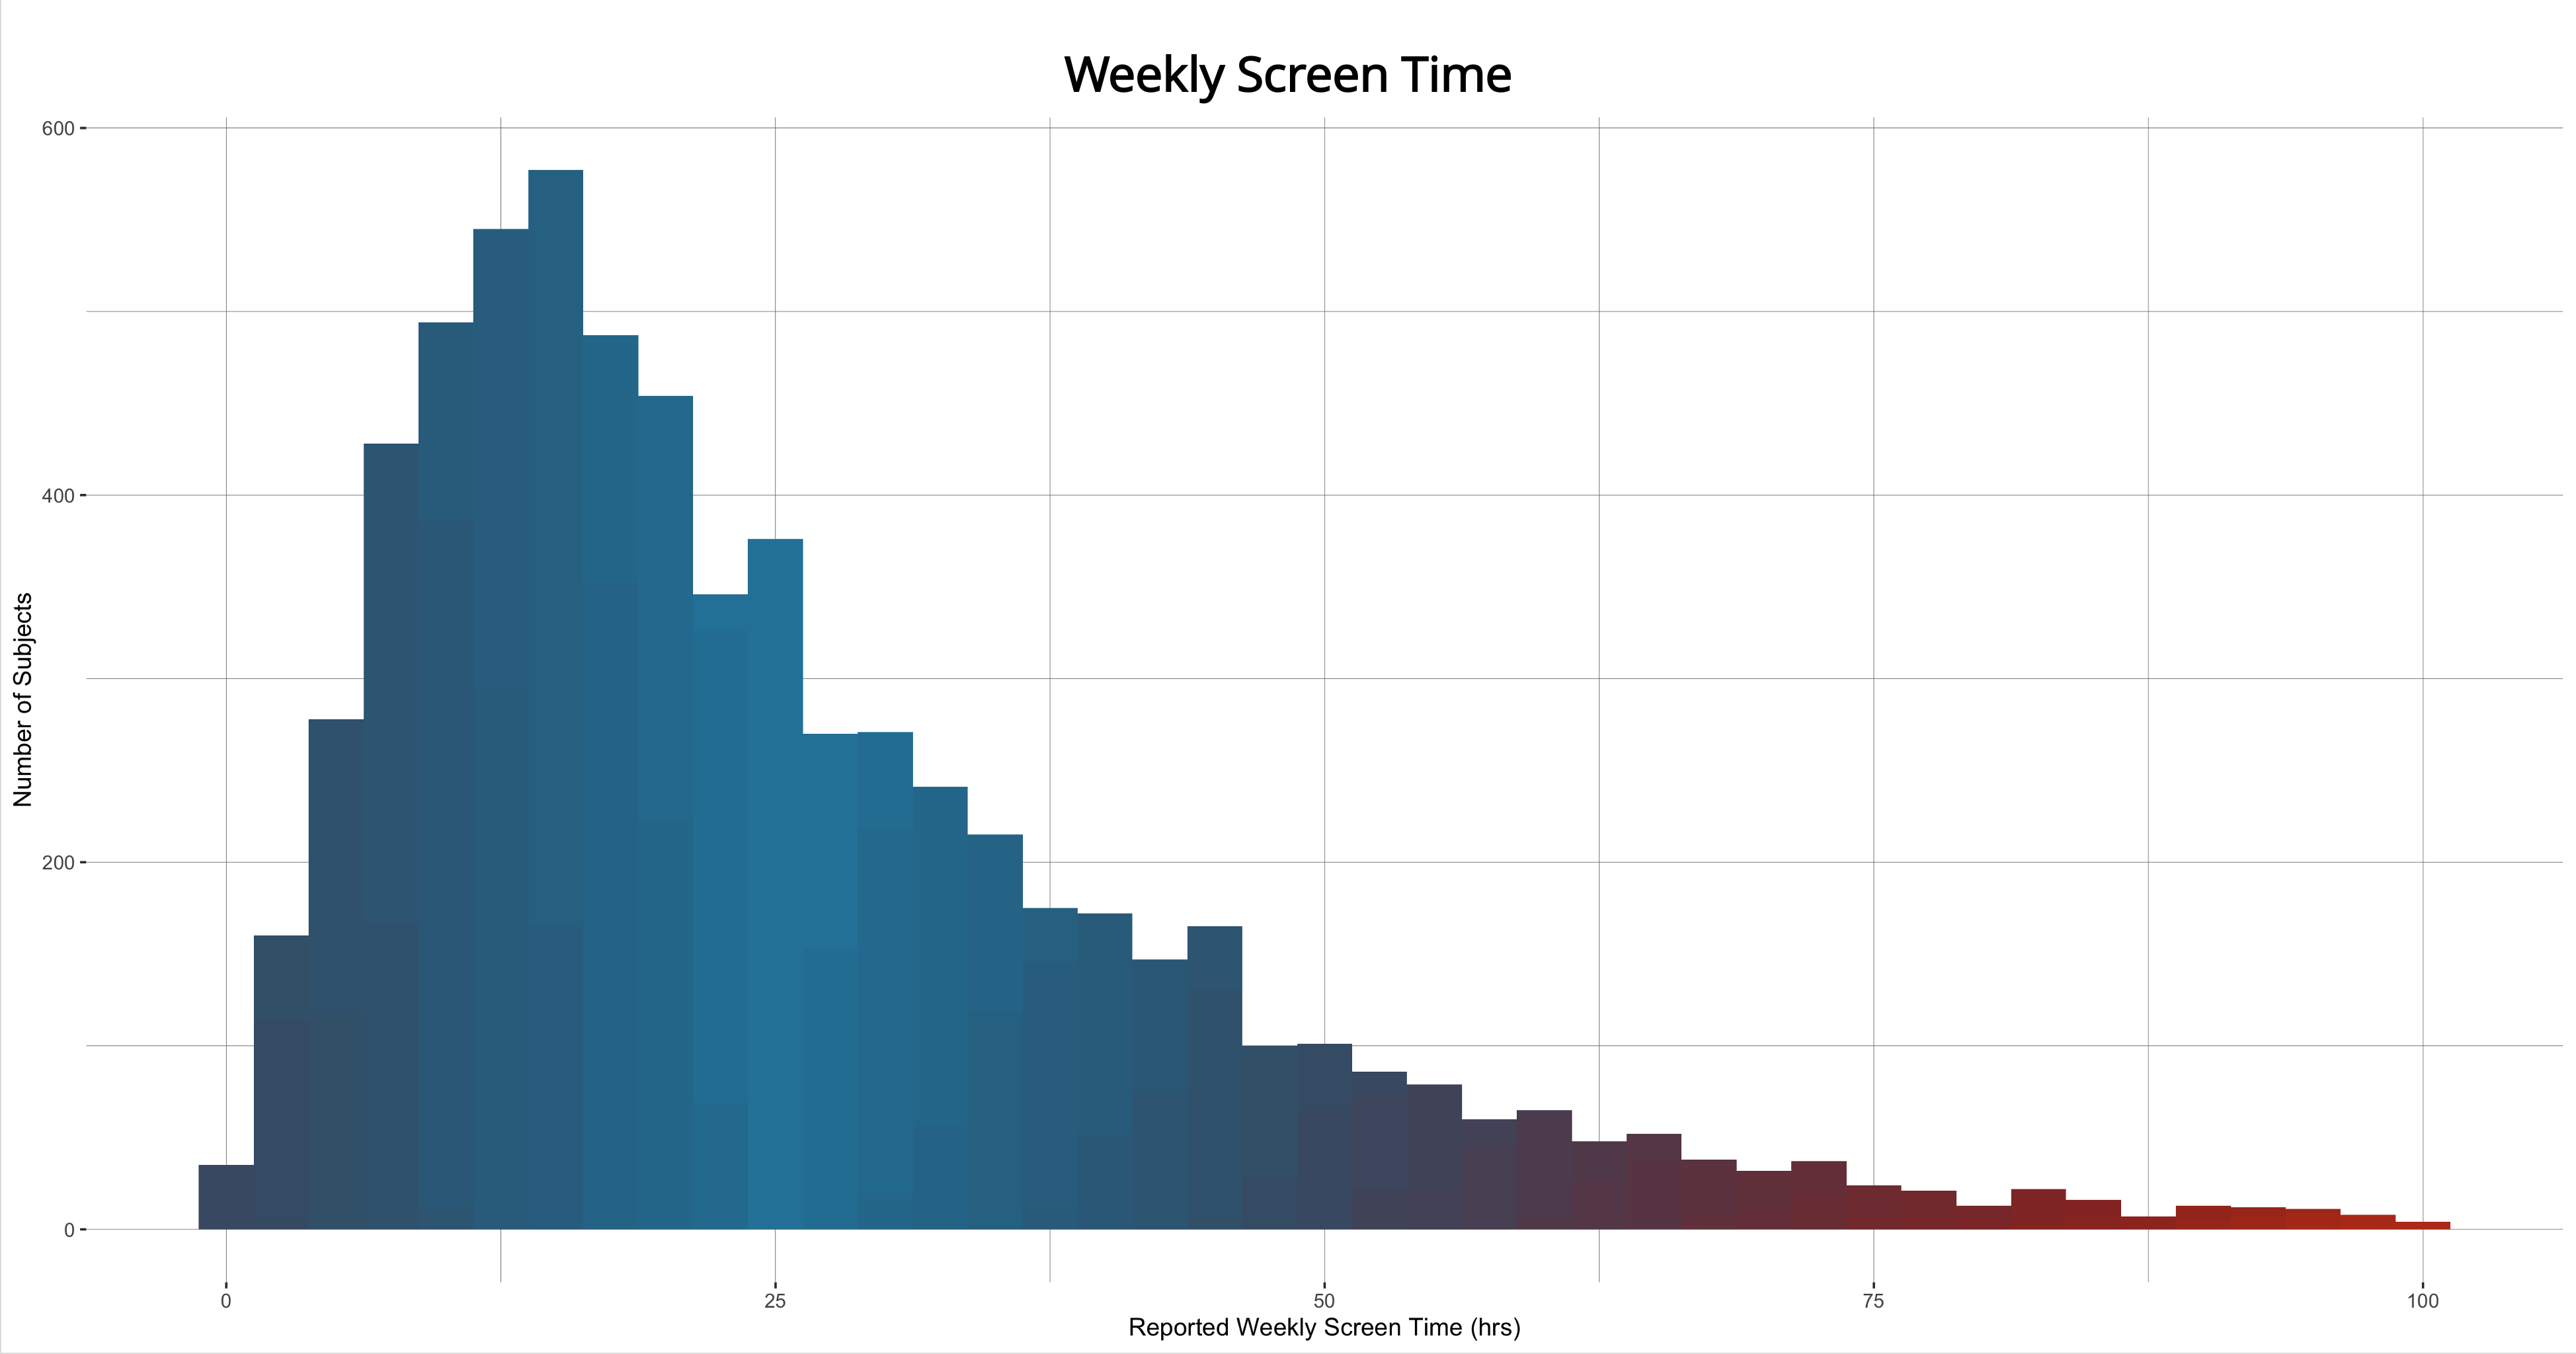
Longitudinal neuroimaging, screen time, and demographic data were gathered from the ABCD study 3.0 release: the largest adolescent neuroimaging dataset ever acquired in the United States with an enrollment of 11,874 subjects at baseline (ages 9-10 years old) and 6,571 at a 2-year follow-up. Data was pre-selected from sites with Siemen’s brand scanners to minimize manufacturer effects, then subjects with excessive motion or severe imaging artifacts were removed by a quality control process. Only subjects with quality control passing baseline and follow-up MRIs were used, resulting in the successful analysis of 4,578 structural and 2,919 diffusion scans. Screen time was provided from a parent report documenting subjects’ time spent on different screen mediums. These responses were aggregated and averaged across time points to obtain an average weekly screen time metric which was capped at 100 hours. Household incomes were used as a proxy metric of socioeconomic status.Each subject’s diffusion images were analyzed using 3-Tissue, Constrained Spherical Deconvolution (3T-CSD) implemented in the open-source software MRtrix and Mrtrix3Tissue.4,5 Several preprocessing steps utilized FSL.6,7 Diffusion images were denoised8, corrected for eddy current and motion distortions7, and upsampled to 1.3mm3. Preprocessed images were then run through our lab’s 3T-CSD pipeline, which outputs 3 tissue compartments as cellular microstructure signal fractions9. An intracellular anisotropic (ICA) or white matter-like compartment, intracellular isotropic (ICI) or gray matter-like compartment, and extracellular isotropic (ECI) or free water compartment. The mean voxel-wise value of each of these compartments was measured across each of the 13 ROIs of interest.
Voxel-based morphometry was applied to T1-weighted MPRAGE images collected by the ABCD Study.10,11 Images were preprocessed using N4 bias field correction implemented in ANTs12,13 and spatially normalized with the CAT12 toolbox implemented in SPM1214 in MATLAB (Mathworks, Natick, MA). Segmented images were multiplied by voxel volumes contained within the Jacobian determinant matrix of the deformation field, yielding relative measures of grey matter density in each voxel.9 Regional grey matter densities were then measured within each of the 13 ROIs of interest13.
All other imaging metrics used were provided by the ABCD Study. Imaging metrics were assessed for longitudinal relationships with weekly screen time and age using general linear models with subject age, sex, total brain volume, scanning site, socioeconomic status, and nested sibling and family relationships as covariates. The resulting significance was corrected for multiple comparisons using the Holm-Bonferroni method.
Results
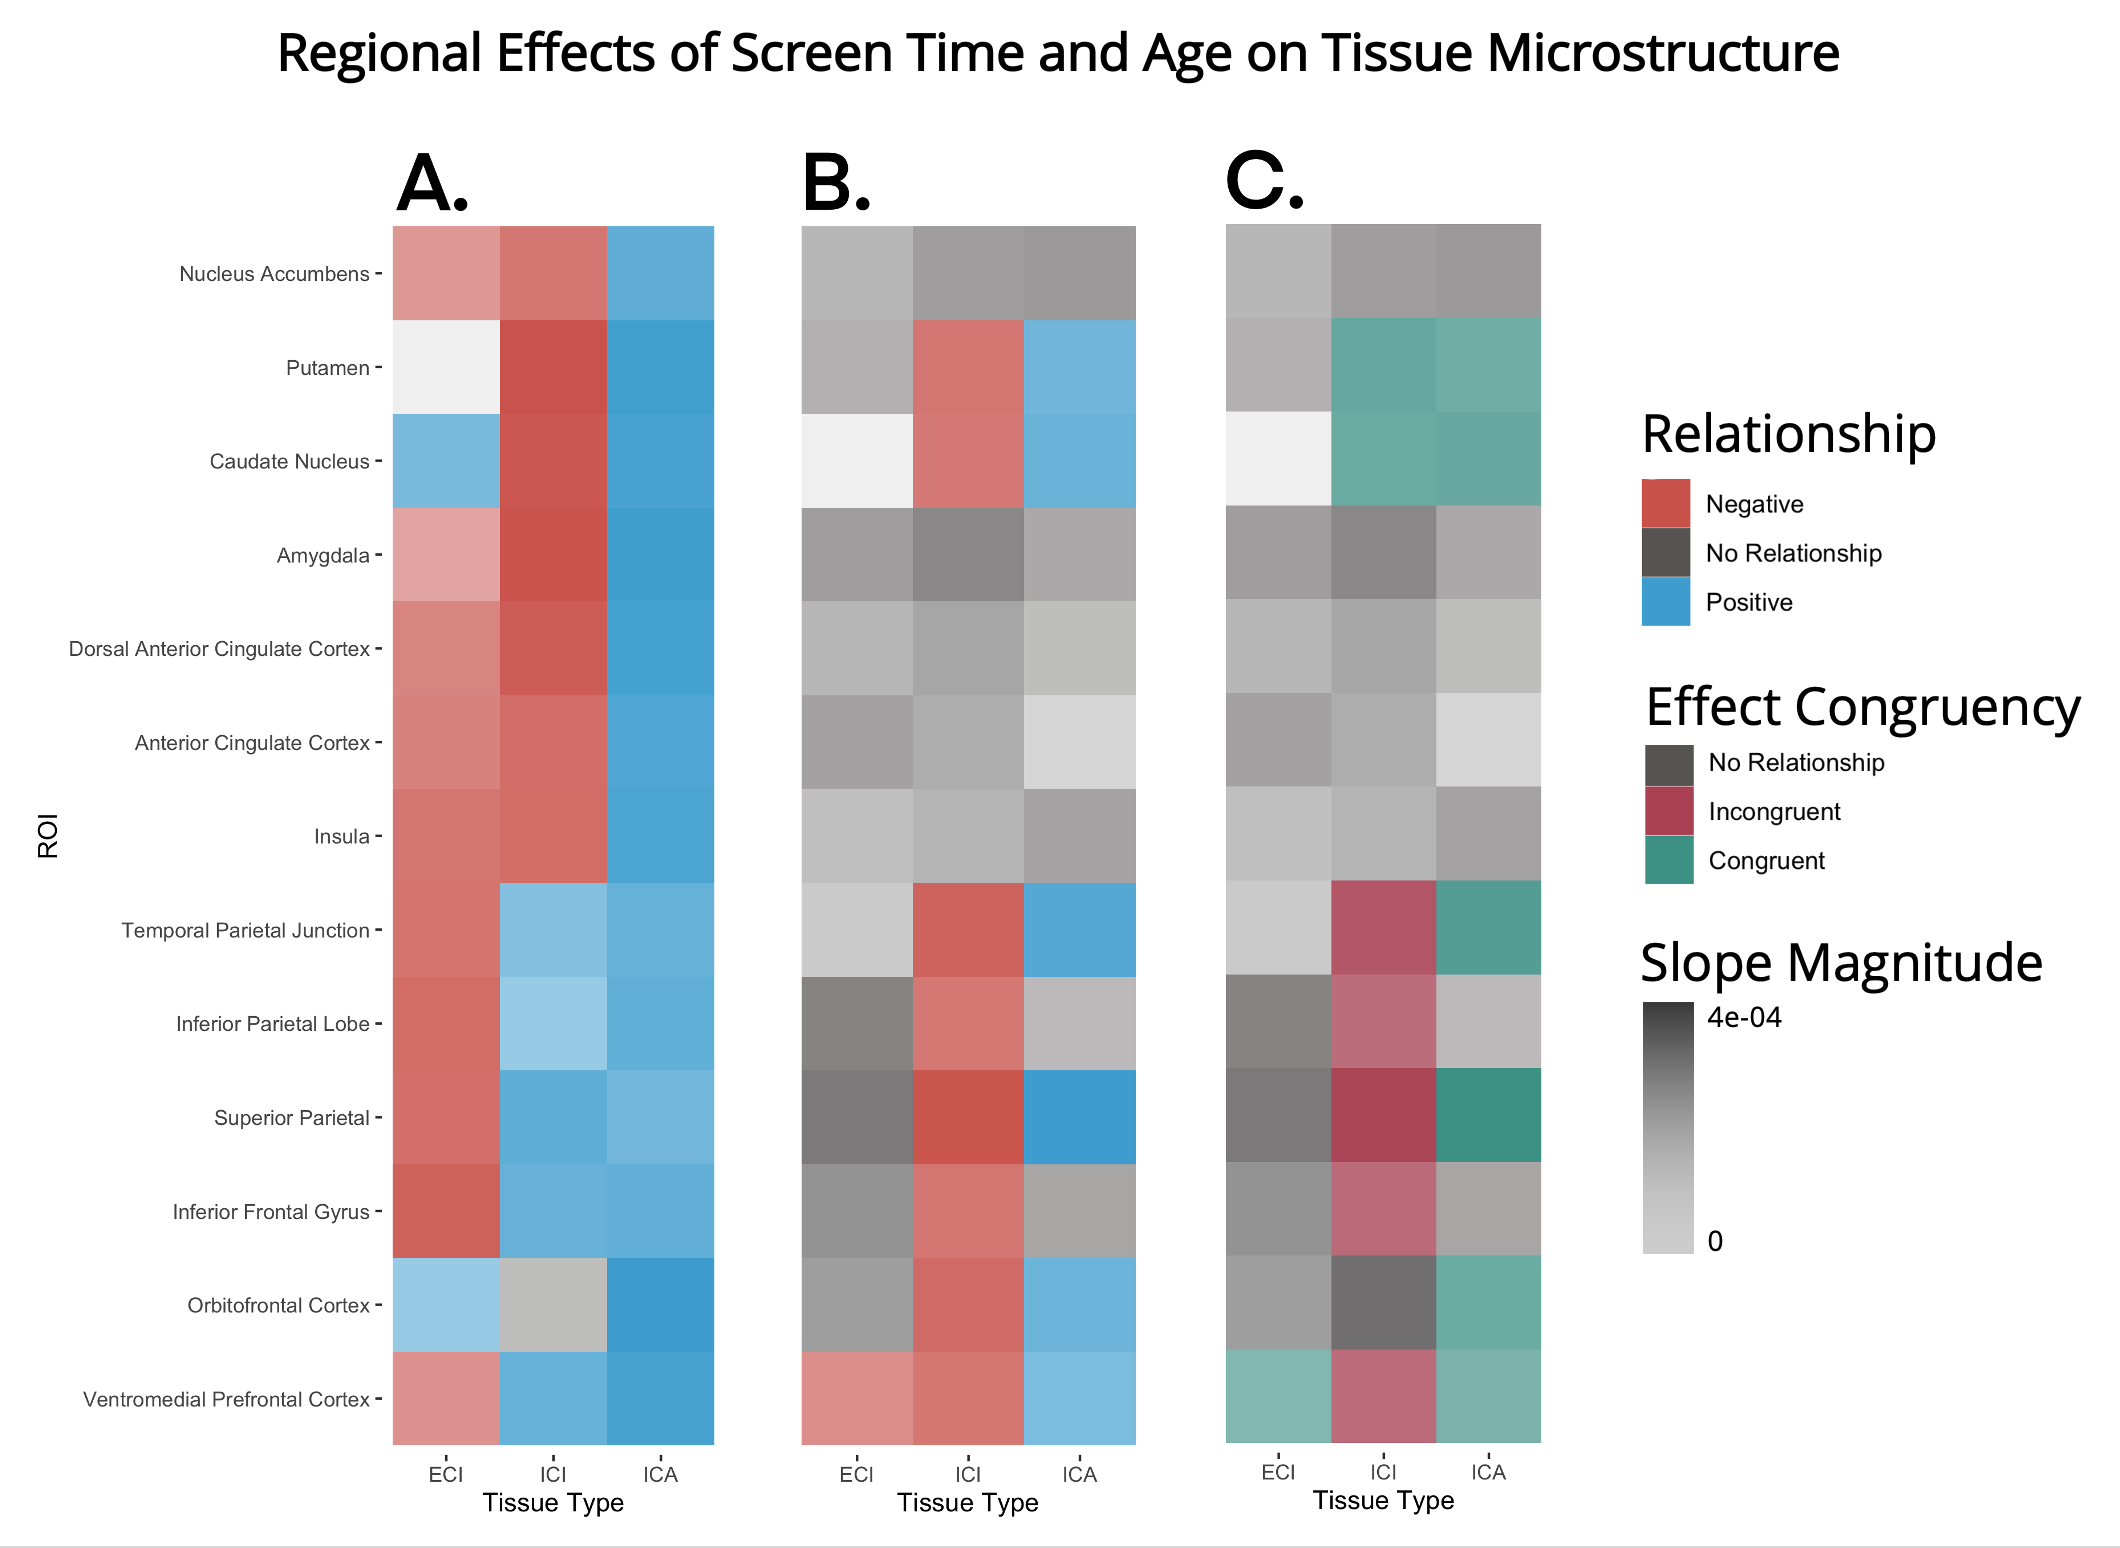
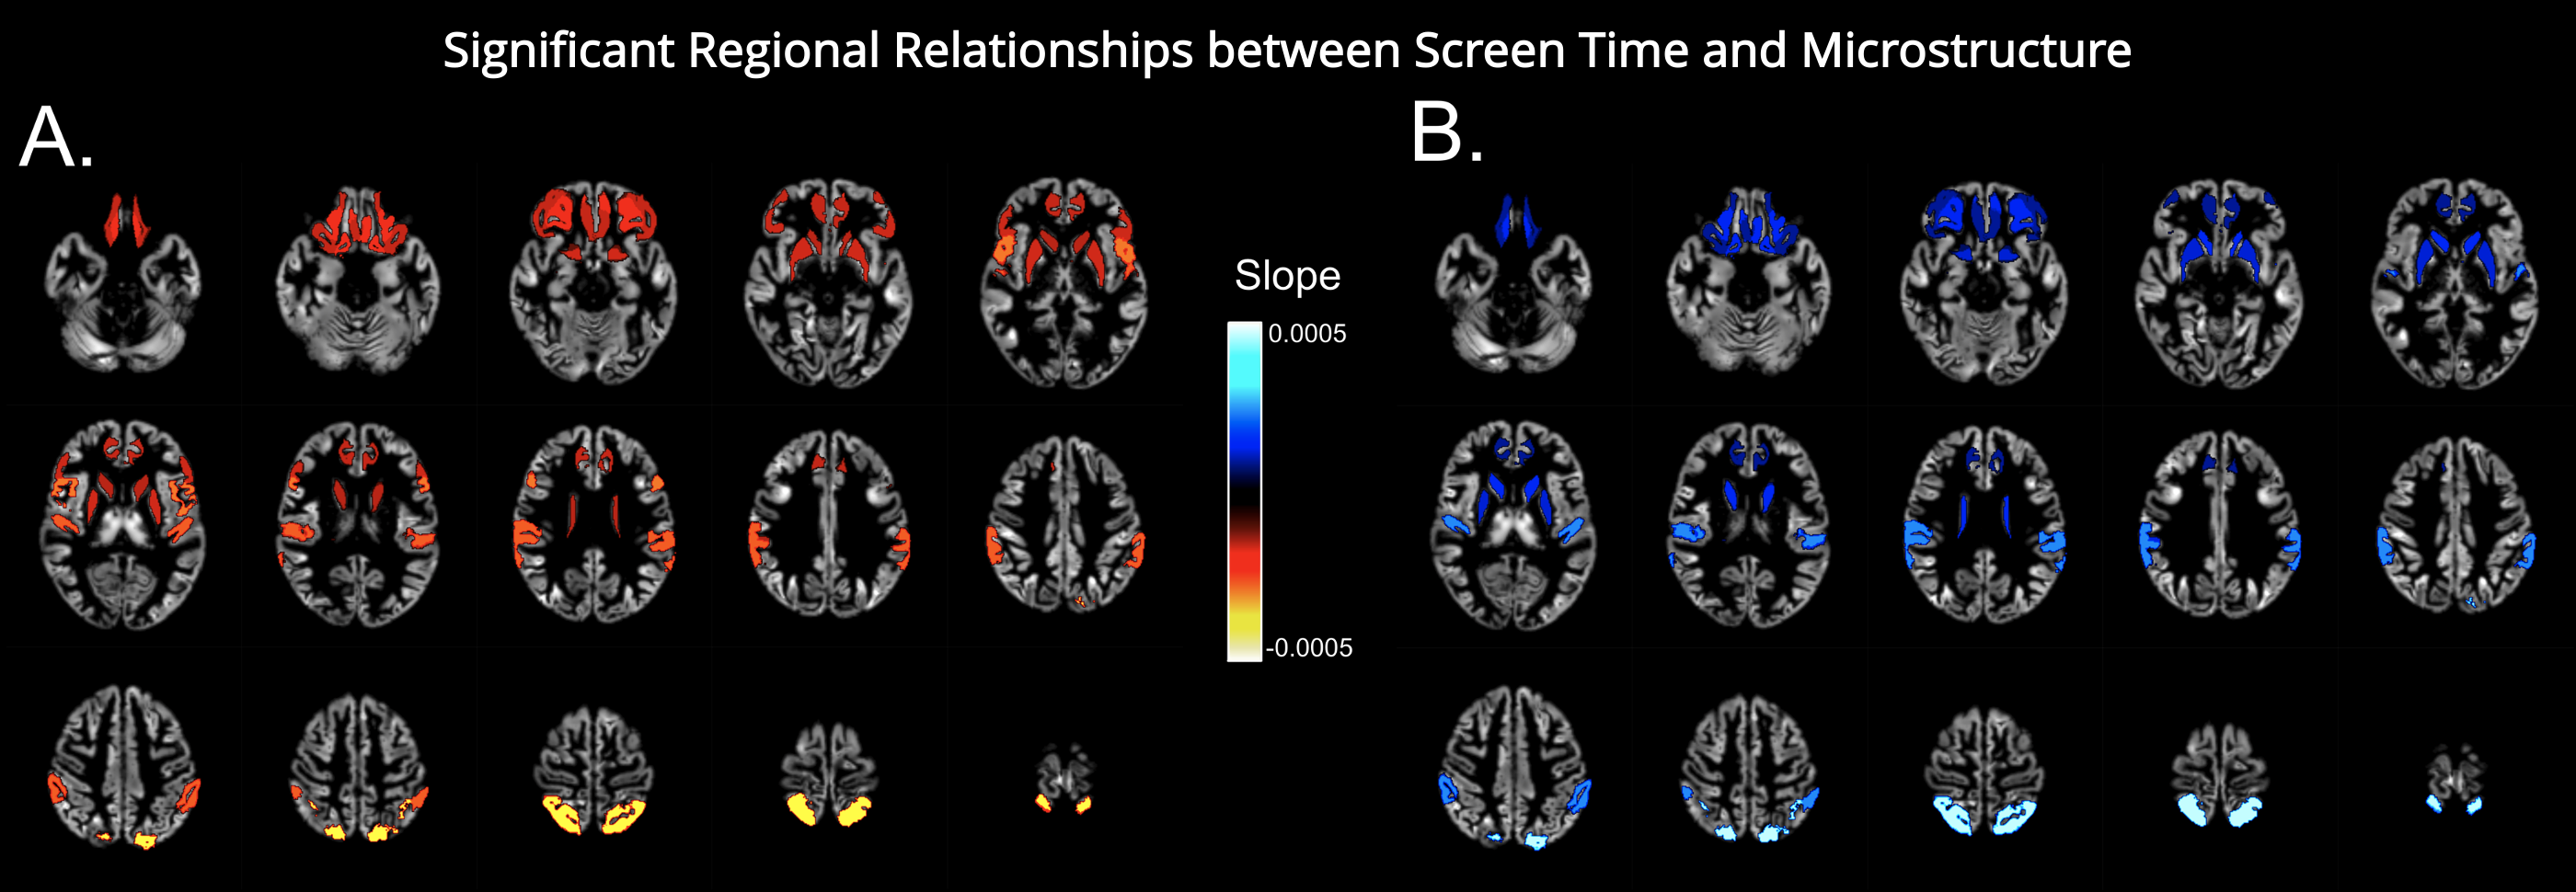
Significant longitudinal associations between screen time and 3T-CSD tissue microstructure were found in 8 regions [FIG 2B]. A significant positive correlation was observed between screen time and ICA signal fraction in the ventromedial prefrontal cortex, the orbitofrontal cortex, the superior parietal lobe, the temporal parietal junction, the caudate nucleus, and the putamen. In these regions and the inferior frontal gyrus and inferior parietal lobe, a correspondingly significant negative correlation between screen time and ICI signal fraction was observed [FIG 3].Longitudinal relationships between 3T-CSD metrics and age are widespread and largely incongruent with the relationship between 3T-CSD metrics and screen time [FIG 2C]. Subject age is positively correlated with ICI signal across all 13 ROIs and ICA signal in the ventromedial prefrontal cortex, the inferior frontal gyrus, the superior parietal lobe, and the temporal parietal junction. Age is negatively correlated with ICA signal in the insula, the ACC, the amygdala, the caudate nucleus, the putamen, and the nucleus accumbens [FIG 2A].
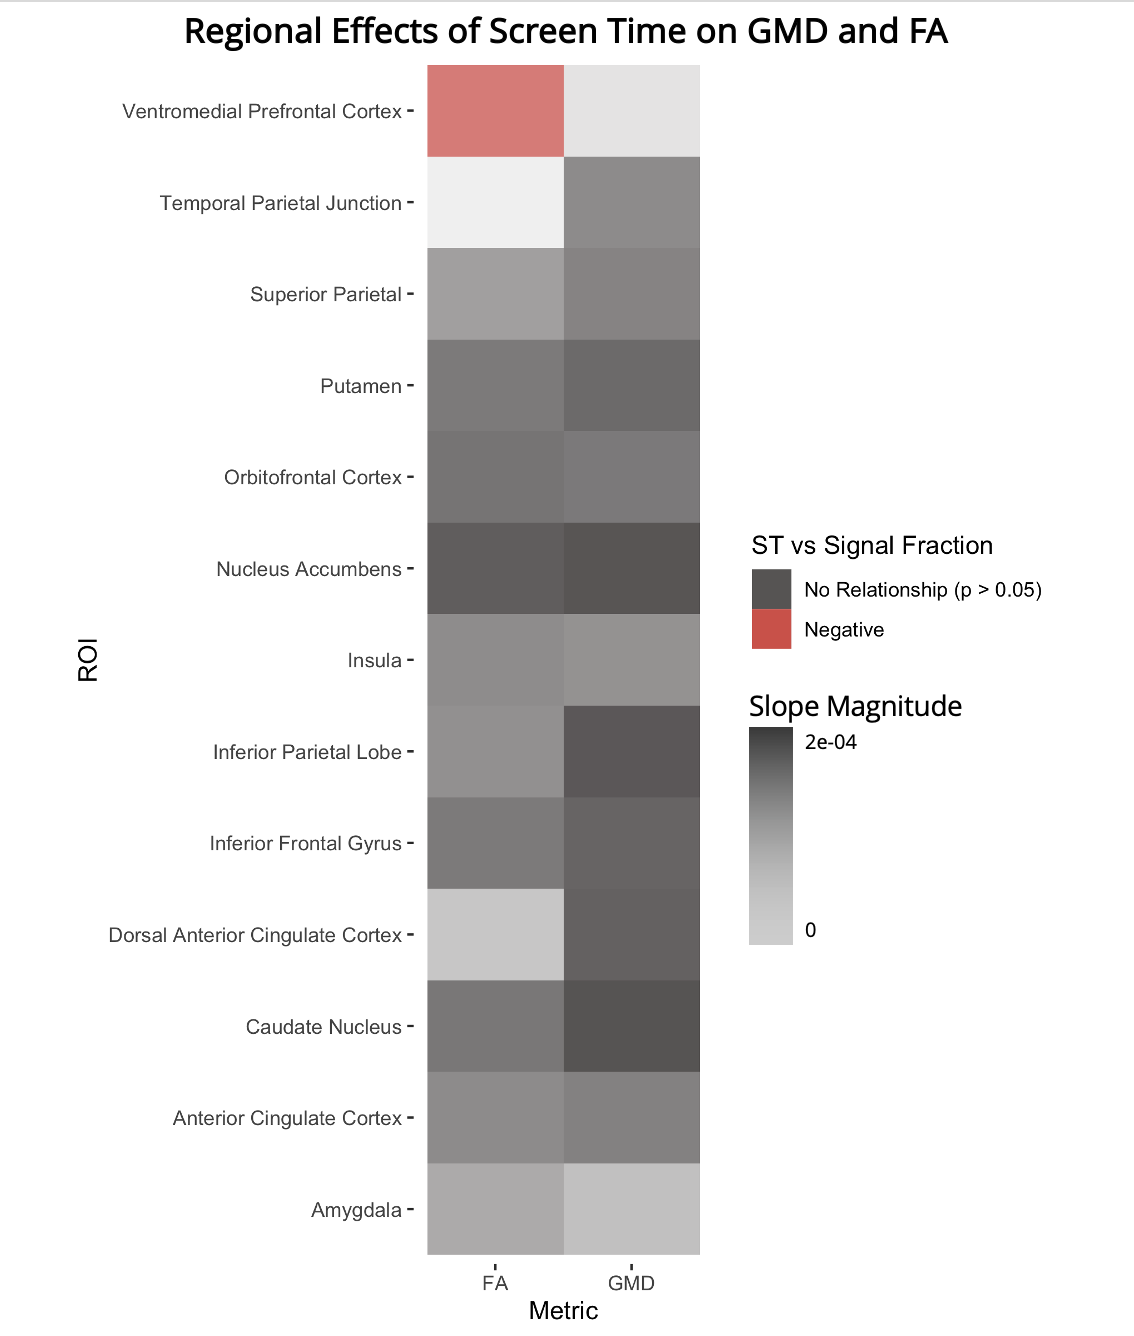
No significant relationships were observed between increased screen time and GMD in any of the 13 ROIs longitudinally. To highlight the sensitivity of 3T-CSD metrics, independently calculated FA values provided by the ABCD study were tested for associations with screen time in each of the 13 ROIs. Only the ventromedial prefrontal cortex showed a significant negative correlation between screen time and FA [FIG 4].
Discussion
The lack of significant results quantifying cortical development using GMD and FA, coupled with positive results using dMRI tissue microstructure, supports the notion that 3T-CSD may be capable of detecting more subtle shifts in tissue microstructure. By using this more detailed approach, this study suggests that increased screen time usage significantly affects brain development and that this relationship may be working against typical age-related development in cortical regions. Future research on cognitive effects is required to understand the developmental impacts of this process.Acknowledgements
No acknowledgement found.References
1) Pandya A., Lodha P. “Social Connectedness, Excessive Screen Time During COVID-19 and Mental Health: A Review of Current Evidence.” Frontiers in Human Dynamics (2021)
2) Twenge JM, Campbell WK. “Associations between screen time and lower psychological well-being among children and adolescents: Evidence from a population-based study.” Prev Med Rep (2018)
3) Marciano, Laura, Anne-Linda Camerini, and Rosalba Morese. “The developing brain in the digital era: a scoping review of structural and functional correlates of screen time in adolescence.” Frontiers in psychology (2021)
4) Dhollander, T. & Connelly, A. "A novel iterative approach to reap the benefits of multi- tissue CSD from just single-shell (+ b= 0) diffusion MRI data." in Proc ISMRM vol. 24 3010 (2016)
5) Tournier, J.-D. et al. "MRtrix3: A fast, flexible and open software framework for medical image processing and visualisation." NeuroImage 202, 116137 (2019)
6) Jenkinson, M., Beckmann, C. F., Behrens, T. E., Woolrich, M. W. & Smith, S. M. "FSL". Neuroimage 62, 782–790 (2012)
7) Smith, S. M. et al. "Advances in functional and structural MR image analysis and implementation as FSL." Neuroimage 23, S208–S219 (2004)
8) Veraart, J., Fieremans, E. & Novikov, D. S. "Diffusion MRI noise mapping using randommatrix theory." Magn. Reson. Med. 76, 1582–1593 (2016)
9) Newman, B. T., Dhollander, T., Reynier, K. A., Panzer, M. B. & Druzgal, T. J. "Test– retest reliability and long‐term stability of three‐tissue constrained spherical deconvolution methods for analyzing diffusion MRI data." Magn. Reson. Med. 84, 2161– 2173 (2020)
10) Mechelli A, Price CJ, Friston KJ, Ashburner J. "Voxel-based morphometry of the human brain: methods and applications." Curr Med Imaging Rev; 1(2): 105-113 (2005)
11) Ashburner J, Friston KJ. "Voxel-based morphometry--the methods." Neuroimage 11(6 Pt 1): 805-21. doi:10.1006/nimg.2000.0582 (2000)
12) Tustison, N. J., Avants, B. B., Cook, P. A., Zheng, Y., Egan, A., Yushkevich, P. A., & Gee, J. C. "N4ITK: improved N3 bias correction." IEEE transactions on medical imaging, 29(6), 1310-1320. (2010)
13) Avants, B. B., Tustison, N., & Song, G. "Advanced normalization tools (ANTS)." Insight j, 2(365), 1-35.(2009)
14) Ashburner, J., Barnes, G., Chen, C. C., Daunizeau, J., Flandin, G., Friston, K., ... & Penny, W. "SPM12 manual." Wellcome Trust Centre for Neuroimaging, London, UK, 2464, 4. (2014)
Figures