3365
Analyzing Cortical Thickness and Volume in patients with Sickle Cell Disease using 7T-MRI
Sharadhi Umesh Bharadwaj1, Tales Santini2, Joel D.K Disu1, Busola Oluwole3, Enrico M. Novelli4,5,6, Tamer S Ibrahim7,8,9, and Sossena Wood1,10
1Biomedical Engineering, Carnegie Mellon University, Pittsburgh, PA, United States, 2University of Pittsburgh, Pittsburgh, PA, United States, 3University of Washington/Fred Hutch, Seattle, WA, United States, 4Vascular Medicine Institute, University of Pittsburgh Medical Center, Pittsburgh, PA, United States, 5Department of Hematology/Oncology, University of Pittsburgh Medical Center, Pittsburgh, PA, United States, 6Sickle Cell Center of Excellence, University of Pittsburgh Medical Center, Pittsburgh, PA, United States, 7Department of Bioengineering, University of Pittsburgh, Pittsburgh, PA, United States, 8Department of Radiology, University of Pittsburgh, Pittsburgh, PA, United States, 9Department of Psychiatry, University of Pittsburgh, Pittsburgh, PA, United States, 10Neuroscience Institute, Carnegie Mellon University, Pittsburgh, PA, United States
1Biomedical Engineering, Carnegie Mellon University, Pittsburgh, PA, United States, 2University of Pittsburgh, Pittsburgh, PA, United States, 3University of Washington/Fred Hutch, Seattle, WA, United States, 4Vascular Medicine Institute, University of Pittsburgh Medical Center, Pittsburgh, PA, United States, 5Department of Hematology/Oncology, University of Pittsburgh Medical Center, Pittsburgh, PA, United States, 6Sickle Cell Center of Excellence, University of Pittsburgh Medical Center, Pittsburgh, PA, United States, 7Department of Bioengineering, University of Pittsburgh, Pittsburgh, PA, United States, 8Department of Radiology, University of Pittsburgh, Pittsburgh, PA, United States, 9Department of Psychiatry, University of Pittsburgh, Pittsburgh, PA, United States, 10Neuroscience Institute, Carnegie Mellon University, Pittsburgh, PA, United States
Synopsis
Keywords: Gray Matter, High-Field MRI, Sickle cell disease, cortical thickness, cortical volume
The study compares cortical thickness and volume between patients with Sickle Cell Disease (SCD) and healthy controls (HC). There were no significant differences in the cortical thickness and volume of the whole brain between HC and patients with SCD. We found significant differences (p<0.05) in the temporal and parietal regions between HC and patients with SCD. We found significant differences in the parietal and frontal lobes between severe SCD (HbSS) and HC. Between patients with mild SCD (HbSC and HbSβ+thalassemia) and HC, significant differences in cortical thickness in the inferior parietal and lateral occipital regions were found.Introduction
Sickle Cell Disease (SCD) is a monogenic disorder caused by hemoglobin S polymerization, which can lead to significant neurological complications1. It is one of the most prevalent hemoglobinopathies in the world, affecting roughly 89,000 persons in the US2. Introduction of novel treatment methods has increased life expectancy of patients but has made them prone to a high burden of chronic complications, including those affecting the central nervous system. The effects of SCD on the aging brain include cortical atrophy3, a reduction in hippocampal volume4, thalamus, and intracranial volume in adults, and cortical thickness in children1,5. However, no studies have shown the regional reduction in cortical volume and thickness in specific brain regions in adults beyond the frontal regions, the hippocampus, and thalamus in adults with SCD. Cortical atrophy has been associated with abnormalities like silent cerebral infarcts in adults and large vessel vasculopathy in children3, hence, evaluations of cortical thinning and volume measures are helpful for SCD. In this study, we hypothesized significant reductions in cortical thickness and volume throughout the whole brain, frontal and parietal brain regions of patients with SCD compared to healthy age-matched controls using 7T MRI to provide a higher resolution and specificity when compared to a lower field strengths6.Methods
ParticipantsMRI data were acquired from a total of 101 adults with steady-state SCD (n=60, mean age=36.24+/-12.2 years, Severe Phenotype: 18 HbSS; Mild phenotype: 14 HbSC and 5 HbSβ+thalassemia) and healthy controls (HC) (n=48, mean age= 33.8+/-10.48 years). Recruited HC were sex, race, and age-matched to the patients with SCD.
MRI acquisition
7T scanner (MAGNETOM, Siemens) was used to acquire the MRI Magnetization Prepared Rapid Gradient Echo (MPRAGE) scans with a customized RF head coil7,8. The head coil consists of 16 transmit channels and 32 receive channels4 and provides whole brain homogenous images. The T1-weighted MPRAGE was acquired with an acquisition time of 5.02 mins, and TE/TR/TI=2.17/3000/1200 ms and an isotropic resolution of 0.75mm3.
Preprocessing
The 7T MPRAGE scans were bias corrected using the SPM12’s bias correction algorithm9 and coregistered to a scan of a healthy control using a rigid-body model for alignment, which was chosen by visual inspection. These scans were then preprocessed by Freesurfer11 to conduct skull stripping and intensity normalization10.
Segmentation
Segmentation and surface extraction were conducted using Freesurfer, which performs reconstruction of the white matter and the pial surface based on the intensity of the gradient1. These surfaces were used to quantify cortical volume and thickness. A final total of 77 participants were analyzed (37 SCD and 40 HC) after excluding 23 subjects due to motion artifacts. Data from 17 participants were further discarded from group analysis due to either noise in the sequence, holes in segmentation, and/or brain abnormalities causing the segmentation to fail.
Group Analysis
Group analysis was conducted to evaluate differences in the cortical thickness and volume using the group analysis stream on Freesurfer. The comparisons were made between: 1) HC and all patients with SCD; 2) HC and severe SCD; and 3) severe and mild SCD. The results from segmentation were coregistered across the participants. A model was generated based on the subject categories as a function of disease using a generalized linear model (GLM), and best fit was calculated12. Cluster correction was performed with cluster-forming threshold of p<0.01 and cluster-wise p-values < 0.05.
Results
We found no significant differences in whole brain cortical thickness and volume between all patients with SCD and HC (p-value=0.4508). However, we found significant differences in cortical thickness of specific regions. The left superior temporal and superior parietal regions were significantly thicker in HC compared to all patients with SCD (p< 0.05). Further comparisons between mild and severe SCD resulted in two significantly different clusters — the rostral middle frontal region and the pericalcarine (p-value < 0.05), where patients with severe SCD have a higher thickness in pericalcarine region (p-value < 0.05). Significant difference (p-value<0.05) was seen in the lateral occipital region in the left hemisphere and inferior parietal region in the right hemisphere between mild SCD and HC in cortical thickness. We found significant differences (p < 0.05) in the parietal and frontal lobes between HbSS and healthy controlsDiscussion and Future Work
We found a reduced thickness in the superior temporal region which aligns with studies showing a reduction in hippocampal subfields volume and thalamus volume belonging to superior temporal regions4,13. Cortical thinness has been associated with a lower cognitive reserve in other neurological diseases such as Alzheimer’s14, and in patients with SCD, lower executive functioning and processing speed has been associated with activations in the frontal and parietal regions of the brain15. Hence, our results showing significant differences in cortical thickness and volume in regions associated with the frontal and parietal lobes in patients with severe SCD when compared to HC are crucial in further understanding the effects of cortical pathology on cognition. Future studies will explore the correlations of the differences with cognitive and clinical outcomes. Additionally, a longitudinal follow-up study is ongoing to determine the rate of progression of cortical thinning and volume loss in patients with SCD, and investigate its risk factors on SCD.Acknowledgements
This work was supported by the National Institutes of Health under award number: R01HL127107. The first author was partially supported by Carnegie Mellon University’s Department of Biomedical Engineering 2022 research summer award.References
1. Kirk GR, Haynes MR, Palasis S, et al. Regionally Specific Cortical Thinning in Children with Sickle Cell Disease. Cereb Cortex. 2009;19(7):1549-1556. doi:10.1093/cercor/bhn1932. Saraf SL, Molokie RE, Nouraie M, et al. Differences in the clinical and genotypic presentation of sickle cell disease around the world. Paediatr Respir Rev. 2014;15(1):4-12. doi:10.1016/j.prrv.2013.11.003
3. Stotesbury H, Kawadler JM, Saunders DE, Kirkham FJ. MRI detection of brain abnormality in sickle cell disease. Expert Rev Hematol. 2021;14(5):473-491. doi:10.1080/17474086.2021.1893687
4. Santini T, Koo M, Farhat N, et al. Analysis of hippocampal subfields in sickle cell disease using ultrahigh field MRI. NeuroImage Clin. 2021;30:102655. doi:10.1016/j.nicl.2021.102655
5. Vichinsky EP, Neumayr LD, Gold JI, et al. Neuropsychological Dysfunction and Neuroimaging Abnormalities in Neurologically Intact Adults With Sickle Cell Anemia. JAMA. 2010;303(18):1823-1831. doi:10.1001/jama.2010.562
6. Lüsebrink F, Speck O. Beyond high resolution: Pitfalls in quantification of cortical thickness based on higher and ultra-high resolution data. Accessed November 7, 2022. https://cds.ismrm.org/protected/18MProceedings/PDFfiles/2834.html
7. Santini T, Wood S, Krishnamurthy N, Martins T, Aizenstein HJ, Ibrahim TS. Improved 7 Tesla transmit field homogeneity with reduced electromagnetic power deposition using coupled Tic Tac Toe antennas. Sci Rep. 2021;11(1):3370. doi:10.1038/s41598-020-79807-9
8. Zhao Y, Zhao T, Raval SB, et al. Dual optimization method of radiofrequency and quasistatic field simulations for reduction of eddy currents generated on 7T radiofrequency coil shielding: Reduction of Eddy Currents. Magn Reson Med. 2015;74(5):1461-1469. doi:10.1002/mrm.25424
9. Ashburner J, Friston KJ. Unified segmentation. NeuroImage. 2005;26(3):839-851. doi:10.1016/j.neuroimage.2005.02.018
10. Fischl B, Salat DH, Busa E, et al. Whole Brain Segmentation: Automated Labeling of Neuroanatomical Structures in the Human Brain. Neuron. 2002;33(3):341-355. doi:10.1016/S0896-6273(02)00569-X
11. FsTutorial/PialEdits_freeview - Free Surfer Wiki. Accessed November 6, 2022. https://surfer.nmr.mgh.harvard.edu/fswiki/FsTutorial/PialEdits_freeview
12. Fischl B, Sereno MI, Tootell RBH, Dale AM. High-resolution intersubject averaging and a coordinate system for the cortical surface. Hum Brain Mapp. 1999;8(4):272-284. doi:10.1002/(SICI)1097-0193(1999)8:4<272::AID-HBM10>3.0.CO;2-4
13. Mackin RS, Insel P, Truran D, et al. Neuroimaging abnormalities in adults with sickle cell anemia: Associations with cognition. Neurology. 2014;82(10):835-841. doi:10.1212/WNL.0000000000000188
14. Querbes O, Aubry F, Pariente J, et al. Early diagnosis of Alzheimer’s disease using cortical thickness: impact of cognitive reserve. Brain. 2009;132(8):2036-2047. doi:10.1093/brain/awp105
15. Clayden JD, Stotesbury H, Kawadler JM, et al. Structural connectivity mediates the relationship between blood oxygenation and cognitive function in sickle cell anemia. Blood Adv. Published online August 10, 2022:bloodadvances.2021006751. doi:10.1182/bloodadvances.2021006751
Figures
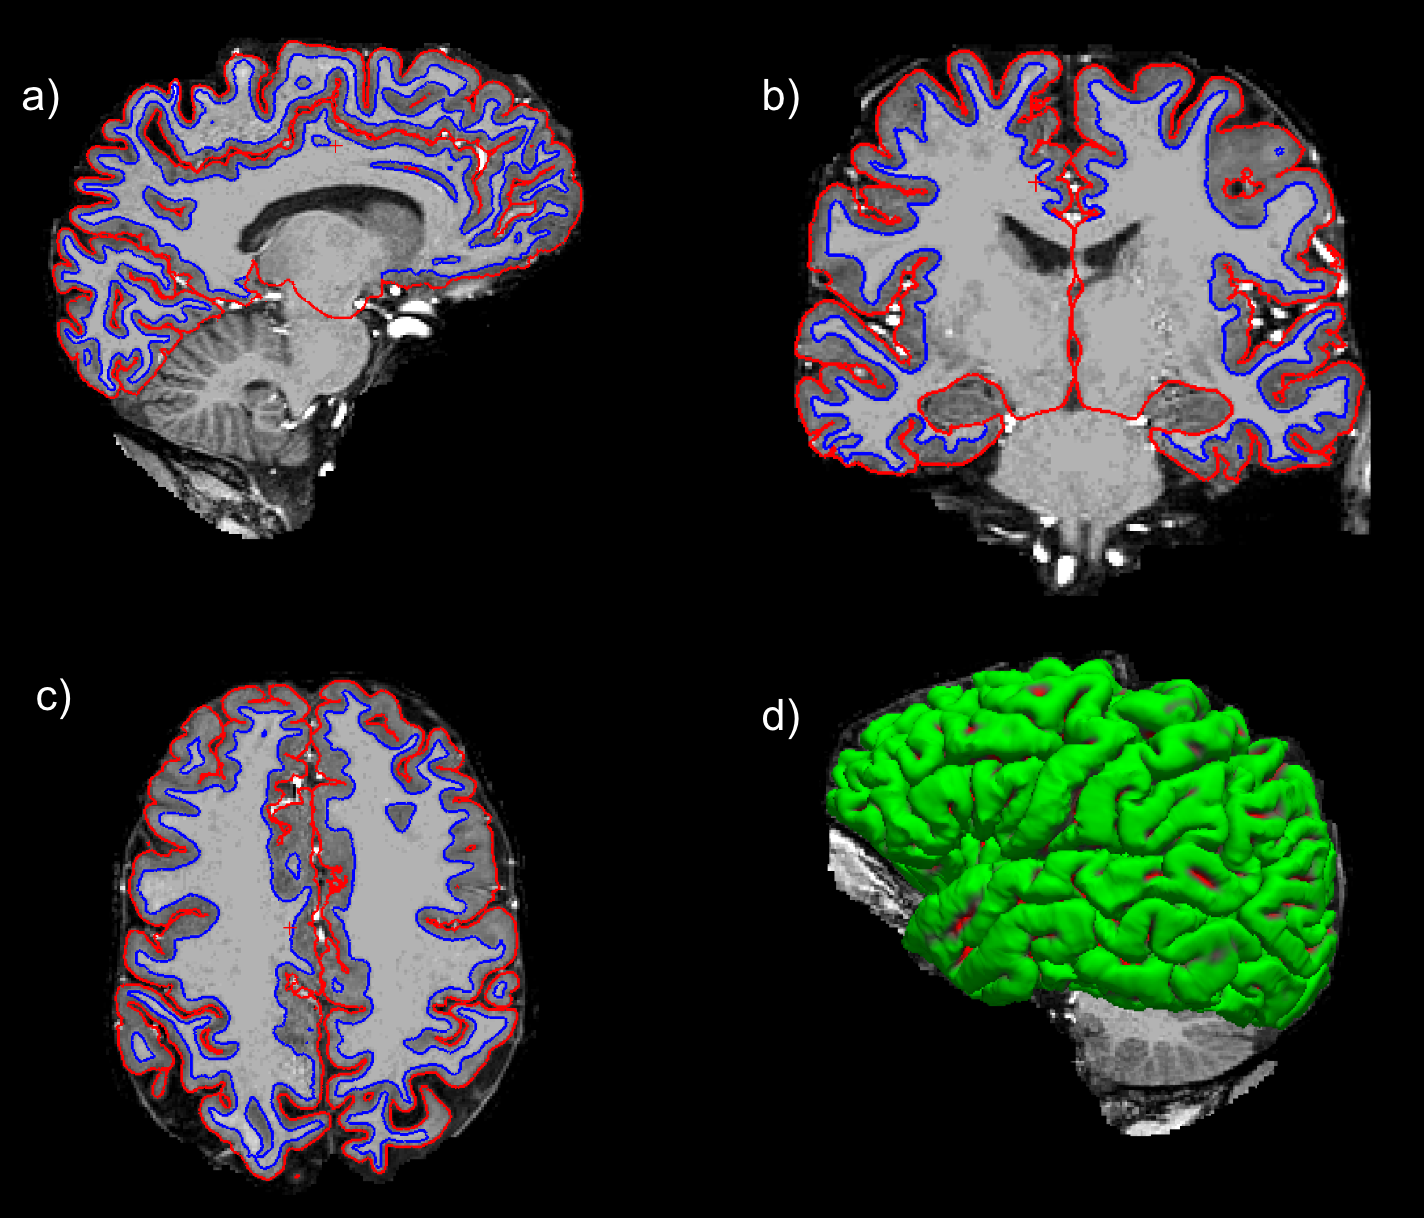
Figure 1: Reconstruction of the pial (red) and white matter (blue) surface from Freesurfer in a patient with SCD with HbSS in all views (a-d).
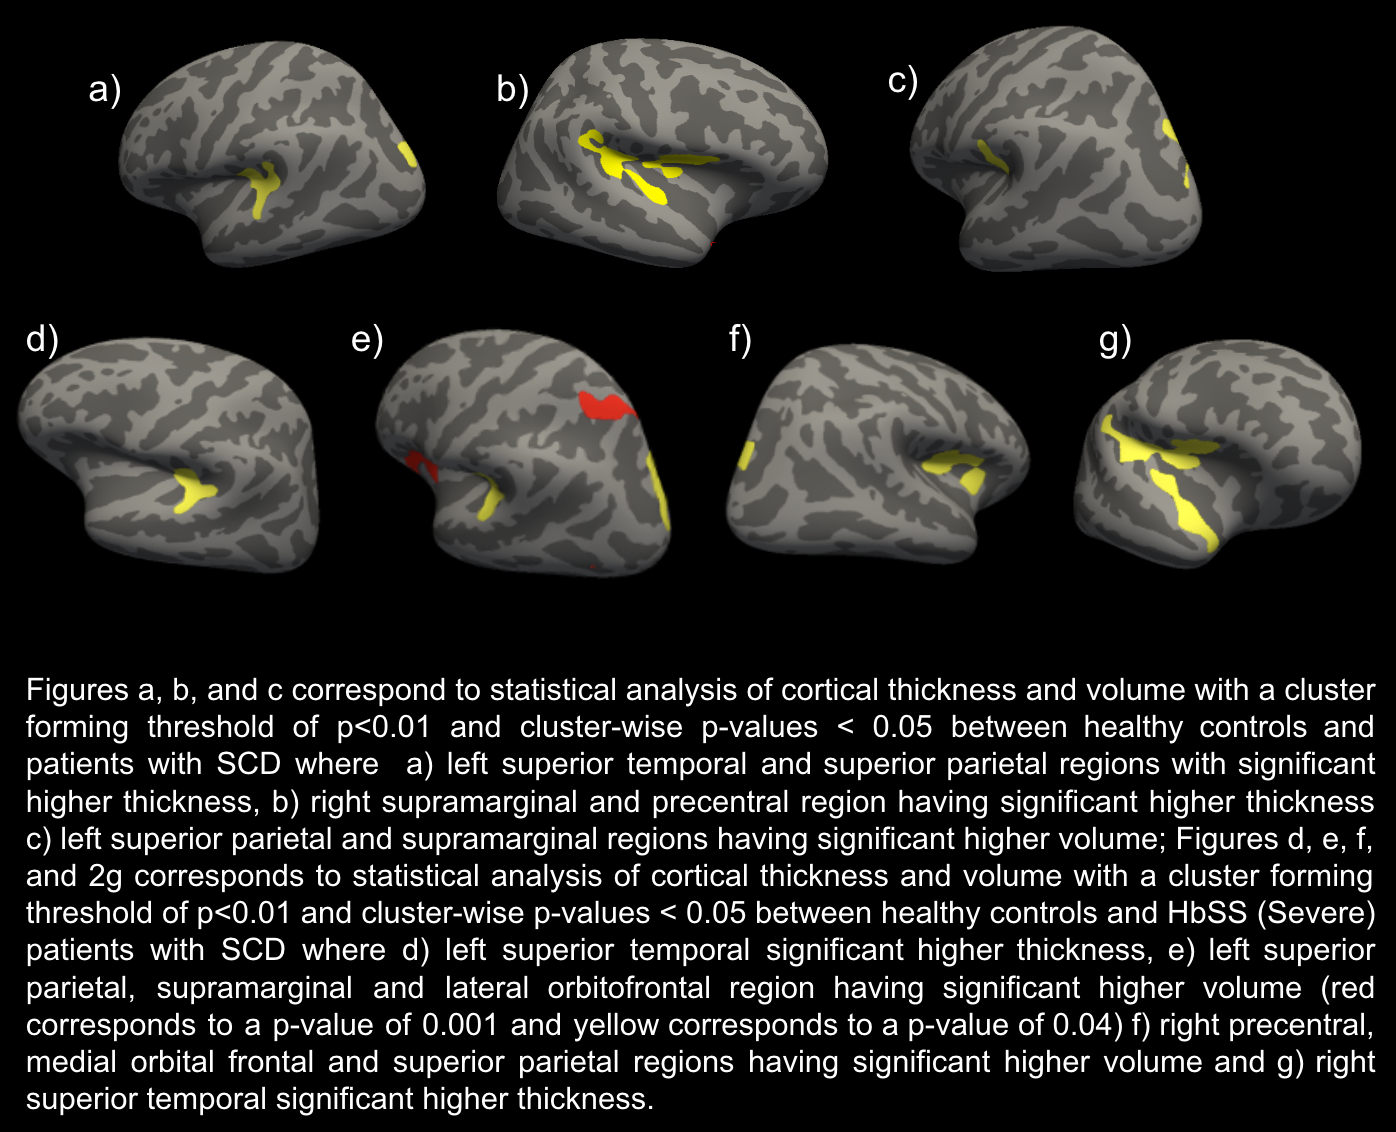
Figure 2 : Statistical analysis of Cortical thickness and volume between HC and patients with SCD (a-c) and between HC and severe patients with SCD (d-g).
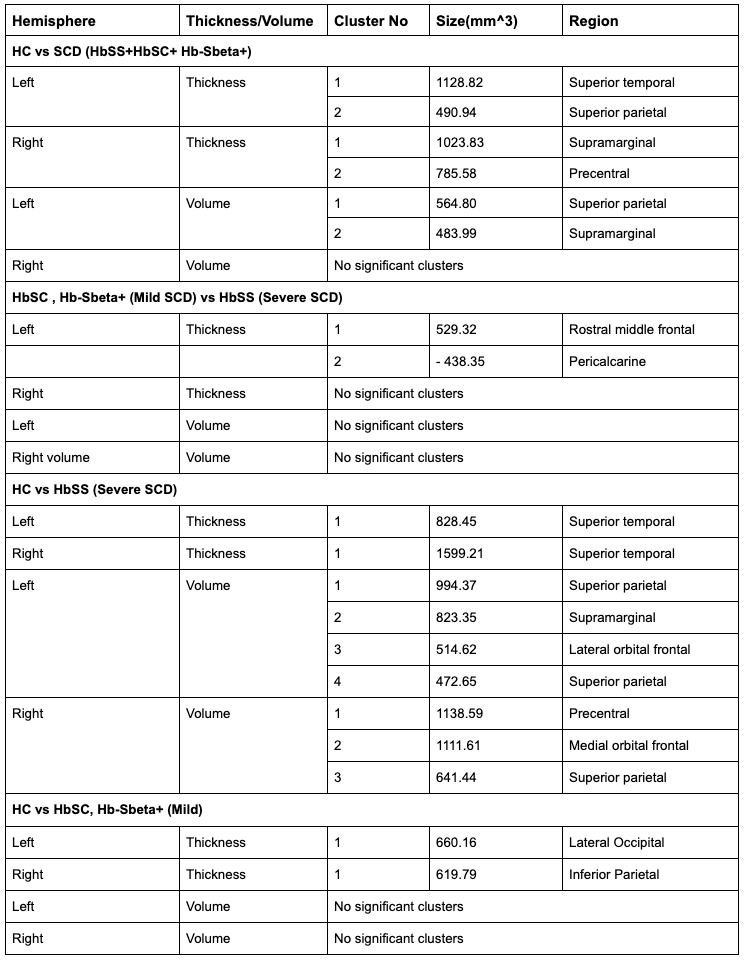
Figure 3 : Size and region of statistically significant clusters in the left and right hemispheres (Negative sign in size indicates an inverse correlation between the compared groups and cortical measure)
DOI: https://doi.org/10.58530/2023/3365