3364
Cortical laminar specific microstructure and magnetic susceptibility in ex-vivo human brain1Key Laboratory for Biomedical Engineering of Ministry of Education, Department of Biomedical Engineering, College of Biomedical Engineering & Instrument Science, Zhejiang University, Hangzhou, China, 2China Brain Bank and Department of Neurology in Second Affiliated Hospital, Key Laboratory of Medical Neurobiology of Zhejiang Province, and Department of Neurobiology, Zhejiang University School of Medicine, Hangzhou, China, 3Department of Pathology, The First Affiliated Hospital and School of Medicine, Zhejiang University, Hangzhou, China
Synopsis
Keywords: Gray Matter, Ex-Vivo Applications, cortical laminae, microstructure, magnetic susceptibility, human brain
Although recent high-resolution functional MRI studies have revealed laminar-specific cortical activity in the human brain, the underlying structural underpinning remains unclear. The present study collected submillimeter-resolution MR images from 10 ex-vivo human hemispheres. We computed the microstructural metrics and magnetic susceptibility for each sample at different cortical depths. We found that the cortical microstructure and magnetic susceptibility showed a depth-dependent pattern, which varied in different cortical regions. The cortical profiles were then correlated with cell density and myelin content obtained from histological staining. These findings may help to understand the structural basis of laminar brain function.Introduction
The human neocortex is consisted of six cytoarchitectonic cortical layers, with different cell density, cell size and cell type, which are connected to different brain areas 1, 2. Recently, laminar fMRI studies have demonstrated a close relationship between layer-specific activity and brain responses (e.g., feedforward and feedback) 3 and information flow (e.g., top-down and bottom-up signal) 4. However, the structural basis underlying the laminar-specific brain function is unclear, probably due to limited spatial resolution in in-vivo MRI measurement. This study acquired submillimeter-resolution MR images from ten ex-vivo human brains to investigate the changes of the microstructure and magnetic susceptibility with cortical depths, and estimate their association with the density and myelin content obtained from histology.Methods
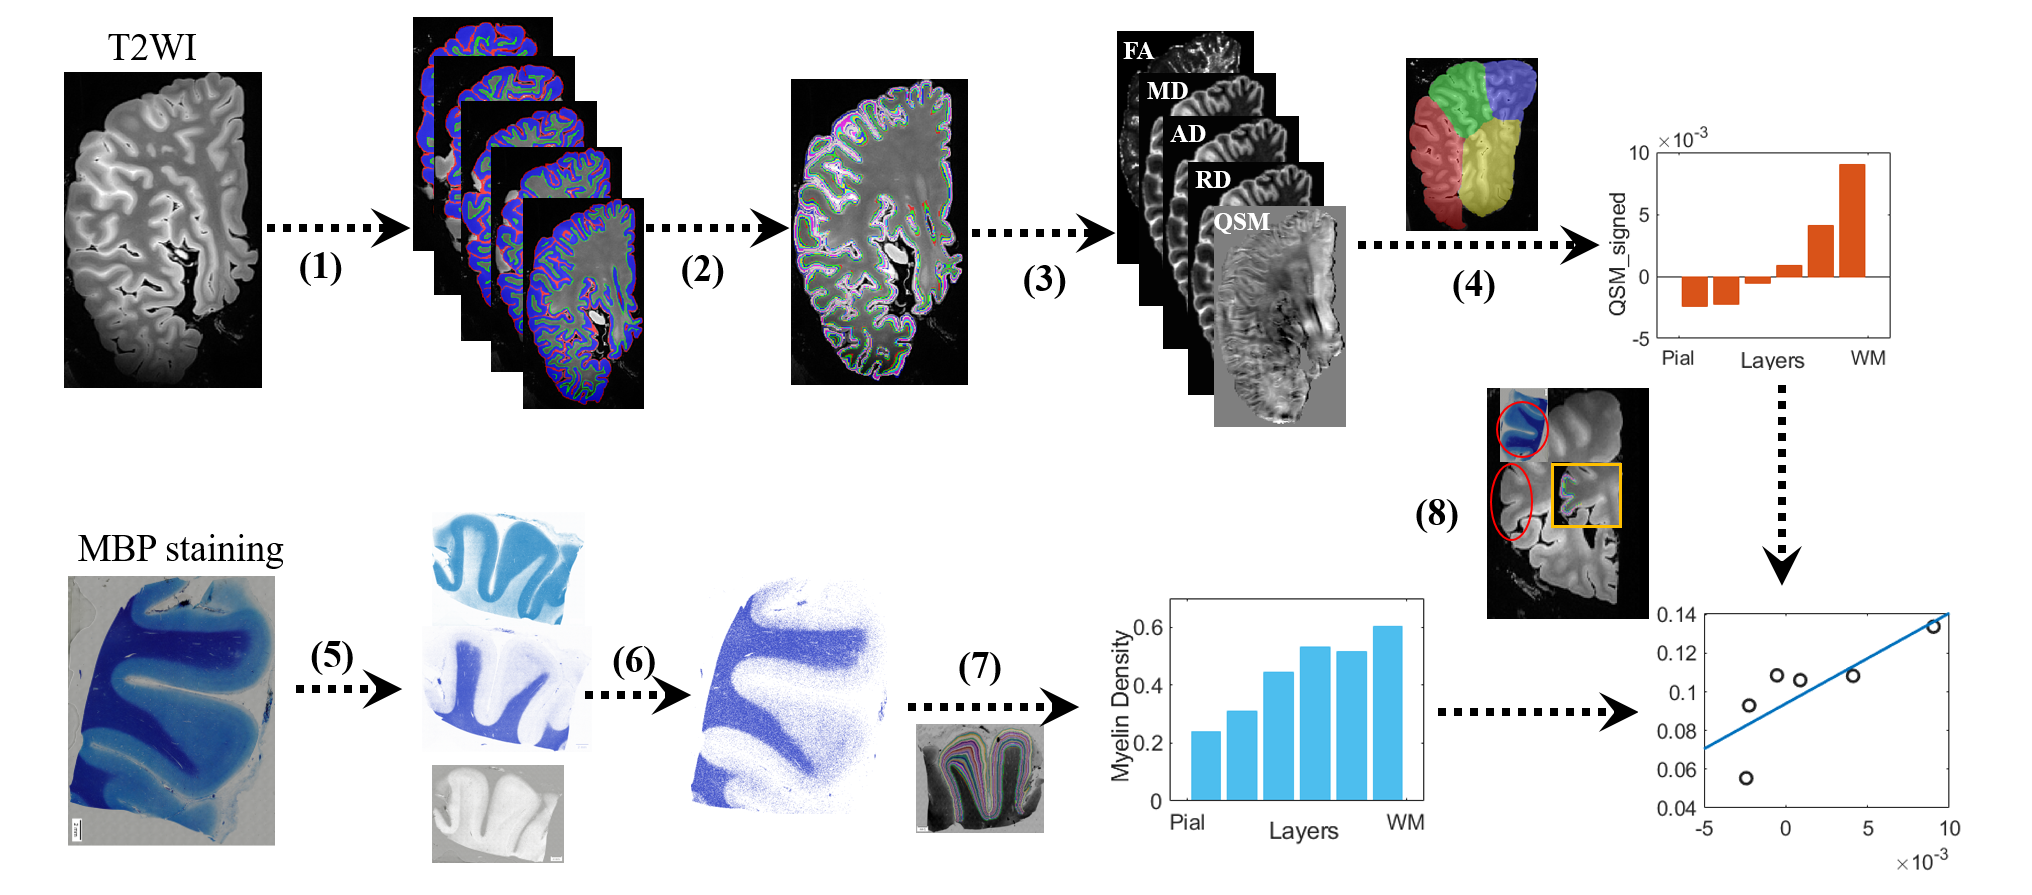
Data acquisition: 10 right hemispheres from 10 subjects (male:female = 9:1, age ranged from 48 to 89 years) were obtained according to the Standardized Operational Protocol for Human Brain Bank in China 5. All MRI scans were performed on a Siemens 7T MAGNETOM scanner with a 32 channel head coil. T2-weighted images were acquired with the following parameters: repetition time (TR) = 12510 ms; echo times (TE) = 24 ms; voxel size = 0.5 × 0.5 × 0.6 mm3; and 10 averages. Quantitative susceptibility mapping (QSM) was obtained using a 3D multi-gradient-echo (MGE) sequence with the following parameters: TR = 100 ms; TE = 4.0, 8.1, 12.2, 16.4, 20.5, 24.6, 28.8, 32.9, 37.1, 41.2, 45.2, and 49.3 ms; voxel size = 0.6 × 0.6 × 1 mm3; and 8 average. Diffusion MRI was acquired with a 3D diffusion-weighted steady state free precession (DW-SSFP) sequence with the following parameters: TR = 29 ms; TE = 21 ms; voxel size = 0.8 × 0.8 × 0.8 mm3; 20 images (b0) without diffusion weighting and 60 non-colinear diffusion directions at b-value of 6,000 s/ mm2. After the MRI scans, four small cortical tissues were dissected from frontal, parietal, temporal and occipital lobes from one subject, which were stained with H&E for cell density and MBP for myelin measurement.Data processing: As shown in Fig 1, we first segmented the grey matter cortex into six equidistance laminas in five slices from the T2-weighted image in the same spatial location for each subject using LAYNII toolbox 6. Then, we calculated FA, MD, AD and RD maps in the diffusion data after denoising and bias field correction in MRtrix3 (https://www.mrtrix.org/), and computed magnetic susceptibility maps using the FastQSM method 7 in Susceptibility Tensor Imaging Suite toolbox (http://people.duke.edu/~cl160/). Next, we registered these quantitative maps to T2-weighted space, and manual segmented the frontal, parietal, temporal, and occipital lobes to obtain layer-specific measurements in each lobe. In addition, we used color deconvolution and Otsu threshold methods to obtain cell and myelin density maps from H&E and MBP staining, respectively, which were also divided into six laminas. Finally, we manually matched MR images with the histological images, and examined their correlations across all laminas.
Results
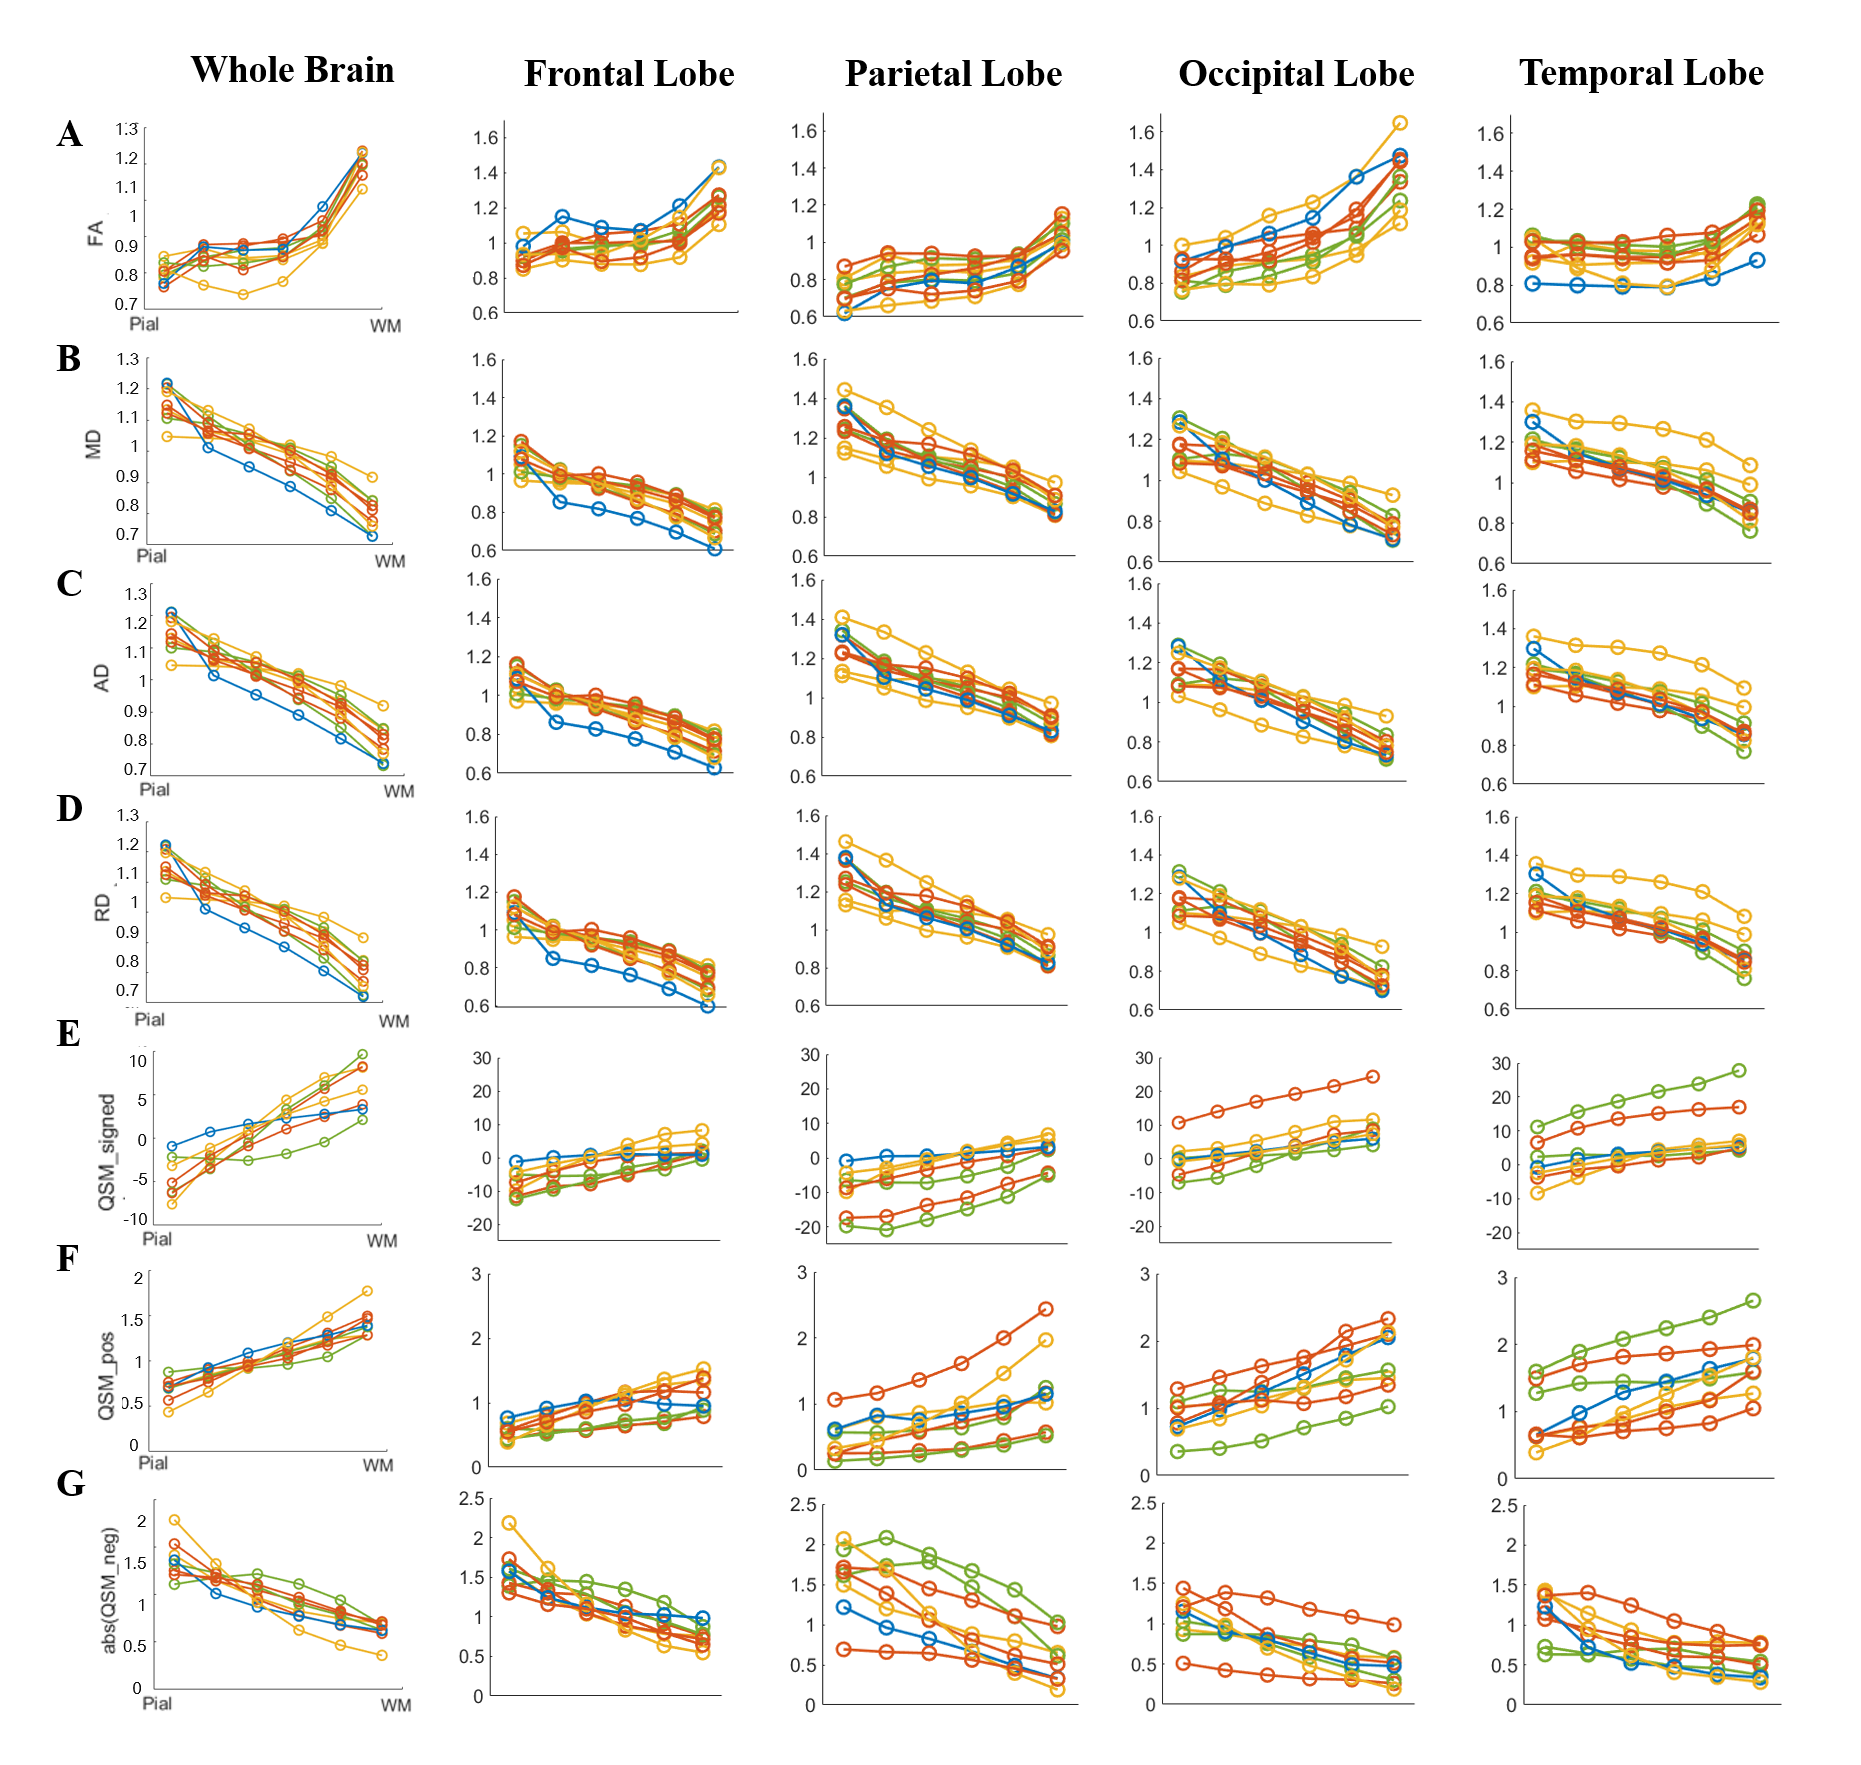
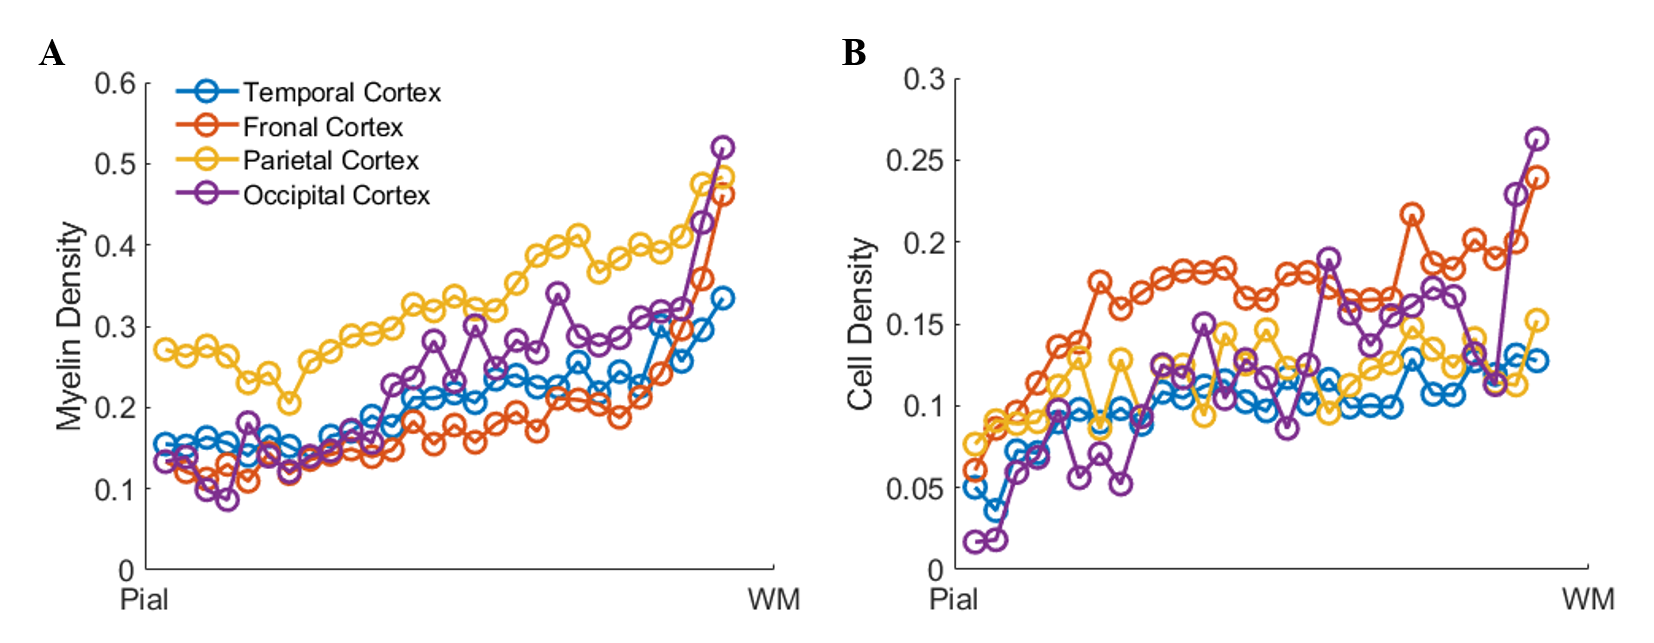
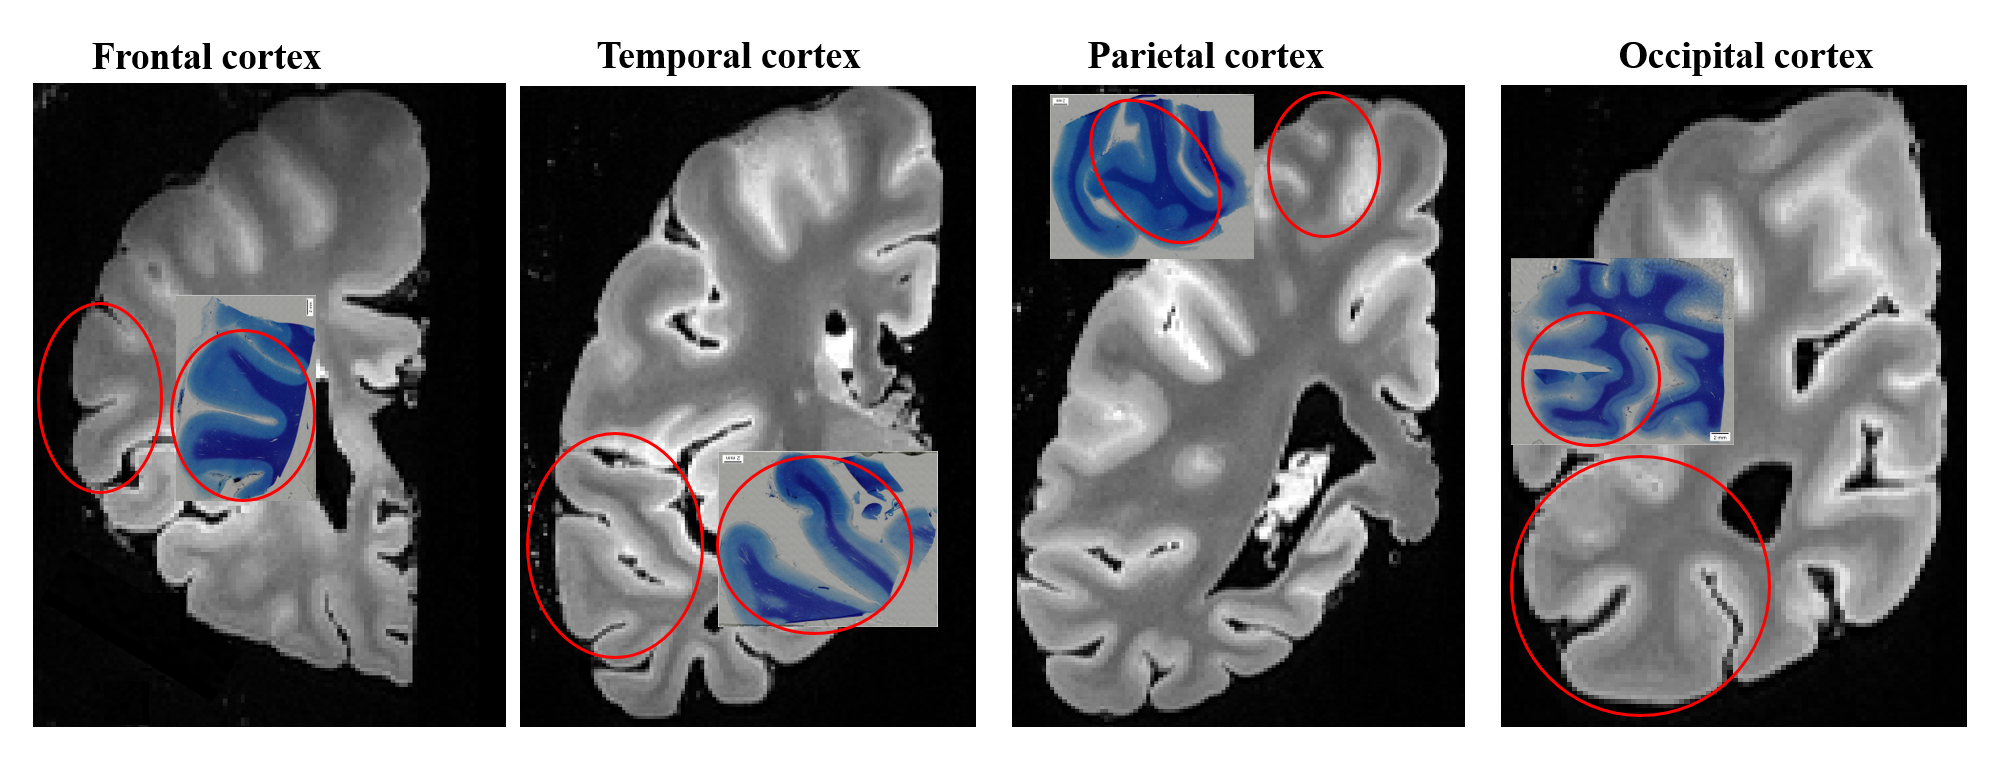
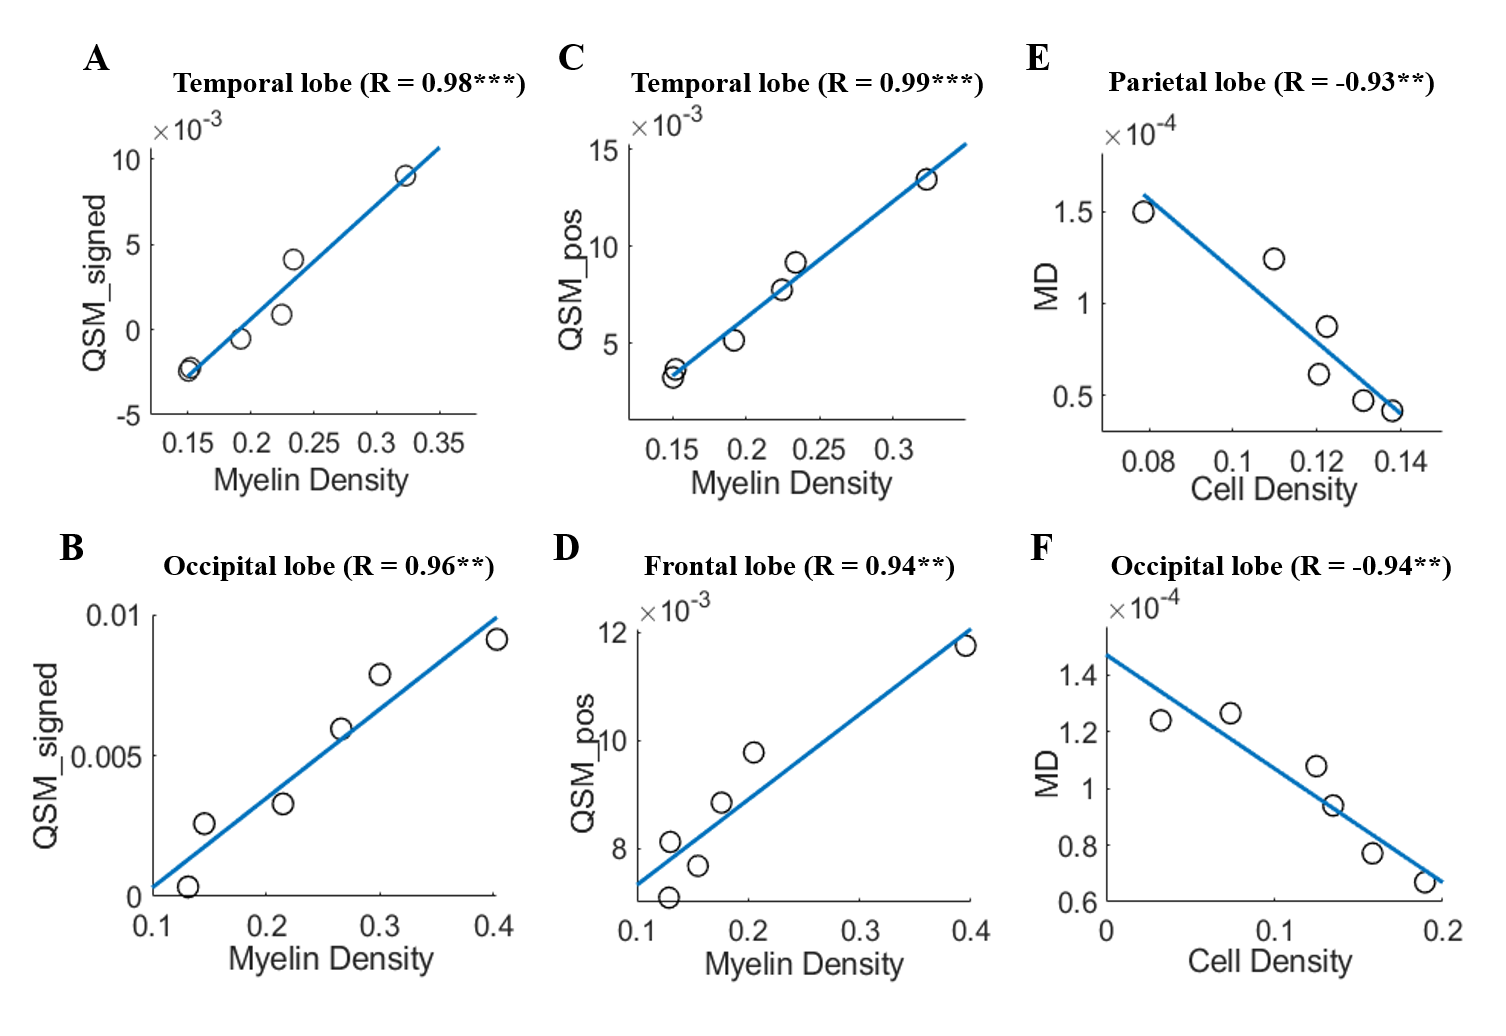
From pial surface to white matter (WM), the diffusivity decreasd almostly linearly as the cortical depth increased and the FA showed a nonlinear increase in all subjects, and the depth-dependent profile differed among the four lobes (Fig.2 A-D). The signed QSM (both positive and negative) gradually changed from negative to positive values, in which the positive QSM increased and the negative QSM decreased with cortical depths (Fig.2 E-G).The density of cell and myelin obtained from H&E and MBP displayed a depth-dependent increase from pial surface to WM in four cortical regions (Fig.3). After manually matching the MR and histological images (Fig. 4), MRI-histology correlation analysis demonstrated a positive correlation between QSM and myelin density and negative correltations between the diffusivities and cell density (Fig. 5).
Discussion and Conclusion
This study, for the first time, combined submilimeter-resolution MRI and histological staining to investigated the cortical lamina-specific microstrcture and magnetic suscetibility in ex-vivo human brains. We found that, from pial surface to WM, the diffusional anisotropy increased and the diffusivity decreased in the cortex, which were consistent with recent in-vivo findings 8, 9, suggesting the deeper layer has more complex microstructure (corresponding to the richer cell and myelin identified from histology) to restrict the water diffusion. Moreover, QSM results indicated that the positive magnetic susceptibility increased and the negative magnetic susceptibility decreased with the depth, and finally completed change from diamagnetism at pial-surface to paramagnetism at deep-surface, which was in accordance with a recent R2*-based study 10. This finding also supports that the suferficial WM, close to the deepest cortical layer, has a paramagnetic contrast which is driven by iron 11. MRI-histology correlations demonstrated that the depth-dependent changes of MRI measurement in cortical lamines were associated with the underlying cell/myelin compositions. These findings may be contributed to understanding the structural basis of laminar function.Acknowledgements
This work was supported by the Ministry of Science and Technology of the People’s Republic of China (2018YFE0114600, 2021ZD0200202), the National Natural Science Foundation of China (81971606, 82122032), and the Science and Technology Department of Zhejiang Province (202006140, 2022C03057).References
1. Tomer O, Barazany D, Baratz Z, Tsarfaty G, Assaf Y. In vivo measurements of lamination patterns in the human cortex. Hum Brain Mapp. 2022;43(9):2861-8.
2. Von Economo C, Koskinas G. The cytoarchitectonics of the adult human cortex. Vienna and Berlin: Julius Springer Verlag. 1925.
3. Lawrence SJ, Formisano E, Muckli L, de Lange FP. Laminar fMRI: Applications for cognitive neuroscience. NeuroImage. 2019;197:785-91.
4. Sharoh D, Van Mourik T, Bains LJ, Segaert K, Weber K, Hagoort P, et al. Laminar specific fMRI reveals directed interactions in distributed networks during language processing. PNAS. 2019;116(42):21185-90.
5. Qiu W, Zhang H, Bao A, Zhu K, Huang Y, Yan X, et al. Standardized Operational Protocol for Human Brain Banking in China. Neurosci Bull. 2018;35.
6. Huber LR, Poser BA, Bandettini PA, Arora K, Wagstyl K, Cho S, et al. LayNii: A software suite for layer-fMRI. NeuroImage. 2021;237:118091.
7. Wu B, Li W, Avram AV, Gho S-M, Liu C. Fast and tissue-optimized mapping of magnetic susceptibility and T2* with multi-echo and multi-shot spirals. Neuroimage. 2012;59(1):297-305.
8. Ali TS, Lv J, Calamante F. Gradual changes in microarchitectural properties of cortex and juxtacortical white matter: Observed by anatomical and diffusion MRI. Magn Reson Med. 2022.
9. Zhang J, Sun Z, Duan F, Shi L, Zhang Y, Solé‐Casals J, et al. Cerebral cortex layer segmentation using diffusion magnetic resonance imaging in vivo with applications to laminar connections and working memory analysis. Hum Brain Mapp. 2022.
10. McColgan P, Helbling S, Vaculčiaková L, Pine K, Wagstyl K, Attar FM, et al. Relating quantitative 7T MRI across cortical depths to cytoarchitectonics, gene expression and connectomics. Hum Brain Mapp. 2021;42(15):4996-5009.
11. Kirilina E, Helbling S, Morawski M, Pine K, Reimann K, Jankuhn S, et al. Superficial white matter imaging: Contrast mechanisms and whole-brain in vivo mapping. Sci Adv. 2020;6(41):eaaz9281.
Figures