3362
Estimating population motor fields (pMF) from saccadic eye movements at high field (7T)1University of Glasgow, Glasgow, United Kingdom, 2Lausanne University Hospital, Lausanne, Switzerland
Synopsis
Keywords: Gray Matter, fMRI (task based), saccade, high-field, modelling
Here we implemented a variation of the population receptive field model (pRF, Dumoulin et al., 2008; Fracasso et al., 2016), to model blood oxygenation level dependent (BOLD) signal and obtain estimates of saccade tuning direction and width from human PPC, to obtain estimates of the population motor fields (pMF).
Saccade tuning width shows a novel organizational property of human posterior parietal cortex, unveiling a gradient from posterior to anterior PPC, with tuning width steadily increasing along the posterior-anterior axis.
Introduction
The Posterior parietal cortex (PPC) exhibits topographically organized locations in response to specific saccade direction (Connolly et al., 2015; Leoné et al., 2014; Kastner et al., 2007; Schluppeck et al., 2005; Sereno et al., 2001).Mapping studies obtained estimates of preferred saccade direction at a single voxel level using the phase-encoding design (Connolly et al., 2015; Kastner et al., 2007; Schluppeck et al., 2005; Sereno et al., 2001) or alternatively, using singular value decomposition methods (Leoné et al., 2014). These methods are widely adopted and are known to yield robust results, replicated in the literature.
However, these methods focus on estimating saccade tuning direction, while not providing information on saccade tuning width. Here we implemented a variation of the population receptive field model (pRF, Dumoulin et al., 2008; Fracasso et al., 2016), using a forward model approach to account for blood oxygenation level dependent (BOLD) signal and obtain estimates of saccade tuning direction and width from human PPC: the population motor field (pMF).
We estimated the best fitting model (pMF) by using a circular-gaussian, finding the tuning direction and tuning width that best predict the measured BOLD. Crucially, the estimated parameters are connected meaningfully to the neuronal parameters (Dumoulin et al., 2008; Fracasso et al., 2016).
Methods
We measured BOLD signal while subject performed the following memory-delayed saccade task: Subjects fixate centrally while a peripheral target was briefly presented. After a 4-s delay, subjects made a saccade to the remembered target location followed by a saccade back to fixation and a 2-s inter-trial interval. Targets appeared at successive locations in the clockwise (CW) or counter-clockwise (CCW) direction in successive runs. A total of six runs (3xCW, 3xCCW) were acquired. BOLD signal was acquired using a 7T Magnetom Terra MRI scanner (Siemens, Erlangen, Germany) and 32-channel head coil (Nova Medical Inc., Wilmington, MA, USA) at the Imaging Centre of Excellence (University of Glasgow, UK). Foam padding was used to limit head movement during the data acquisition. The functional data were acquired using the CMRR multi-band 2D echo-planar interleaved imaging (EPI) sequence in an anterior to posterior phase-encoding direction with the following parameters: 162 dynamics, resolution = 1.5 mm isotropic, 48 slices, field of view (FOV) = 192 x 192 x 84 mm, repetition time (TR) = 2000 ms, echo time (TE) = 25 ms, flip angle = 72°, multiband acceleration = 2. One short 2D-EPI scan (5 volumes) was acquired between the stimuli runs with the purpose of non-linear distortion correction (top up in reverse encoding).We fit the data using the classic phase encoded design and a circular-gaussian pMF model. For the classic phase encoded approach, BOLD data were analysed in the Fourier domain, and we computed the coherence and phase per voxel (Dumoulin et al., 2017).
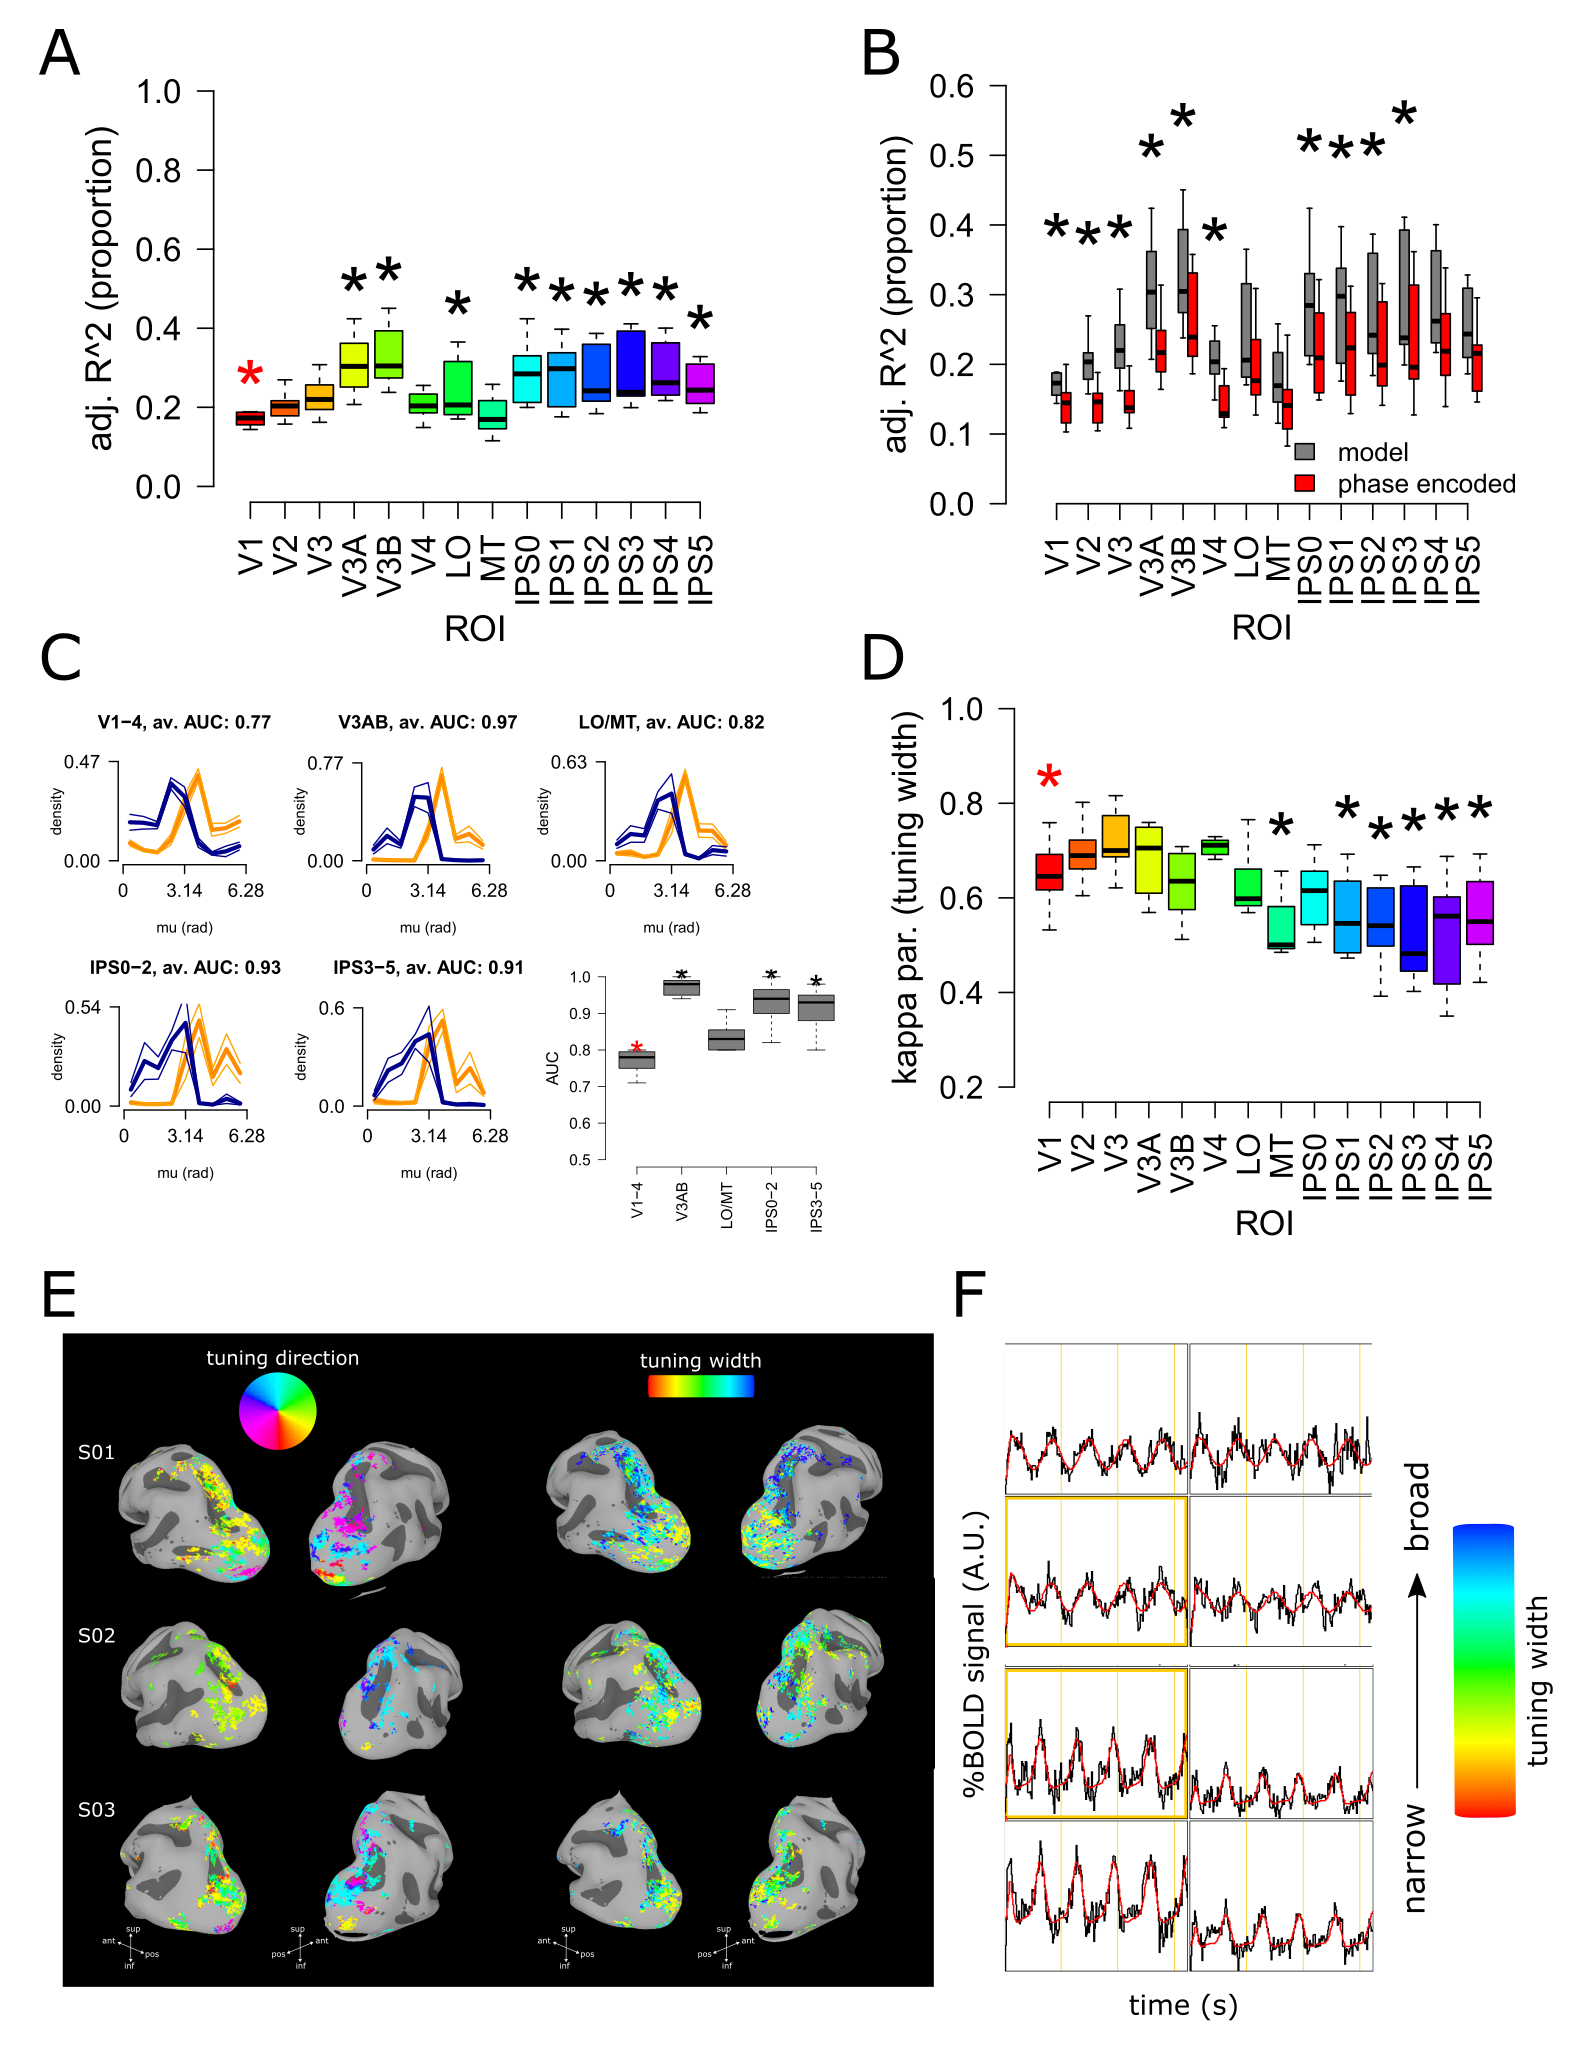
The coherence of each fMRI series at the fundamental stimulus frequency is a measure of the strength of the BOLD response. We converted coherence in adjusted r-squared to compare the phase-encoded approach with pMF model (Figure 1A,B). The phase of the data represents the preferred saccade tuning direction.
We fit pMFs using an iterative procedure, aiming at maximizing the adjusted r-squared in a single voxel, optimizing preferred saccade tuning direction, saccade tuning width and the shape of the haemodynamic response function.
Results and Dicussion
PPC exhibited the known topographic organization for delayed saccades, with a preference for contralateral eye movements (Figure 1C,E). Similar tuning direction were obtained using the classical approach (phase encoded design) and pMF, although the pMF approach yielded better goodness of fit compared to the phase encoding design (Figure 1B). This result is compatible with previous reports (Connolly et al., 2015; Leoné et al., 2014; Kastner et al., 2007; Schluppeck et al., 2005; Sereno et al., 2001), however it is important to note that there exist rigorous studies that fail to show any lateralization in PPC (Brown et al. 2004; Konen et al. 2004). These contrasting results might indicate the presence of weakly tuned responses for saccade direction in PPC (Schluppeck et al., 2005). Saccade tuning width results on the other hand, shows a novel organizational property of human PPC, unveiling a gradient from posterior to anterior PPC, with tuning width steadily increasing along the posterior-anterior axis (Figure 1D-F).This result is compatible with the existence of weakly-tuned responses in human PPC. Crucially, this novel organizational principle cannot be explained by differences in the HRF between different cortical locations. This gradient of saccade tuning width on human PPC could be observed only implementing a forward model as pMF, where the estimated parameters are connected meaningfully to the underlying neuronal population parameters.
Acknowledgements
AF is supported by a grant from the Biotechnology and Biology Research Council (BBSRC, grant number BBS00/6605/1) and the Bial Foundation (grant id: A-29315, n. 203/2020, grant edition: G1-5516).References
Brown, M.R.G., DeSouza, J.F.X., Goltz, H.C., Ford, K., Menon, R.S., Goodale, M.A. and Everling, S., 2004. Comparison of memory-and visually guided saccades using event-related fMRI. Journal of neurophysiology, 91(2), pp.873-889.
Connolly, J.D., Vuong, Q.C. and Thiele, A., 2015. Gaze-dependent topography in human posterior parietal cortex. Cerebral Cortex, 25(6), pp.1519-1526.
Dumoulin, S.O. and Wandell, B.A., 2008. Population receptive field estimates in human visual cortex. Neuroimage, 39(2), pp.647-660.
Dumoulin, S.O., Harvey, B.M., Fracasso, A., Zuiderbaan, W., Luijten, P.R., Wandell, B.A. and Petridou, N., 2017. In vivo evidence of functional and anatomical stripe-based subdivisions in human V2 and V3. Scientific reports, 7(1), pp.1-12.
Fracasso, A., Petridou, N. and Dumoulin, S.O., 2016. Systematic variation of population receptive field properties across cortical depth in human visual cortex. Neuroimage, 139, pp.427-438.
Kastner, S., DeSimone, K., Konen, C.S., Szczepanski, S.M., Weiner, K.S. and Schneider, K.A., 2007. Topographic maps in human frontal cortex revealed in memory-guided saccade and spatial working-memory tasks. Journal of neurophysiology, 97(5), pp.3494-3507.
Konen, C.S., Kleiser, R., Wittsack, H.J., Bremmer, F. and Seitz, R.J., 2004. The encoding of saccadic eye movements within human posterior parietal cortex. Neuroimage, 22(1), pp.304-314.
Leoné, F.T., Toni, I. and Medendorp, W.P., 2014. Two-dimensional spatial tuning for saccades in human parieto-frontal cortex. NeuroImage, 87, pp.476-489.
Schluppeck, D., Glimcher, P. and Heeger, D.J., 2005. Topographic organization for delayed saccades in human posterior parietal cortex. Journal of neurophysiology, 94(2), pp.1372-1384.
Sereno, M.I., Pitzalis, S. and Martinez, A., 2001. Mapping of contralateral space in retinotopic coordinates by a parietal cortical area in humans. Science, 294(5545), pp.1350-1354.
Figures