3361
QSM and edited MRS reveal altered deep-brain gray matter microstructure and neurometabolism in patients with hepatic encephalopathy
Helge J. Zöllner1,2,3,4, Thomas A. Thiel3,4, Markus S. Jördens5, Dieter Häussinger5, Georg Oeltzschner1,2, Markus Butz3, Hans-Jörg Wittsack4, Alfons Schnitzler3, and Eric Bechler4
1The Russell H. Morgan Department of Radiology and Radiological Science, The Johns Hopkins University School of Medicine, Baltimore, MD, United States, 2Kennedy Krieger Institute, F. M. Kirby Research Center for Functional Brain Imaging, Baltimore, MD, United States, 3Institute of Clinical Neuroscience and Medical Psychology, Medical Faculty, Heinrich-Heine-University Düsseldorf, Düsseldorf, Germany, 4Department of Diagnostic and Interventional Radiology, Medical Faculty, Heinrich-Heine-University Düsseldorf, Düsseldorf, Germany, 5Department of Gastroenterology, Hepatology and Infectiology, Medical Faculty, Heinrich-Heine-University Düsseldorf, Düsseldorf, Germany
1The Russell H. Morgan Department of Radiology and Radiological Science, The Johns Hopkins University School of Medicine, Baltimore, MD, United States, 2Kennedy Krieger Institute, F. M. Kirby Research Center for Functional Brain Imaging, Baltimore, MD, United States, 3Institute of Clinical Neuroscience and Medical Psychology, Medical Faculty, Heinrich-Heine-University Düsseldorf, Düsseldorf, Germany, 4Department of Diagnostic and Interventional Radiology, Medical Faculty, Heinrich-Heine-University Düsseldorf, Düsseldorf, Germany, 5Department of Gastroenterology, Hepatology and Infectiology, Medical Faculty, Heinrich-Heine-University Düsseldorf, Düsseldorf, Germany
Synopsis
Keywords: Gray Matter, Quantitative Susceptibility mapping, Hepatic encephalopathy
Hepatic encephalopathy (HE) is a common neurological manifestation of liver cirrhosis characterized by altered brain microstructure and metabolism. Here, Quantitative Susceptibility Mapping (QSM) was performed in a well-characterized cohort of HE patients and correlated with metabolite estimates derived from GABA-edited MR spectroscopy. Deep-brain gray matter micro-susceptibility was significantly altered in the bilateral pallidum and dentate nuclei in HE patients. These results were closely linked to metabolite estimates and clinical metrics.Introduction
Hepatic encephalopathy (HE) is a systemic neurological manifestation of liver cirrhosis1. Neuroimaging MR findings of HE patients include altered T1 and T2 relaxation in the basal ganglia and globus pallidus observed in T1-, T2*-, and susceptibility-weighted images2–5. These changes are most likely linked to increased tissue concentrations of manganese and iron due to liver failure2. However, the beforementioned imaging techniques are not quantitative, reducing clinical utility and between-subject comparability. They are also only an indirect measure of metal deposition and may be confounded by other changes in tissue relaxation properties. Quantitative susceptibility mapping (QSM) in contrast generates quantitative images reflecting molecular composition and microstructure. Here we use QSM to quantify micro-susceptibility alterations in patients with HE.Methods
33 participants were enrolled in the study, including 16 age-matched controls, 2 minimal HE (mHE) patients, and 15 patients with clinically manifest HE. Exclusion criteria included psychiatric and neurological disease other than HE, severe intestinal disease, CNS-active medication, and MR contra-indications. Additionally, patients with history of alcohol abuse had to abstain alcohol for >= 4 weeks. Written informed consent was given by all participants and the study cohort is summarized in Figure 1. All participants underwent testing for visual perception and motoric performance using a portable critical flicker frequency (CFF)6 device and a shuffled pegboard7.3D multi-echo gradient echo images were acquired with full brain coverage (number of echoes = 5, TE1/ΔTE/TR = 7.38/7.38/43 ms, flip angle = 20°, voxel size = 1 x 1 x 2 mm3, bandwidth = 190 Hz/pixel, parallel imaging acceleration factor = 2, acquisition time = 5:56 min) and exported from the scanner. QSM maps were generated using the STI-Suite8. Analysis steps included Laplacian phase unwrapping8, the ill-posed inverse problem was solved with V-SHARP9 background field removal and streaking artifact reduction with STAR-QSM10. The susceptibility maps were referenced to the mean susceptibility of the whole brain. Laplacian unwrapping and STAR-QSM were run on default parameters, V-SHARP used a radius of 12 mm. For the preliminary analysis, 9 bi-lateral regions of interest (motor cortex, frontal white matter, caudate, pallidum, putamen, thalamus, substantia nigra, red nucleus, dentate nucleus) were manually defined for each participant to calculate the mean susceptibility for each region.
Quantitative metabolite estimates relative to total creatine from the same participants were taken from an earlier study11 for additional analysis of possible links between neurochemical and micro-susceptibility alterations. Briefly, GABA-edited MRS was acquired in the left motor cortex, left basal ganglia, and right cerebellum. The GABA-edited difference spectra were analyzed using Gannet12 and edit-OFF spectra were processed in Osprey13 and modeled using LCModel14.
Visualizations, group, and correlational analysis were performed in the R-based toolbox SpecVis15. All statistics were corrected for multiple comparisons and participant age was included as a covariate.
Results
Figure 2 shows example quantitative susceptibility maps of a healthy control and a patient with hepatic encephalopathy. Increased susceptibility is visible in the bilateral pallidum and dentate nuclei of the HE patient suggesting increased metal deposition in these regions. Mean susceptibility estimates are significantly increased in the pallidum and dentate nuclei of HE patients, again suggesting altered metal deposition in the deep brain gray matter (Figure 3).Susceptibility estimates in the dentate nuclei correlated well (r = -0.33; p < .05) with the critical clicker frequency and were closely linked to alterations in the neurometabolites glutamine (r = 0.41; p < .05), myo-inositol (r = -0.45; p < .01), and total choline (r = -0.35; p < .05) measured in the cerebellum (Figure 4A). Susceptibility estimates in the pallidum correlated well with CFF (r = -0.32; p < .05). For the putamen (r = 0.36; p < .05) and thalamus (r = 0.42; p < .05), a close correlation between susceptibility and GABA+ levels in the basal ganglia (Figure 4B) was found.
Discussion
Deep gray matter susceptibility is altered in several regions in HE patients which is in line with earlier studies using T2* and SWI imaging to assess iron deposits in HE patients3–5. Another interpretation is the increased storage of the neurotoxic manganese, for example, found in tissue samples of the globus pallidus and caudate nuclei in HE patients16,17. Altered susceptibility in the dentate nuclei may reflect cerebellar involvement in the pathophysiology of HE found in animal studies18. The HE-related changes were observable in QSM even if they didn’t manifest in T1-weighted images, emphasizing the high sensitivity of QSM to microstructural changes. Strong correlations with neurometabolite concentrations may reflect a metabolic response to increased neurotoxicity through manganese deposition. However, metabolite levels might also be affected by the relaxation time changes and their impact on MRS quantification.Conclusion
Altered susceptibility in the pallidum and dentate nuclei of HE patients reveals increased metal deposition and is closely linked to disturbed neurometabolism.Acknowledgements
This study was supported by the Sonderforschungsbereich (SFB) 974 (TP B07) of the German Research foundation. Further support is received from NIH grants R00 AG062230 (GO).References
- Häussinger D, Dhiman RK, Felipo V, et al. Hepatic encephalopathy. Nat Rev Dis Primer. 2022;8(1):1-22. doi:10.1038/s41572-022-00366-6
- Rovira A, Alonso J, Córdoba J. MR Imaging Findings in Hepatic Encephalopathy. Am J Neuroradiol. 2008;29(9):1612-1621. doi:10.3174/ajnr.A1139
- Liu JY, Ding J, Lin D, et al. T2* MRI of minimal hepatic encephalopathy and cognitive correlates in vivo. J Magn Reson Imaging. 2013;37(1):179-186. doi:10.1002/jmri.23811
- Benson JC, Payabvash S, Thalken GL, et al. Delineation of microhemorrhage in acute hepatic encephalopathy using susceptibility-weighted imaging. Eur J Radiol. 2016;85(3):629-634. doi:10.1016/j.ejrad.2015.12.025
- Xia S, Zheng G, Shen W, et al. Quantitative measurements of brain iron deposition in cirrhotic patients using susceptibility mapping. Acta Radiol. 2015;56(3):339-346. doi:10.1177/0284185114525374
- Kircheis G, Hilger N, Häussinger D. Value of Critical Flicker Frequency and psychometric hepatic encephalopathy score in diagnosis of low-grade hepatic encephalopathy. Gastroenterology. 2014;146(4):961-969.e11. doi:10.1053/j.gastro.2013.12.026
- Klove H. Clinical neuropsychology (1963) the medical clinics of north america. FM Forster Ed. 1963;47(6):1647-1658.
- Li W, Avram AV, Wu B, Xiao X, Liu C. Integrated Laplacian-based phase unwrapping and background phase removal for quantitative susceptibility mapping. NMR Biomed. 2014;27(2):219-227. doi:10.1002/nbm.3056
- Wu B, Li W, Guidon A, Liu C. Whole brain susceptibility mapping using compressed sensing. Magn Reson Med. 2012;67(1):137-147. doi:10.1002/mrm.23000
- Wei H, Dibb R, Zhou Y, et al. Streaking artifact reduction for quantitative susceptibility mapping of sources with large dynamic range. NMR Biomed. 2015;28(10):1294-1303. doi:10.1002/nbm.3383
- Zöllner HJ, Thiel TA, Füllenbach ND, et al. J-difference GABA-edited MRS reveals altered cerebello-thalamo-cortical metabolism in patients with hepatic encephalopathy. medRxiv. Published online January 1, 2022:2022.09.28.22280460. doi:10.1101/2022.09.28.22280460
- Edden RAE, Puts NAJ, Harris AD, Barker PB, Evans CJ. Gannet: A batch-processing tool for the quantitative analysis of gamma-aminobutyric acid–edited MR spectroscopy spectra. J Magn Reson Imaging JMRI. 2014;40(6):1445-1452.
- Oeltzschner G, Zöllner HJ, Hui SCN, et al. Osprey: Open-source processing, reconstruction & estimation of magnetic resonance spectroscopy data. J Neurosci Methods. 2020;343:108827. doi:10.1016/j.jneumeth.2020.108827
- Provencher SW. Automatic quantitation of localized in vivo1H spectra with LCModel. NMR Biomed. 2001;14(4):260-264. doi:10.1002/nbm.698
- Zöllner HJ, Považan M, Hui SCN, Tapper S, Edden RAE, Oeltzschner G. Comparison of different linear-combination modeling algorithms for short-TE proton spectra. NMR Biomed. 2021;34(4):e4482. doi:https://doi.org/10.1002/nbm.4482
- Krieger D, Krieger S, Theilmann L, Jansen O, Gass P, Lichtnecker H. Manganese and chronic hepatic encephalopathy. The Lancet. 1995;346(8970):270-274. doi:10.5555/uri:pii:S0140673695921648
- Rose C, Butterworth RF, Zayed J, et al. Manganese deposition in basal ganglia structures results from both portal-systemic shunting and liver dysfunction. Gastroenterology. 1999;117(3):640-644. doi:10.1016/S0016-5085(99)70457-9
- Cauli O, Mansouri MT, Agusti A, Felipo V. Hyperammonemia Increases GABAergic Tone in the Cerebellum but Decreases It in the Rat Cortex. Gastroenterology. 2009;136(4):1359-1367.e2. doi:10.1053/j.gastro.2008.12.057
Figures
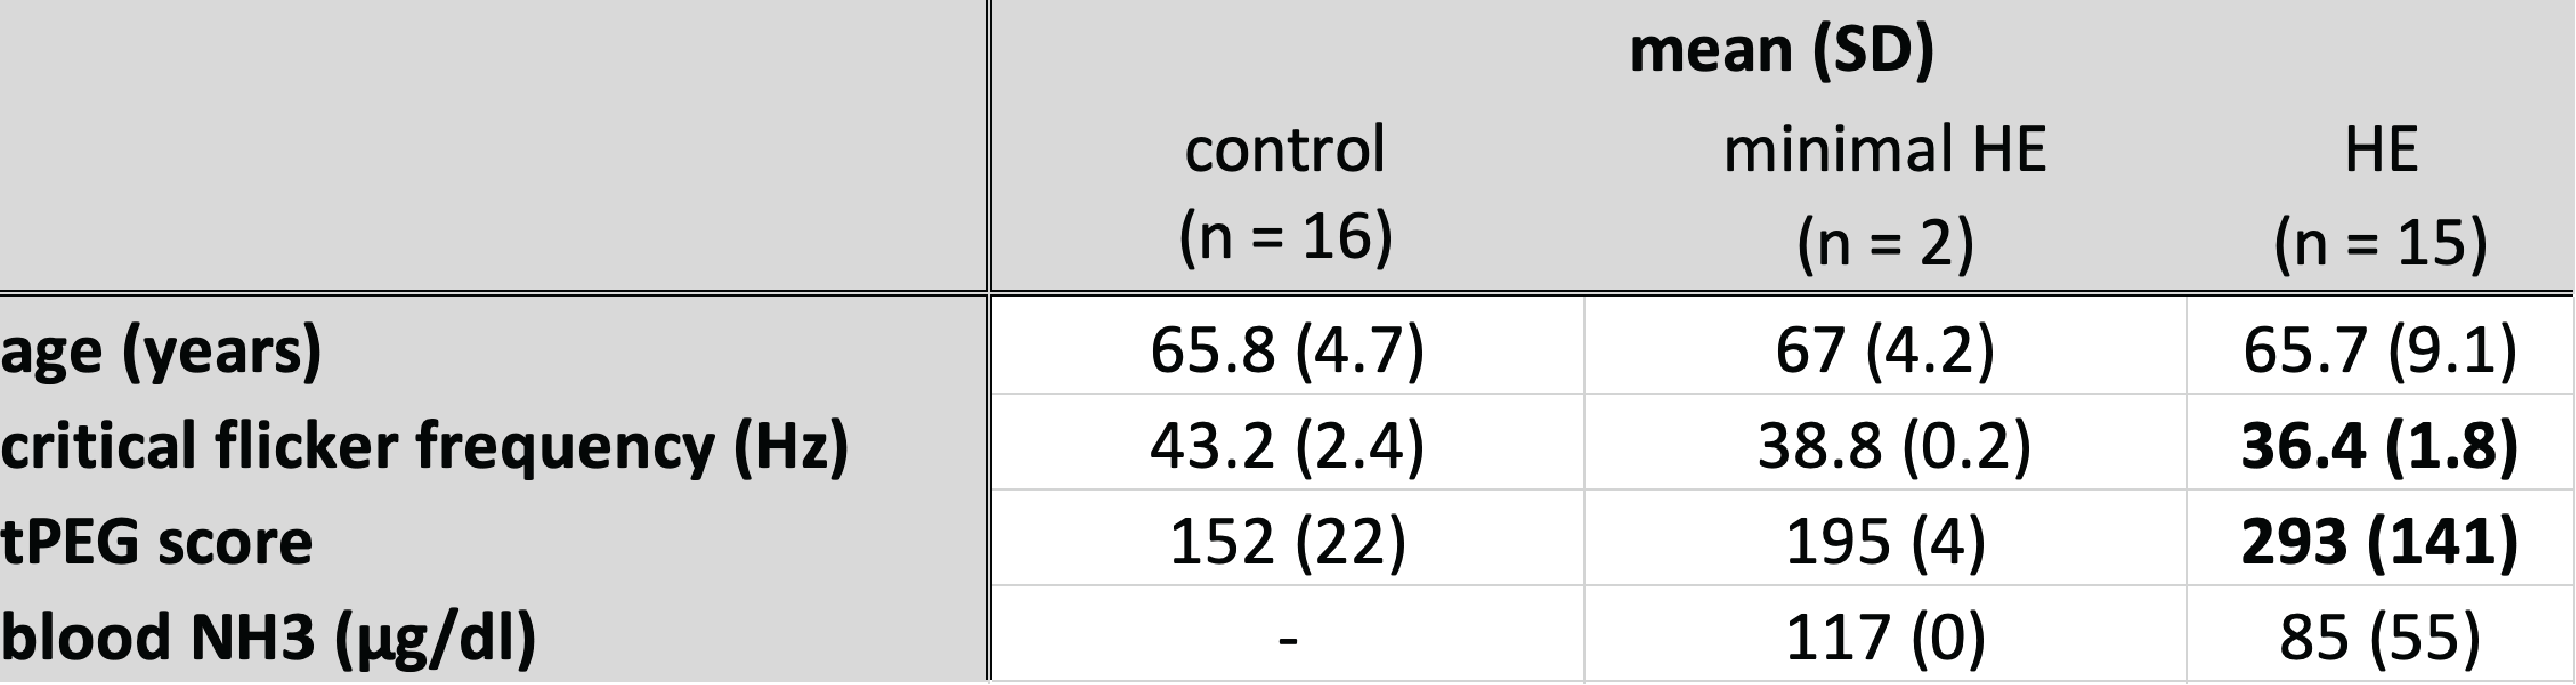
Study cohort and clinical metrics. Bold text indicates significant differences (p < .001) compared to the control group.
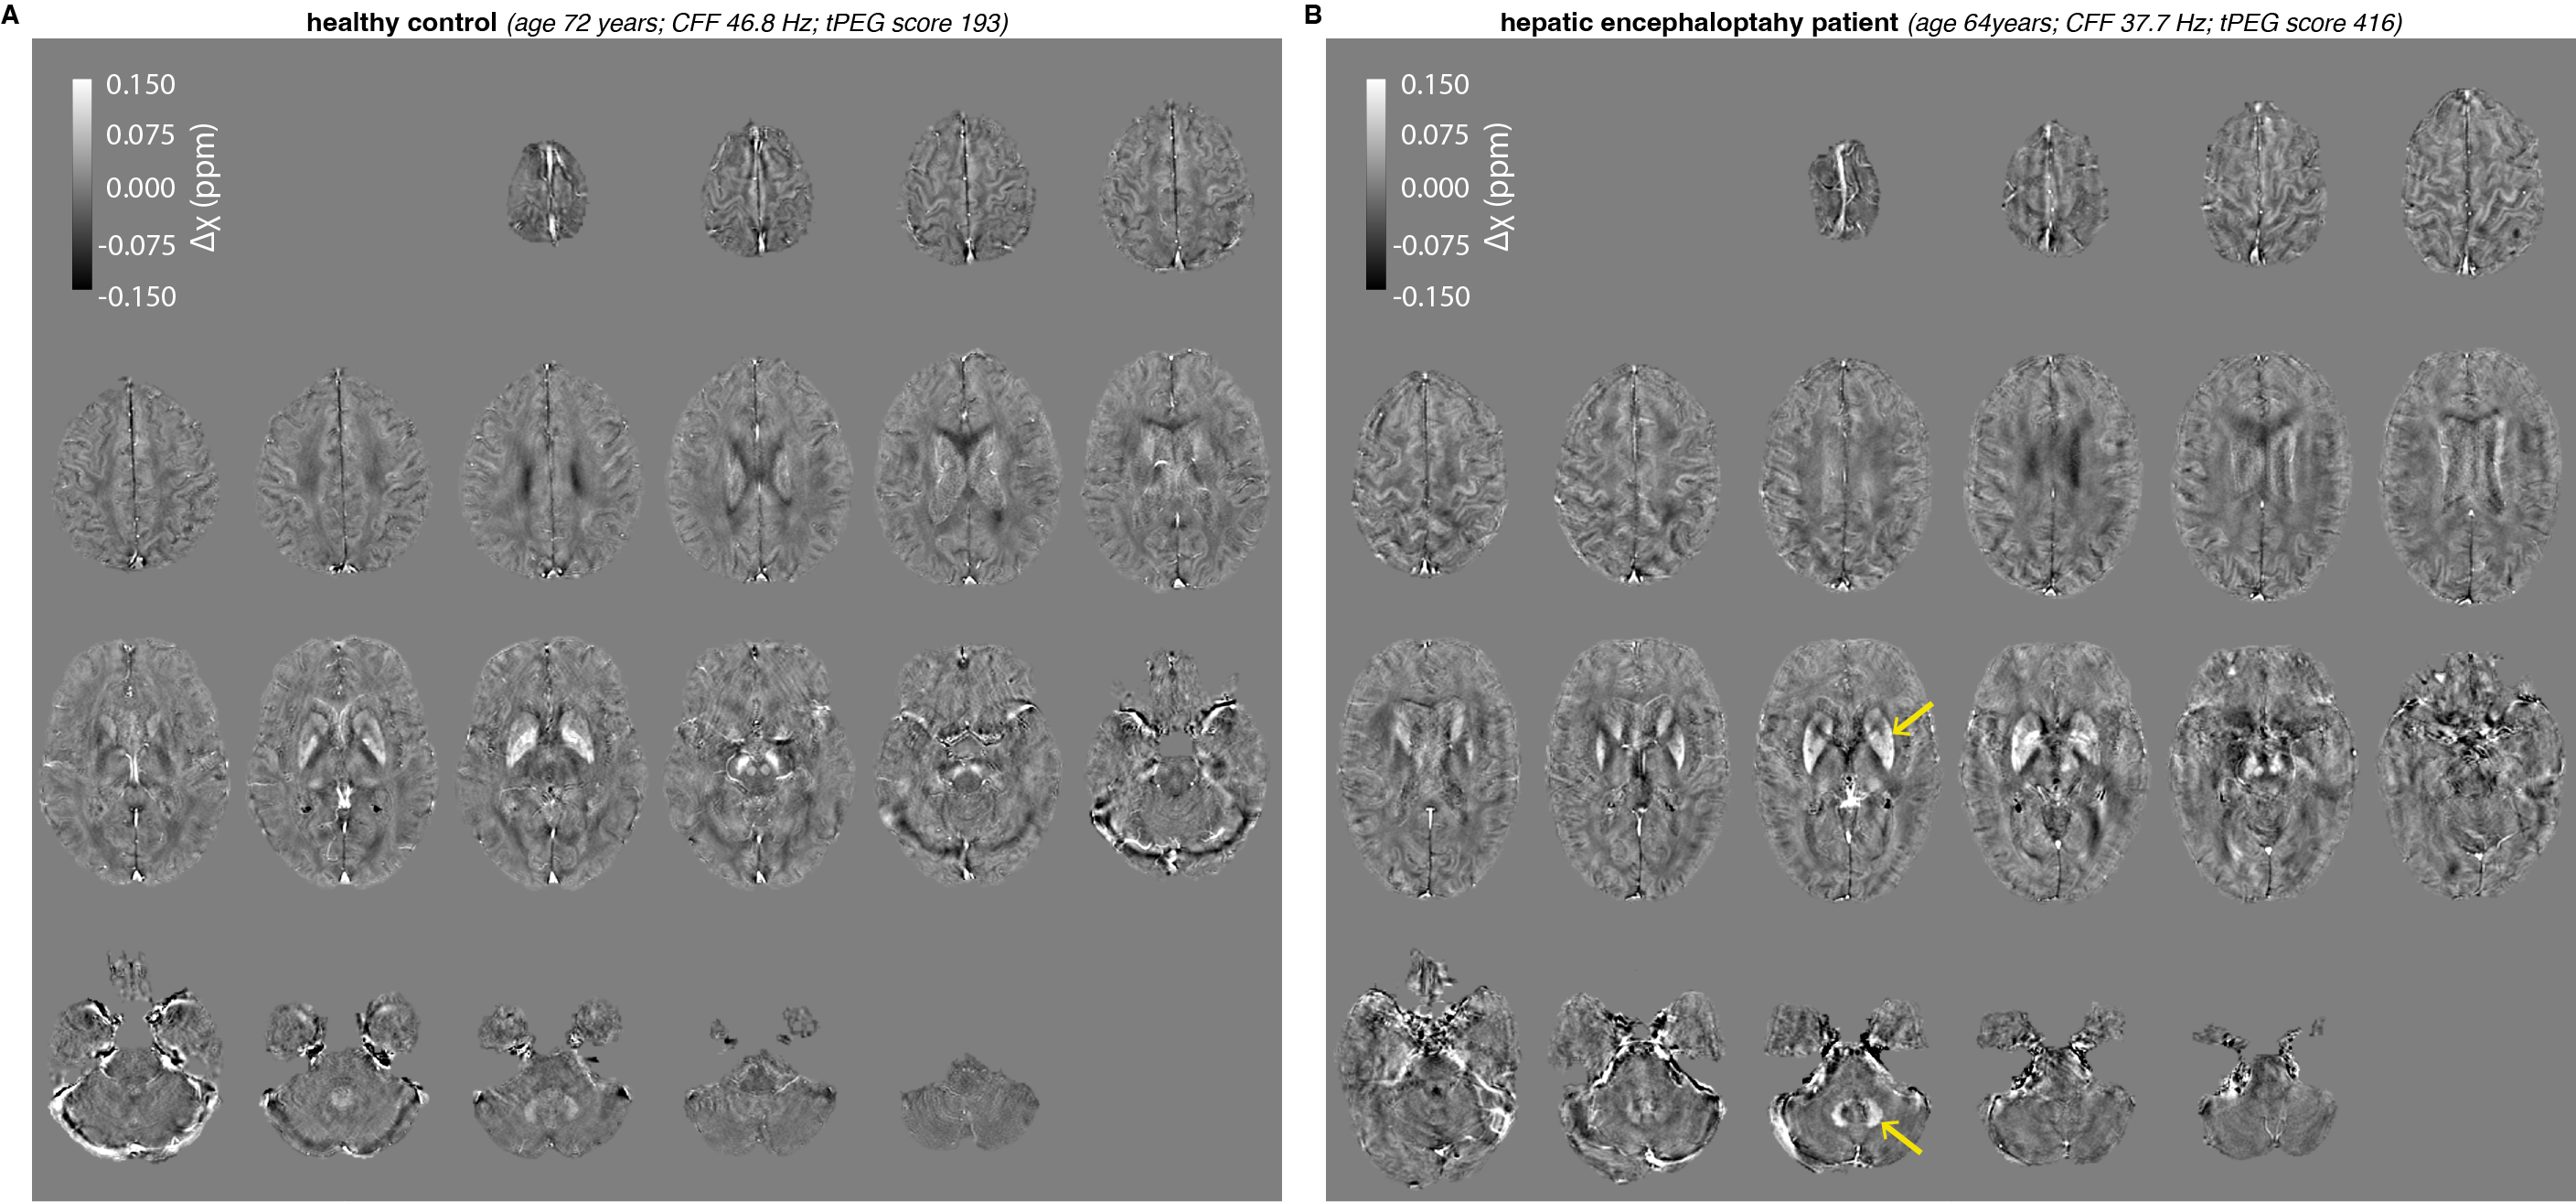
Example quantitative susceptibility maps of a healthy control (age 72 years; CFF 46.8 Hz; tPEG score 193) and patient with hepatic encephalopathy (age 64 years; CFF 37.7 Hz; tPEG score 416). Yellow arrows indicate regions with a significant difference in the group analysis (pallidum and dentate nuclei).
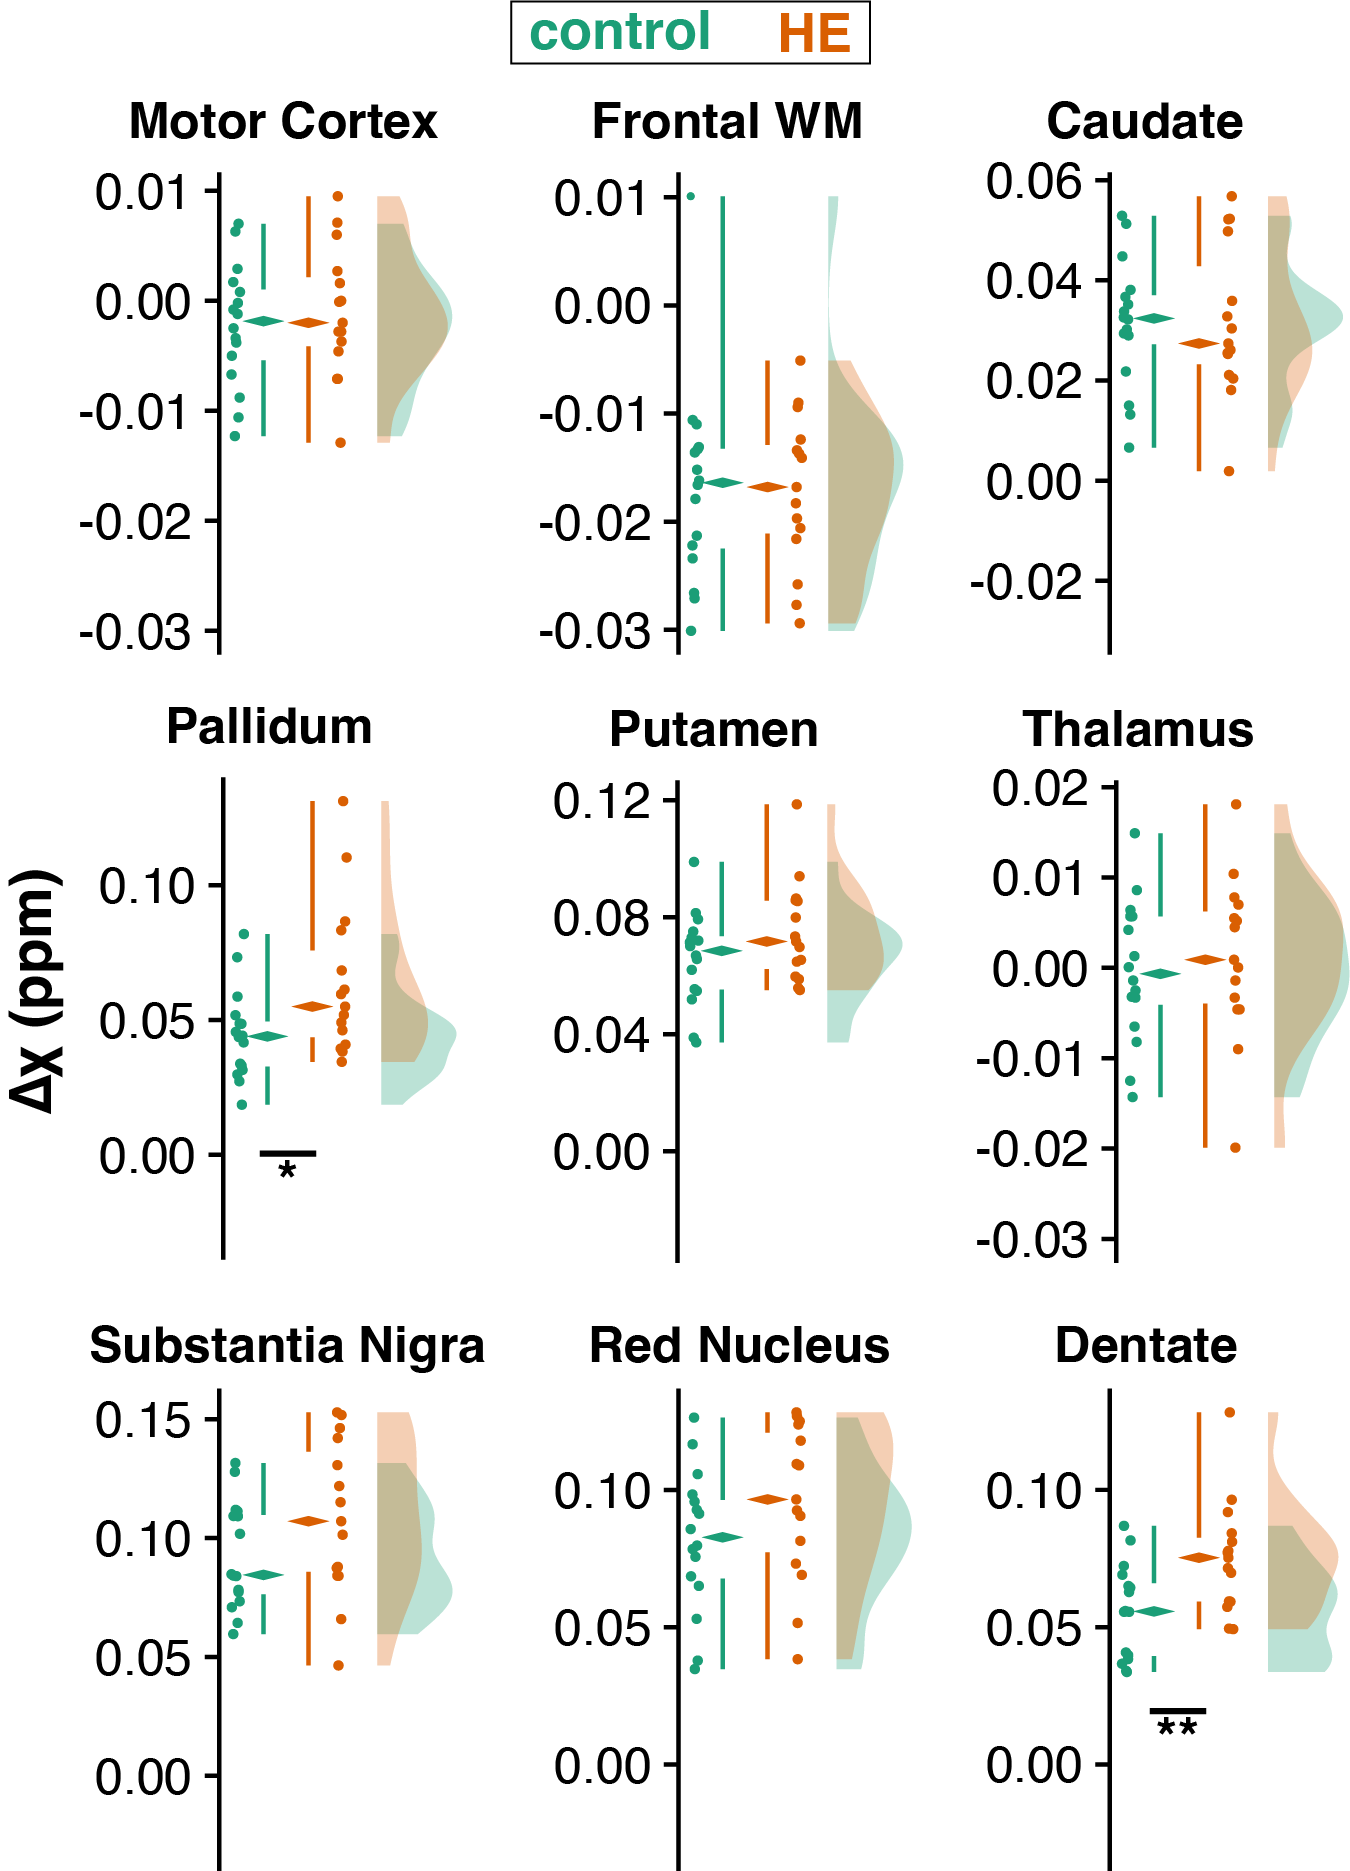
Quantitative susceptibility estimates from 9 brain regions. Raincloud plots include boxplots (median, inner quartile range, and whiskers), individual data points, and smoothed distributions. Significant differences are marked with asterisks (* = p < .05: ** = p < .01).
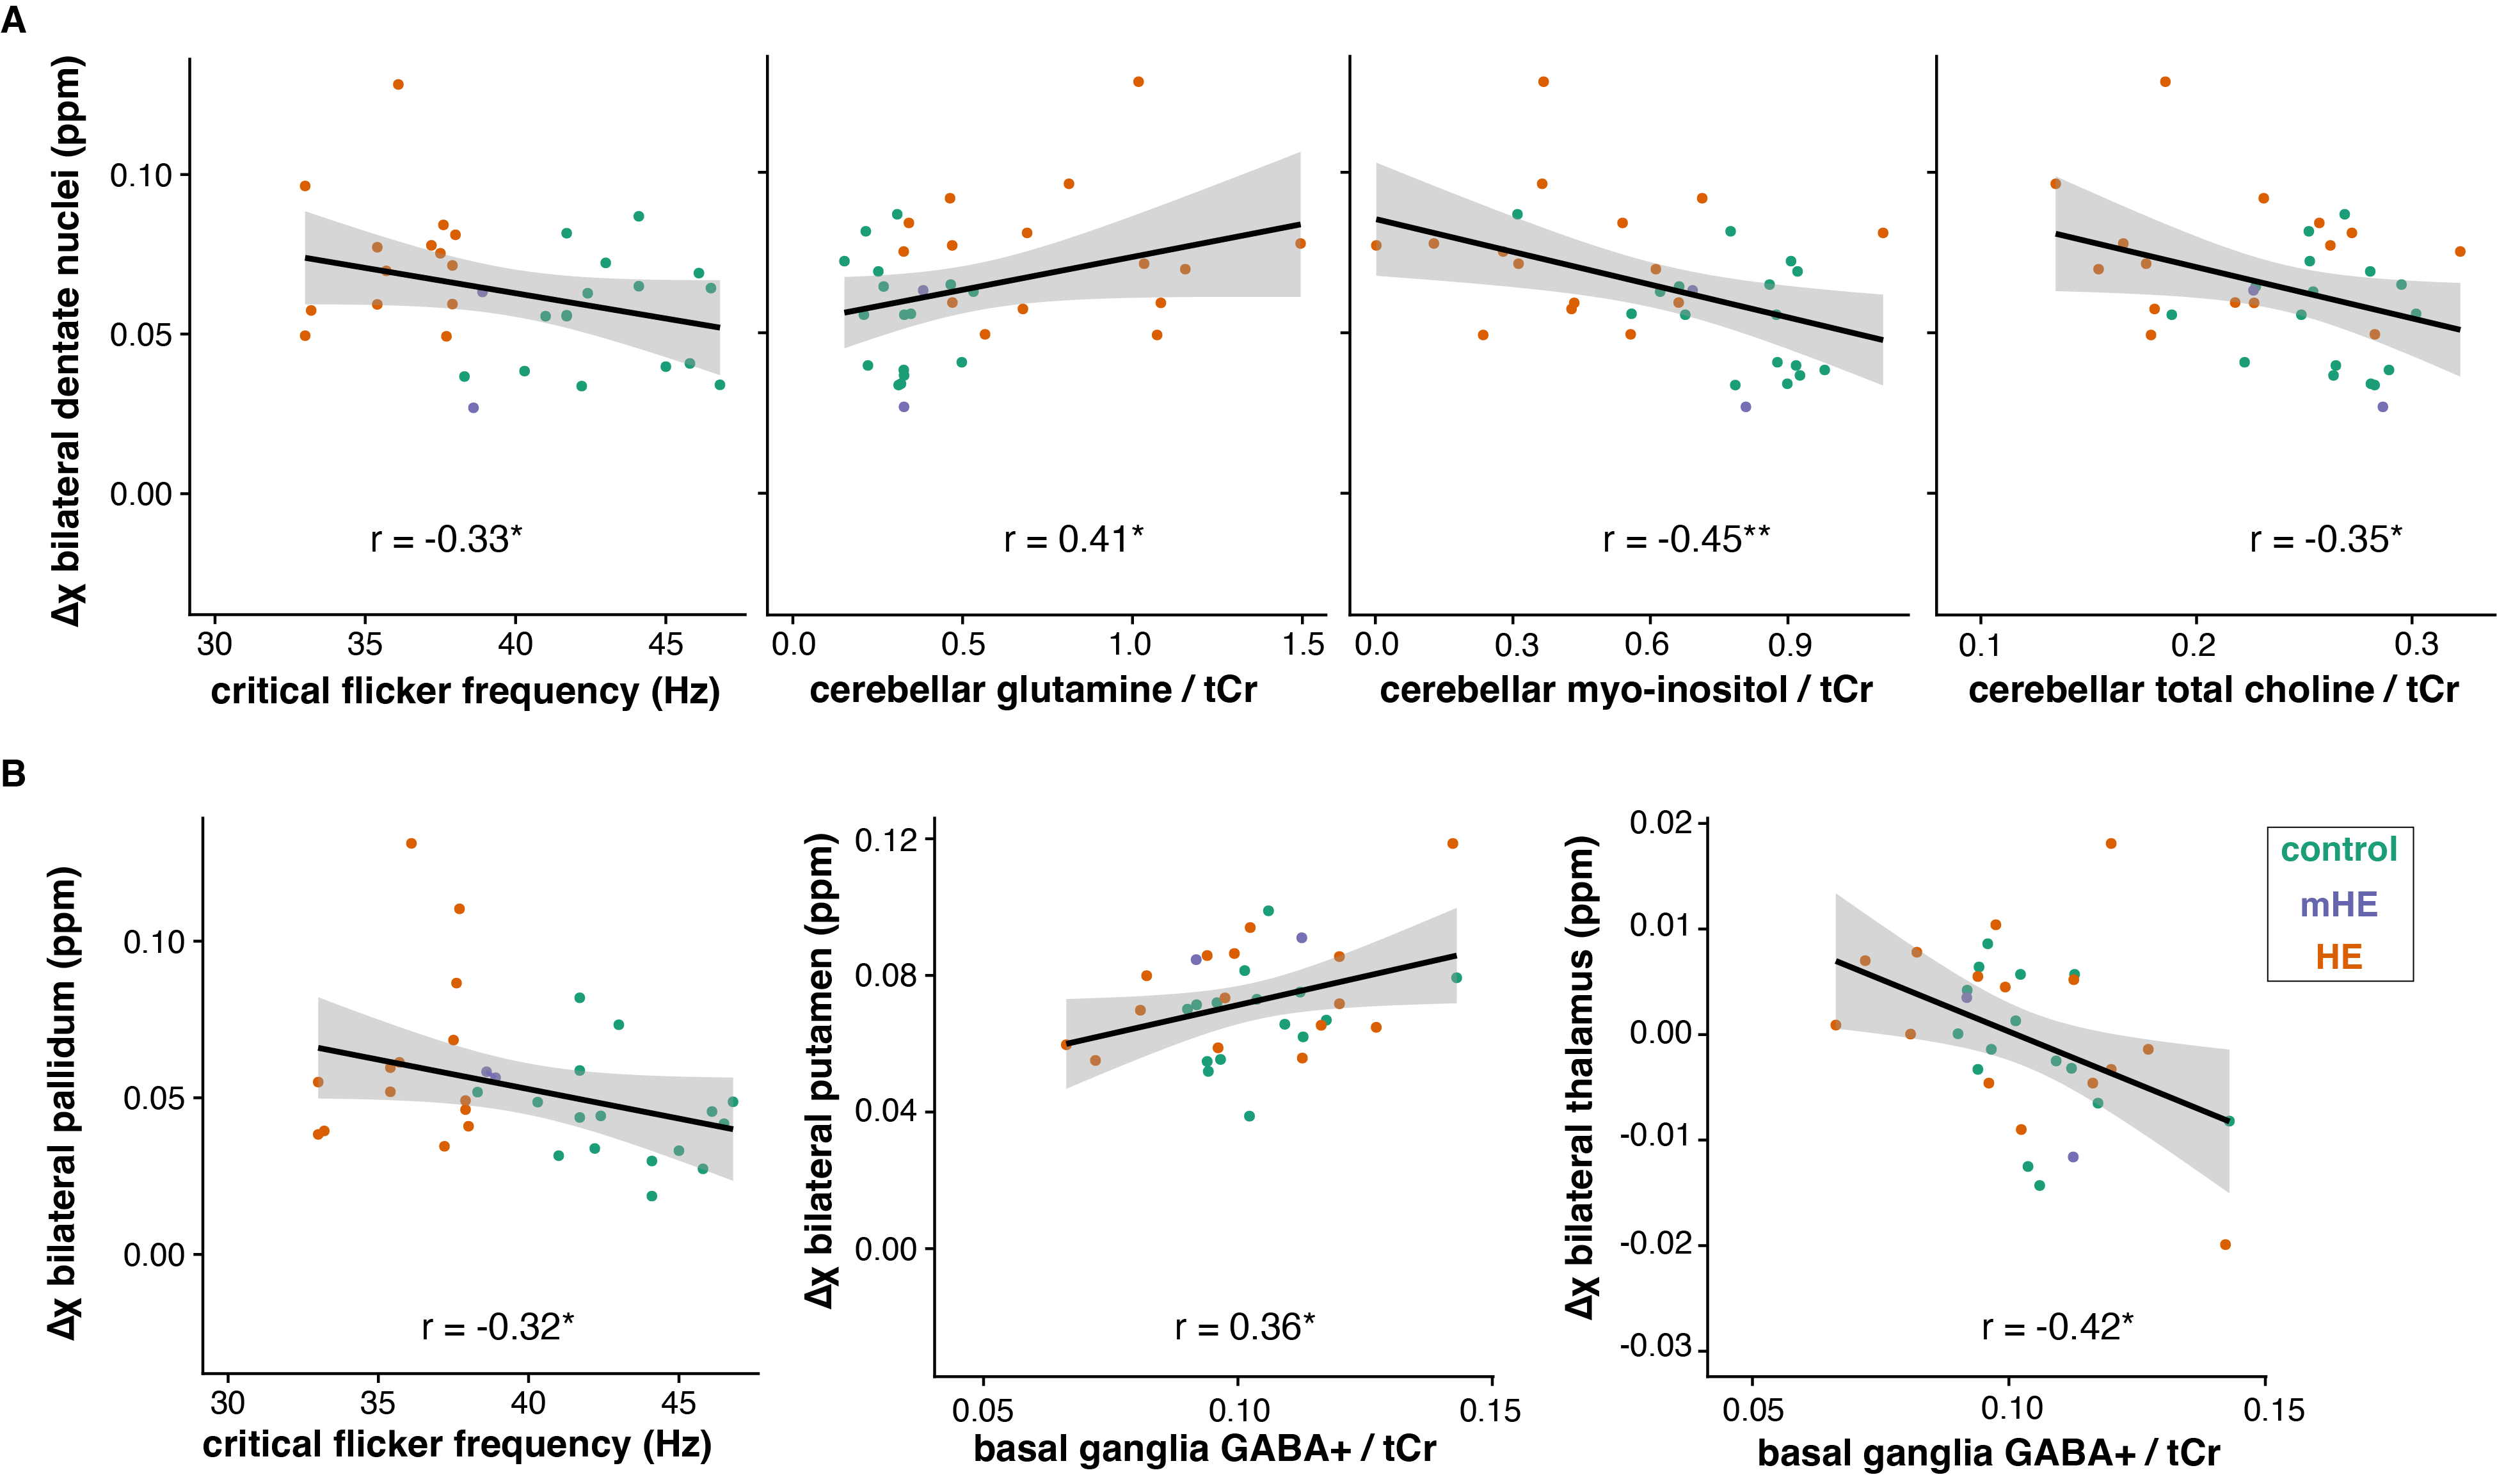
(A) Correlation analysis between quantitative estimates from the bilateral dentate nuclei, clinical measures, and selected neurometabolites derived from cerebellar MEGA-PRESS data. (B) Correlation analysis between quantitative susceptibility estimates from the bilateral pallidum, putamen, and thalamus and GABA+/tCr estimates derived from basal ganglia MEGA-PRESS data. Correlations are controlled for age and significant associations are marked with an asterisk (* = p < .05: ** = p < .01).
DOI: https://doi.org/10.58530/2023/3361