3360
Mapping Cortical Diffusion Variations with Normal Aging Using DTI: The Validity of the Tensor Interpretation1Medical Biophysics, University of Toronto, Toronto, ON, Canada, 2Rotman Research Institute, Baycrest Health Sciences, Toronto, ON, Canada
Synopsis
Keywords: Gray Matter, Aging
Aging-related changes in diffusion as measured by diffusion MRI (dMRI) of the white matter (WM) are often interpreted as being driven degeneration of myelinated axons and neurites, but the validity of this tensor (DTI) interpretation of the dMRI signal has never been tested in the cortex. In this study, age-related cortical diffusion variations were assessed using metrics derived from DTI and from the orthogonal-moment diffusion-tensor decomposition (DT-DOME) method. We demonstrate that the tensor interpretation of aging-related dMRI variations are most likely inadequate in the cortex.Introduction
Changes in cortical morphology in aging are often preceded by microstructural changes1. Diffusion MRI (dMRI), most commonly diffusion tensor imaging (DTI), allows measuring white-matter (WM) microstructure. DTI provides a tensor-based signal representation mainly through fractional anisotropy (FA) and mean diffusivity (MD)2. Decreasing FA and increasing MD have become hallmarks of WM aging, and commonly interpreted as demyelination and loss of myelinated axons3,4. Before a similar tensor interpretation can be applied to dMRI in the cortical gray-matter (GM), we need to first understand possible contributors to diffusion restriction and anisotropy within cortical layers (Figure 1). A recent study suggested that apical dendrites are the main contributors to diffusion anisotropy in the cortex5. In this study, we aimed to verify the primary contributor of dMRI metrics by assessing DTI-based cortical MD and FA associations with age, and comparing them with the cortical thickness (CT) measurements using the UK Biobank (UKB) data6. Furthermore, since FA is confounded by MD and is thus not an independent measure of anisotropy, we additionally assessed age-related alterations in the norm of anisotropy (NA) using an orthogonal tensor-moment decomposition (DT-DOME)7.Methods
700 healthy subjects from UKB dataset application 40922, evenly distributed across ages 45-80, were selected (M/F=1). dMRI data were acquired on a Skyra 3T scanner (Sieman’s, Erlangen, Germany) with 5x b=0s/mm2, 50 directions on b=1000s/mm2 and b=2000s/mm2 volumes using TR=3.6s, TE=92ms, matrix size=104x104x72 with 2mm3 resolution, 6/8 partial Fourier, 3x multislice acceleration and no in-plane acceleration6. T1-weighted MRI was obtained using the MPRAGE sequence with TR=2s, TI=880ms, matrix size=256x256x208, 1mm3 resolution.We used UKB pre-processed data that were corrected for eddy-current and susceptibility-related distortions via EDDY, and on which a 3D gradient distortion correction was applied8,9. The b=1000s/mm2 shell alone was used for DTI fitting to compute the FA and MD maps. NA maps were calculated using Eq. 1 via an in-house FSL and MATLAB-based script
$$ NA = \sqrt{(\lambda_1 - MD)^2 + (\lambda_2 - MD)^2 + (\lambda_3 - MD)^2} \space\space(1)$$
Cortical thickness estimation and surface reconstruction were performed using FreeSurfer’s recon-all10. FA, MD, and NA maps were projected onto cortical surfaces via FreeSurfer’s mri_vol2surf (projfrac=0.5) and registered to a standard surface. A CT map was also calculated using FreeSurfer’s mri_surf2surf.
Voxelwise linear fitting to age with cluster-wise correction was performed and the age-effect size was computed for each metric using FreeSurfer’s mri_glmfit and mri_glmfit-sim (p<0.05, 𝞪=0.05)11.
Results
We found widespread positive associations between MD and age (Figure 2a). The strongest age effect was found on the insula, transverse temporal, superior parietal, caudal anterior cingulate, precuneus, and lingual cortices. These are contrasted with the distribution of CT age effects (Figure 2b), strongest on the precentral, supramarginal, inferior parietal, superior and middle temporal, superior frontal, and paracentral gyri12. Figure 3a shows the negative association between FA and age predominantly in the supramarginal, lateral precentral, lateral postcentral, superior and inferior temporal gyri, and the right occipital cortex. FA results are nearly symmetrical across both hemispheres except that a small region of the left posterior cingulate cortex showed a positive association with age. This positive association is expanded in NA-age associations (Figure 3b), strongest in the cingulate, insula, and transverse temporal lobes. Strong negative age effects were also seen in NA, on the lateral precentral and postcentral gyrus for both hemispheres, and in the right supramarginal gyrus.Discussion and Conclusion
Both MD and FA exhibit significant widespread microstructural changes in aging that cannot be captured by conventional CT measurements. MD age effects are more widespread than those of CT, and regions with the greatest variations with age in MD and FA have nearly no spatial overlap with that in CT. This suggests that CT does not fully reflect cortical changes in aging. Moreover, while FA and NA both exhibited negative age associations in areas such as the supramarginal cortex, NA also revealed positive age-associations in regions (e.g. cingulate cortex) where FA failed to show age association, while NA failed to exhibit significant age effects in regions showing negative FA-age associations (e.g. superior parietal lobe). However, the explanations for the positive and negative NA-age associations are unclear. For example in the anterior cingulate and insula, MD is particularly associated positively with age, suggesting either microstructural degeneration or increasing partial-volume effects due to atrophy, although the latter is questioned by the lack of CT-age effects, NA is positively associated with age in the same region, suggesting an aging-related loss of dendritic branching13. Conversely, in the precentral and postcentral gyri, NA is strongly negatively associated with age while relatively weak age associations are seen in MD, countering the explanation through dendritic loss. One possibility is a shift in the shape of the dendrites rather than a loss, and alternatively there may be other major sources of diffusion anisotropy in the cortical GM than dendrites.Therefore, we conclude that while the tensor interpretation may be useful in studying GM microstructure, its biological interpretation requires careful investigation.Acknowledgements
References
Falangola MF, Jensen JH, Babb JS, Hu C, Castellanos FX, Di Martino A, Ferris SH, Helpern JA. Age-related non-Gaussian diffusion patterns in the prefrontal brain. Journal of Magnetic Resonance Imaging: An Official Journal of the International Society for Magnetic Resonance in Medicine. 2008 Dec;28(6):1345-50.
Pierpaoli C, Basser PJ. Toward a quantitative assessment of diffusion anisotropy. Magnetic resonance in Medicine. 1996 Dec;36(6):893-906.
Pfefferbaum A, Sullivan EV, Hedehus M, Lim KO, Adalsteinsson E, Moseley M. Age-related decline in brain white matter anisotropy measured with spatially corrected echo-planar diffusion tensor imaging. Magnetic Resonance in Medicine: An Official Journal of the International Society for Magnetic Resonance in Medicine. 2000 Aug;44(2):259-68.
Scheltens P, Barkhof F, Leys D, Wolters EC, Ravid R, Kamphorst W. Histopathologic correlates of white matter changes on MRI in Alzheimer's disease and normal aging. Neurology. 1995 May 1;45(5):883-8.
Reveley C, Frank QY, Mars RB, Matrov D, Chudasama Y, Leopold DA. Diffusion MRI Anisotropy in the Cerebral Cortex is Determined by Unmyelinated Tissue Features. bioRxiv. 2022 Jan 1:2021-09.
UK Biobank - UK Biobank. 2022 [cited 2022Nov6]. Available from: https://www.ukbiobank.ac.uk/
Chad JA, Pasternak O, Chen JJ. Orthogonal moment diffusion tensor decomposition reveals age-related degeneration patterns in complex fiber architecture. Neurobiology of Aging. 2021 May 1;101:150-9.
Andersson, J.L. and Sotiropoulos, S.N., 2016. An integrated approach to correction for off-resonance effects and subject movement in diffusion MR imaging. Neuroimage, 125, pp.1063-1078.
Alfaro-Almagro F, Jenkinson M, Bangerter NK, Andersson JL, Griffanti L, Douaud G, Sotiropoulos SN, Jbabdi S, Hernandez-Fernandez M, Vallee E, Vidaurre D. Image processing and Quality Control for the first 10,000 brain imaging datasets from UK Biobank. Neuroimage. 2018 Feb 1;166:400-24.
Dale AM, Fischl B, Sereno MI. Cortical surface-based analysis: I. Segmentation and surface reconstruction. Neuroimage. 1999 Feb 1;9(2):179-94.
Mutsaerts HJ, Petr J, Václavů L, Van Dalen JW, Robertson AD, Caan MW, Masellis M, Nederveen AJ, Richard E, MacIntosh BJ. The spatial coefficient of variation in arterial spin labeling cerebral blood flow images. Journal of Cerebral Blood Flow & Metabolism. 2017 Sep;37(9):3184-92.
Archibald GAD, Chad JA, Salat DH, Chen JJ. Can mapping cortical diffusivity provide unique microstructural insight into aging? International Society for Magnetic Resonance in Medicine, 2020 August 8-14.
Kroenke CD. Using diffusion anisotropy to study cerebral cortical gray matter development. Journal of Magnetic Resonance. 2018 Jul 1;292:106-16.
Zilles K, Palomero-Gallagher N, Amunts K. Cytoarchitecture and maps of the cerebral cortex In: Toga A, editor. Brain mapping an encyclopedic reference. London/San Diego/Waltham. 2015; 137-56.
Figures
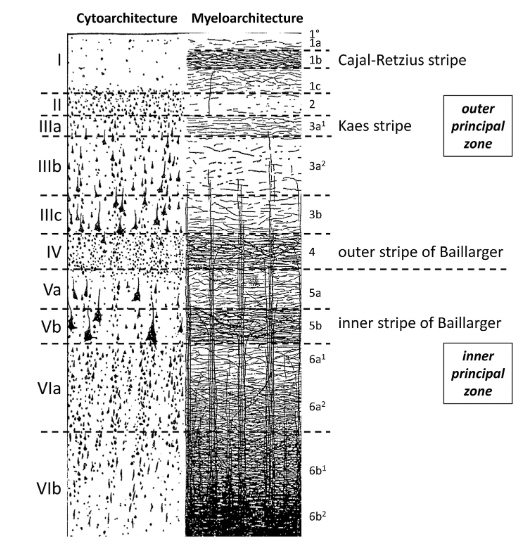
Figure 1. Illustration of cell bodies (Cytoarchitecture) and myelinated fibers (Myeloarchitecture) in human cortical layers. Based on this illustration, it can be assumed that the myelinated fibers may give rise to characteristic diffusion patterns such as increased anisotropic along the fiber orientation. It is unclear to what extent neurites and cell bodies, which are also illustrated, contribute to diffusion anisotropy (Figure adapted from Zilles et al.14).
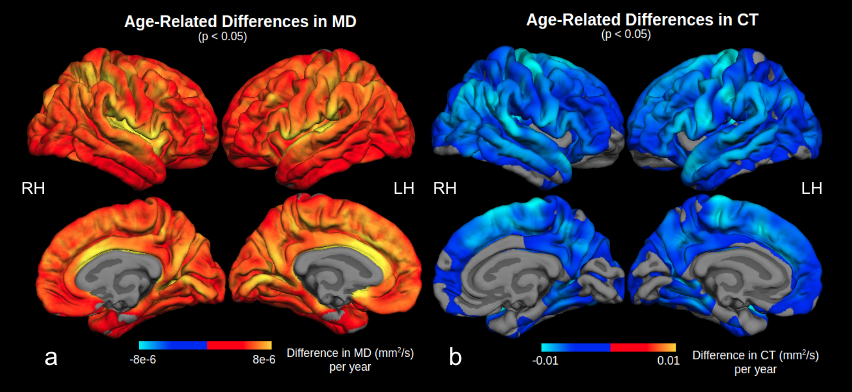
Figure 2. Surface display of the age-related difference in MD (a) and CT (b) in significant clusters. The greatest age effect on MD was observed in the insula and anterior cingulate cortex, while that for CT was in the superior frontal, precentral, supramarginal, posterior parietal, temporal, and paracentral gyri. The greatest difference in MD and CT with age do not overlap spatially on the cortex.
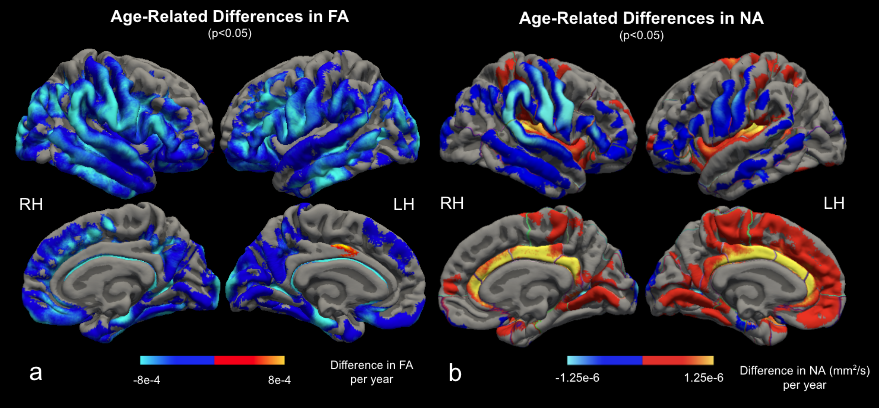
Figure 3. Surface display of the age-related difference in FA (a) and NA (b) in significant clusters. Both metrics found significant negative age effects on the precentral, postcentral, supramarginal, and temporal cortices. FA additionally decreases on occipital, superior and middle frontal lobes. NA found positive age effects on the cingulate, insula, and transverse temporal cortices.