3358
Patients with type 1 diabetes and albuminuria have reduced cerebral grey matter unrelated to cerebrovascular dysfunction.1Clinic for Clinical Physiology and Nuclear Medicine, Rigshospitalet, Glostrup, Denmark, 2Steno Diabetes Center Copenhagen, Herlev, Denmark
Synopsis
Keywords: Gray Matter, Diabetes, Cerebrovascular function
Patients with diabetes mellitus type 1 (T1D) demonstrate brain alterations including gray matter (GM) atrophy. We examined whether a GM reduction could be related to cerebrovascular dysfunction. GM volume was measured by anatomical MRI. Cerebrovascular function was examined by measuring cerebral blood flow, oxygen metabolism and lactate concentration in response to inhalation of hypoxic air using phase-contrast MRI and MRS. T1D patients were evaluated for albuminuria as indication of vessel damages. Patients with T1D and albuminuria had reduced GM compared to patients with normal kidney function or healthy controls, however, the GM atrophy could not be related to cerebrovascular dysfunction.Introduction
Patients with type 1 diabetes (T1D) demonstrate brain alterations, including a reduction of the cerebral grey matter (GM) volume 1. A possible cause for this atrophy could be due to diabetes-related vascular complications. Studies have demonstrated reduced cerebrovascular reactivity in patients with T1D, likely as a result of microvascular- and endothelium damage to the cerebral vessels 2,3.Cerebrovascular dysfunction is associated with GM atrophy, cerebral white matter (WM) alterations and general poorer brain health 4,5. In the present study we investigated whether a group of patients with T1D and indications of microvascular damage, evident by albuminuria has lower cerebral GM volume, and if this can be related to cerebrovascular dysfunction. Total brain, GM and WM volumes were estimated by anatomical MRI. The cerebrovascular function was investigated by measuring global cerebral blood flow (CBF), cerebral metabolic rate of oxygen (CMRO2) and cerebral lactate concentration in response to inhalation of hypoxic air using phase contrast MRI and MRS techniques. The increase in CBF in reaction to hypoxic exposure was used as a marker of cerebrovascular function. CMRO2 and lactate were additionally measured to examine whether the oxygen metabolism was compromised as a result on inadequate CBF reactivity.Methods
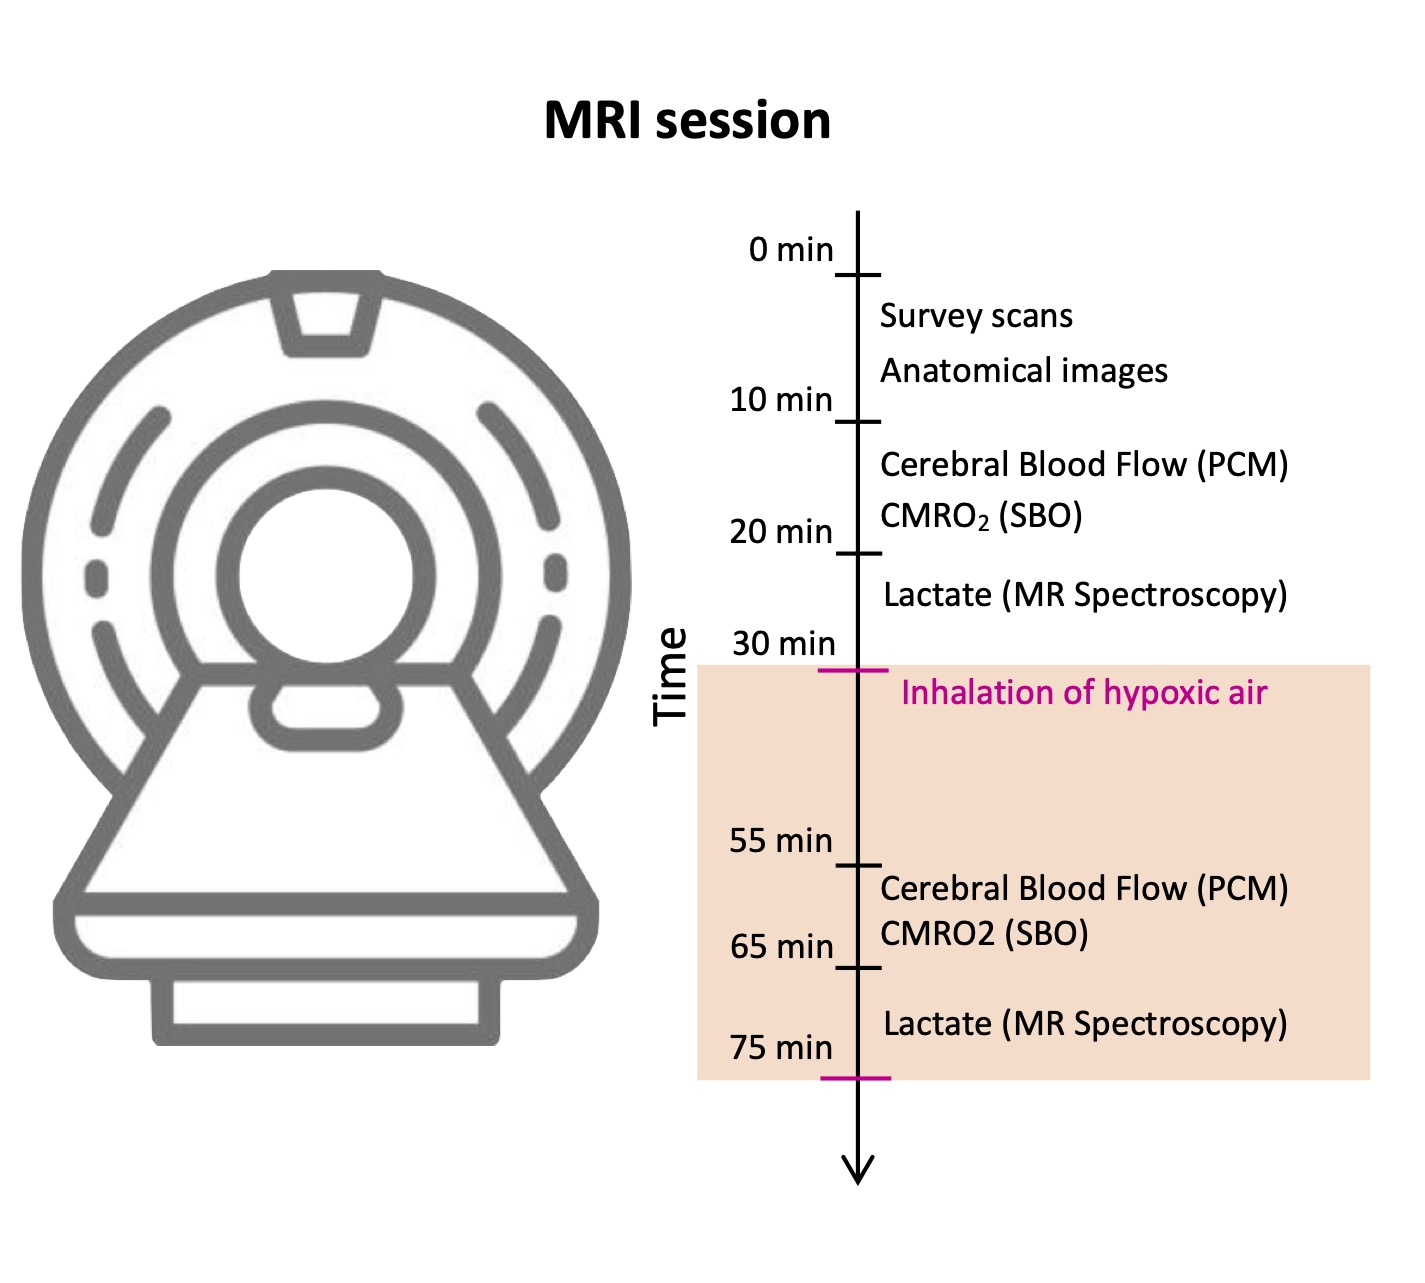
The study included 33 patients with T1D (18 females, mean age: 50.8 years (range: 26-72)) and 19 matched healthy controls (7 females, mean age: 45.0 years (range: 24-64)). Eleven (33%) of the patients had albuminuria, defined as a urinary albumin excretion > 30-300 mg/g creatinine in two out of three consecutive measurements retrieved from the patient journal.All subjects were scanned using a Philips 3T dSTREAM Achieva MRI-scanner (Philips Medical Systems) with a 32-channel phased array head coil. The experiment consisted of a single MRI scan session (Figure 1). High resolution structural brain images were acquired by a 3D T1-weighted turbo field echo sequence (echo time (TE)=5.11 ms; repetition time (TR)=11.2 ms; flip angle=8°, voxel size=0.70 × 0.76 × 0.70 mm3). Total brain, GM and WM volumes were estimated using segmentation of the images.CBF was calculated by measuring the blood flow through the feeding cerebral arteries (the carotids and basilaris) using velocity-sensitive phase contrast mapping (PCM) MRI 6,7. Blood velocity-weighted images were acquired by a velocity-encoding turbo field gradient-echo sequence (1 slice; voxel size=0.75 × 0.75 × 8 mm3; TE=7.33 ms; TR=27.63 ms; flip angle=10°; velocity encoding=100 cm/s; without cardiac gating). The blood flows in the cerebral arteries were calculated by multiplying the mean blood velocity by the cross-sectional area from regions of interest defining each vessel. CMRO2 were calculated by Fick’s principle, . Using susceptibility weighted oximetry (SBO) MRI technique the venous oxygen saturation (SvO2) of the blood leaving the brain in the sagittal sinus was acquired 8. Susceptibility-weighted maps were acquired using a dual-echo gradient-echo sequence and subtracting the phase maps from each echo (1 slice, voxel size=0.5 × 0.5 × 8 mm3; TE1=10.89 ms; TE2=24.16 ms; flip angle=30°; 5 repeated measures, total duration=1 min 30 s; SENSE-factor=2). The hemoglobin concentration (Hgb) was measured from venous blood samples and arterial oxygen saturation (SaO2) was measured using pulse oximetry.Cerebral lactate concentrations were measured by MRS technique using a water-suppressed point-resolved spectroscopy (PRESS) pulse sequence (TR=3000 ms; TE=288 ms; voxel size=30 × 35 × 30 mm3). The sequence was optimized to measure lactate by using a long echo time of 288 ms. The MRS voxel was placed in precuneus. CBF, CMRO2 and lactate concentration were initially measured during normoxia, and the acquisitions were hereafter repeated during inhalation of hypoxic air with 12-14% fractional oxygen content (Figure 1).Results
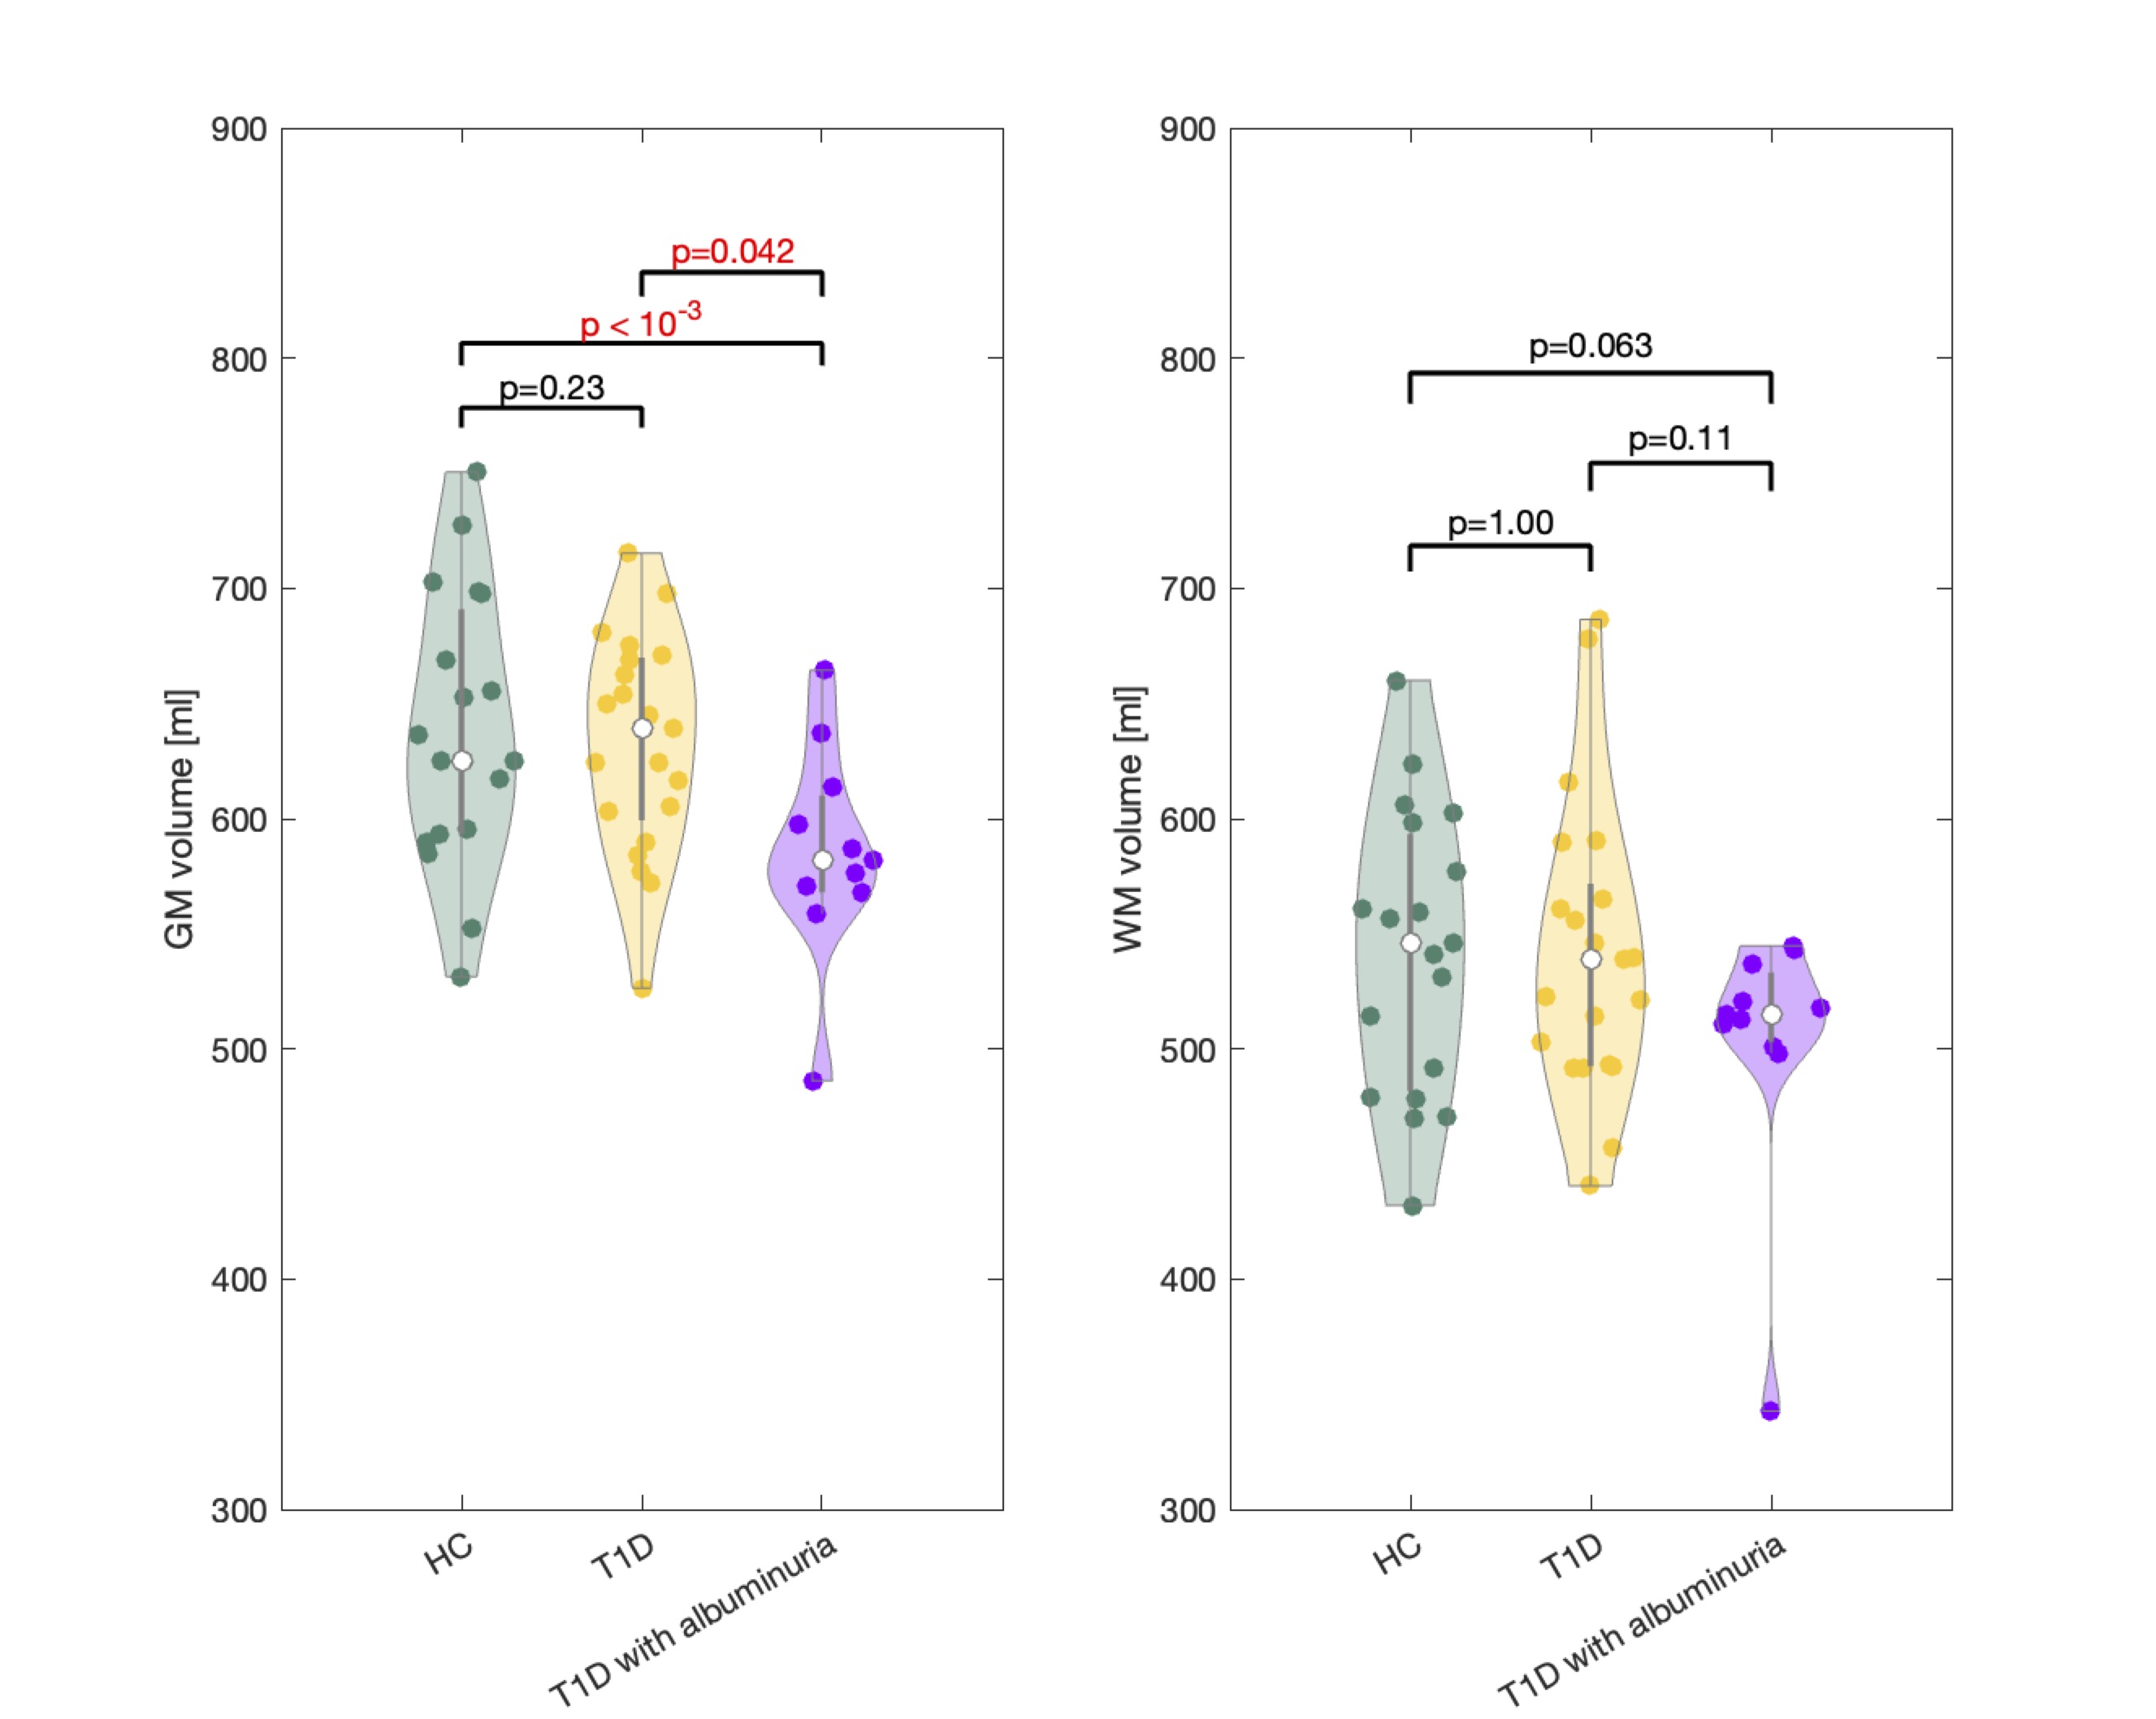
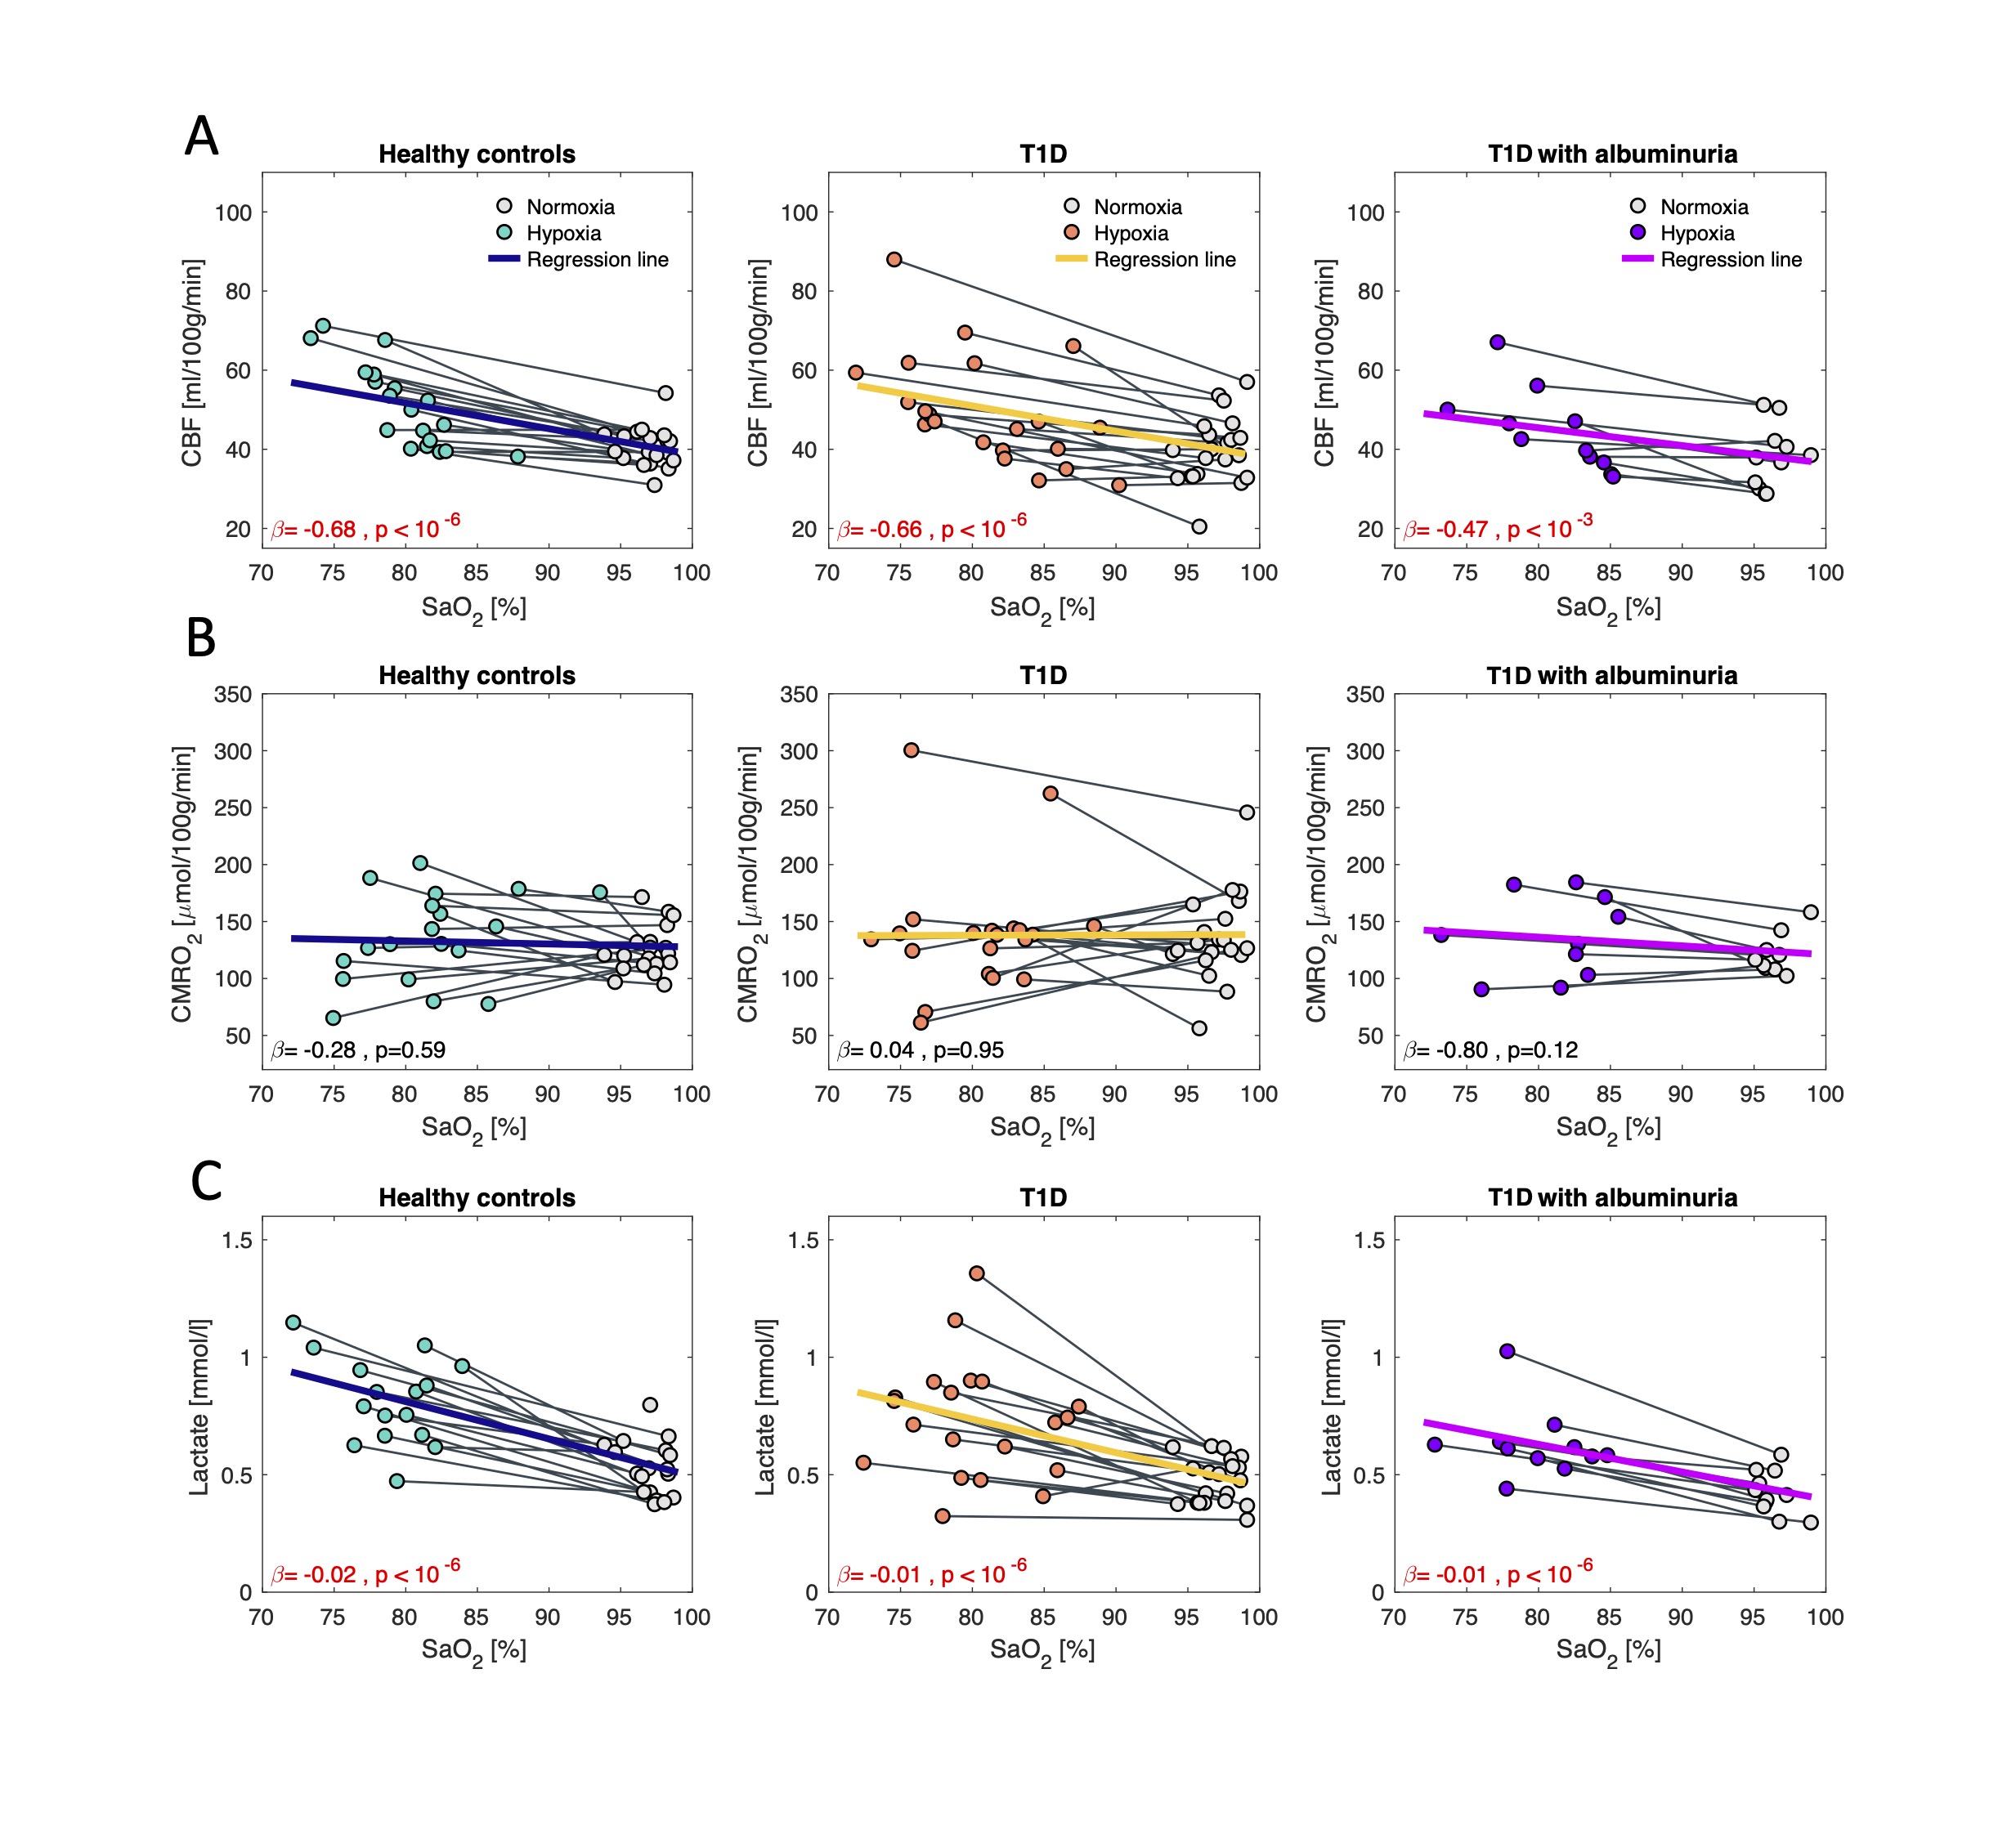
Patients with T1D and albuminuria had lower cerebral GM (585.6±45.9 ml) than the T1D patients without albuminuria (632.5±47.0 ml, p=0.042) and the controls (638.4±58.8 ml, p<10-3) (Figure 2). Comparisons were perform using a multivariate regressions model and adjusting for age and sex. There were no differences in resting CBF, CMRO2 or lactate concentration between the three groups. Effects from inhalation of hypoxic air on CBF, CMRO2 and cerebral lactate concentration are shown in Figure 3. The effect from hypoxia was tested by a mixed regression model with SaO2 as fixed effect and subject indication as random effect. To test whether the responses were different between the groups and interaction term between group indication and SaO2 was added to the model. Hypoxic exposure increased CBF in all groups (p<10-3), however, there were no significant differences between the groups (p>0.13). CMRO2 was unaffected by inhalation of hypoxic air in all groups. Cerebral lactate concentration increased in all groups from hypoxic exposure (p<10-6) but with no significant difference between the groups (p>0.56).Discussion and conclusion
Patients with T1D and albuminuria had lower cerebral GM than controls and patients without albuminuria. We did not observe lower cerebrovascular function in the T1D group, as shown in previous studies. A reason could be that the T1D groups were not affected enough by their disease to demonstrate cerebrovascular dysfunction, compared with other studies. Overall, the results from present study suggest that the GM matter alterations observed with T1D and albuminuria occurs before substantial reduction in cerebrovascular functions. The reason for GM atrophy seen in patients with albuminuria should be further examined.Acknowledgements
No acknowledgement found.References
1. Moheet A, Mangia S, Seaquist ER. Impact of diabetes on cognitive function and brain structure. Ann N Y Acad Sci 2015; 1353: 60–71.
2. Kozera GM, Wolnik B, Kunicka KB, Szczyrba S, Wojczal J, Schminke U et al. Cerebrovascular reactivity, intima-media thickness, and nephropathy presence in patients with type 1 diabetes. Diabetes Care 2009; 32: 878–882.
3. Fulesdi B, Limburg M, Bereczki D, Michels RPJ, Neuwirth G, Legemate D et al. Impairment of Cerebrovascular Reactivity in Long-Term Type 1 Diabetes. Diabetes 1997; 47: 1840–1845.
4. Silvestrini M, Pasqualetti P, Baruffaldi R, Bartolini M, Handouk Y, Matteis M et al. Cerebrovascular reactivity and cognitive decline in patients with Alzheimer disease. Stroke 2006; 37: 1010–1015.
5. Catchlove SJ, Pipingas A, Hughes ME, Macpherson H. Magnetic resonance imaging for assessment of cerebrovascular reactivity and its relationship to cognition: A systematic review. BMC Neurosci 2018; 19. doi:10.1186/s12868-018-0421-4.
6. Bakker CJG, Hartkamp MJ, Mali WPTM. Measuring blood flow by nontriggered 2D phase-contrast MR angiography. Magn Reson Imaging 1996; 14: 609–614.
7. Vestergaard MB, Lindberg U, Aachmann-Andersen NJ, Lisbjerg K, Christensen SJ, Rasmussen P et al. Comparison of global cerebral blood flow measured by phase-contrast mapping MRI with 15O-H2O positron emission tomography. Journal of Magnetic Resonance Imaging 2017; 45: 692–699.
8. Jain V, Langham MC, Wehrli FW. MRI estimation of global brain oxygen consumption rate. Journal of cerebral blood flow and metabolism 2010; 30: 1598–607.
Figures