3357
High resolution diffusion tensor imaging shows non-linear trajectories in the human cortex over the healthy lifespan1Biomedical Engineering, University of Alberta, Edmonton, AB, Canada, 2Computer Science, Université de Sherbrooke, Sherbrooke, QC, Canada
Synopsis
Keywords: Gray Matter, Diffusion Tensor Imaging
The brain cortex is thin and has a complex morphology making it difficult to analyze with in vivo diffusion MRI. A high-resolution 1.5 mm isotropic diffusion MRI protocol and an automated cortex segmentation methodology on the diffusion images alone was used to assess cortical diffusion changes over the healthy lifespan (n=165, 5-74 years). The diffusion metrics versus age trajectories differed across the cortical surface despite similar cortical thickness reductions with age. The most robust age changes were for axial diffusivity (quadratic U) and radiality (cubic) potentially reflecting changes in columnar microstructural organization of the cortex in typical development and aging.
Introduction
Diffusion tensor imaging (DTI) studies of changes in cerebral microstructure associated with healthy brain development and aging across the human lifespan from young childhood to the elderly have primarily focused on white matter1,2. In contrast, DTI of cortex changes in healthy individuals has been mainly on preterm neonates that demonstrate robust reductions of diffusion anisotropy, reflecting diminished radial cyto-architecture within the cortex, in the first year of life3,4. DTI of cerebral cortex is challenging given its complex folding and limited thickness (~1-5 mm) that gets thinner over the lifespan as measured on T1-weighted images5,6. Typical whole-brain DTI acquisition resolutions used for white matter are insufficient for the cortex. However, with sufficiently high spatial resolution, diffusion anisotropy and radiality is evident in the adult cortex7. It is unknown how DTI metrics change in the human cortex over the healthy lifespan from childhood to the elderly. The purpose here was to assess the typical cortical diffusion changes over the “lifespan” (n=165, 5-74 years) only using high-resolution (1.5 mm isotropic) DTI at a single site and an automated cortical segmentation pipeline to measure cortical DTI metrics without relying on registration to structural MRI8.Methods
Whole-brain DTI was acquired on a 3T Siemens Prisma using a 64 channel RF coil from 165 healthy volunteers (92 females, 5-74 years) using the following protocol: single-shot EPI with Stejskal-Tanner gradients, 90 1.5 mm axial/oblique slices, 1.5x1.5 mm2 in-plane 2x zero-fill interpolated to 0.75x0.75 mm2, GRAPPA R=2, phase partial Fourier 6/8, TR 4700 ms, TE 64 ms, 6 b=0 and 30 b=1000 s/mm2, scan time 3.3 minutes. DTI was processed using a custom pipeline including denoising, eddy current and motion corrections, and segmentation of the inner, outer, and mid-cortical surfaces solely on the diffusion images (Figure 1). Cortical meshes were segmented by registering a cortical template9 to an individual’s WM/cortex surface outputting segmentation of frontal, occipital, parietal, temporal and insular lobes8. The six cortical metrics analyzed were fractional anisotropy (FA), mean (MD), axial (AD) and radial diffusivity (RD), cortical thickness (from the diffusion-derived surfaces, not T1), and radiality index7 where 1 and 0 reflects the primary eigenvector being perpendicular and parallel to the mid-cortex surface, respectively. These were assessed for total cortex and five lobes (combining hemispheres) versus age with polynomial models, choosing the simplest one according to lack-of-fit sum of squares hypothesis test, which tests the null hypothesis that the polynomial model does not fit the data. All the models reported have p<0.05; a threshold of R2>0.2 was chosen to highlight the models with strongest correlations that show an age dependency.Results
The automated cortical segmentation procedure on diffusion images alone worked well across the lifespan (Figure 1). The cortical metrics averaged over the total cortex showed different age-trajectories (Figure 2). Notably, FA and AD were described with a ‘U’-shaped quadratic model showing a reduction to a minimum around age 35 years and then a steeper increase with values at 74 years surpassing that in childhood. Radiality showed a negative linear correlation with age. Total cortex MD and RD did not show age-related changes. The cortical thickness showed the expected reduction from 5 years old up to middle adulthood (~40 years) which then levelled off. There were no sex differences in the trajectories (data not shown).Across five cortical regions, the cortical thickness showed similar reductions with age, but interestingly, the diffusion metrics versus age trajectories yielded differences amongst the lobes (Figure 3). FA only changed with age (quadratic U) in the frontal lobe and insula with minima in the mid-30s; the paradoxical higher FA at older ages being driven by a greater increase in AD than RD. AD was best fit with quadratic U-shape in 3/5 lobes with the largest increase at older ages in the frontal lobe. Radiality index showed a complex cubic reduction versus age in frontal, parietal, and occipital lobes, with a rapid drop to the 20s which then remained flat till 60 years followed by a steeper drop. A summary of the best fits for the five lobes highlights their unique regional age changes; notably all 6 cortical parameters in the frontal lobe correlated with age (Figure 4).
Discussion
The general trend of cortical thinning with age is consistent with studies using structural 3D T1-weighted 1 mm isotropic MRI5,6. The minimum age of mid-30s of FA (and AD) in cortex coincides with similar ages of maximum FA in certain white matter tracts1. Also, in contrast to white matter where RD changes more with age than AD1, the reverse was true in cortex. AD and radiality getting smaller during development could reflect increased complexity of cortical crossing fibres, which then levels off during most of adulthood. Larger AD and accelerated loss of radiality in the elderly could suggest less crossings, neuronal loss, and altered columnar microstructure organization. However, the percent changes of the diffusion metrics are quite small overall (1.9-3.8%), with the biggest change in radiality (8%) involving an intriguing cubic trajectory. Exploration of the in vivo microstructural properties of the healthy human cortex over the lifespan will serve as a baseline to identify changes in atypical aging and neurodevelopmental disorders.Acknowledgements
No acknowledgement found.References
- Lebel, C., Gee, M., Camicioli, R., Wieler, M., Martin, W., and Beaulieu, C. Diffusion tensor imaging of white matter tract evolution over the lifespan. Neuroimage. 2012;60: 340–352.
- Seitz, J., Cetin-Karayumak, S., Lyall, A., Pasternak, O., Baxi, M. et al. Investigating Sexual Dimorphism of Human White Matter in a Harmonized, Multisite Diffusion Magnetic Resonance Imaging Study. Cereb. Cortex. 2021;31: 201–212.
- McKinstry, R. C., Mathur, A., Miller, J. H., Ozcan, A., Snyder, A. et al. Radial organization of developing preterm human cerebral cortex revealed by non-invasive water diffusion anisotropy MRI. Cereb. Cortex. 2002;12; 1237–1243.
- Ouyang, M., Jeon, T., Sotiras, A., Peng, Q., Mishra, V. et al. Differential cortical microstructural maturation in the preterm human brain with diffusion kurtosis and tensor imaging. Proc. Natl. Acad. Sci. U. S. A. 2019;116: 4681–4688.
- Zhou, D., Lebel, C., Evans, A., and Beaulieu, C. Cortical thickness asymmetry from childhood to older adulthood. Neuroimage. 2013;83: 66–74.
- Fjell, A. M., Grydeland, H., Krogsrud, S. K., Amlien, I., Rohani, D. A. et al. Development and aging of cortical thickness correspond to genetic organization patterns. Proc. Natl. Acad. Sci. U. S. A. 2015;112: 15462–15467.
- McNab, J. A., Polimeni, J. R., Wang, R., Augustinack, J. C., Fujimoto, K. et al. Surface based analysis of diffusion orientation for identifying architectonic domains in the in vivo human cortex. Neuroimage. 2015;69: 87–1002013.
- Little, G. T. and Beaulieu, C. Automated cerebral cortex segmentation based solely on diffusion tensor imaging for investigating cortical anisotropy. Neuroimage. 2021;237: 118105.
- Van Essen, D. C., Glasser, M. F., Dierker, D. L., Harwell, J. and Coalson, T. Parcellations and hemispheric asymmetries of human cerebral cortex analyzed on surface-based atlases. Cereb. Cortex. 2012;22: 2241–2262.
Figures
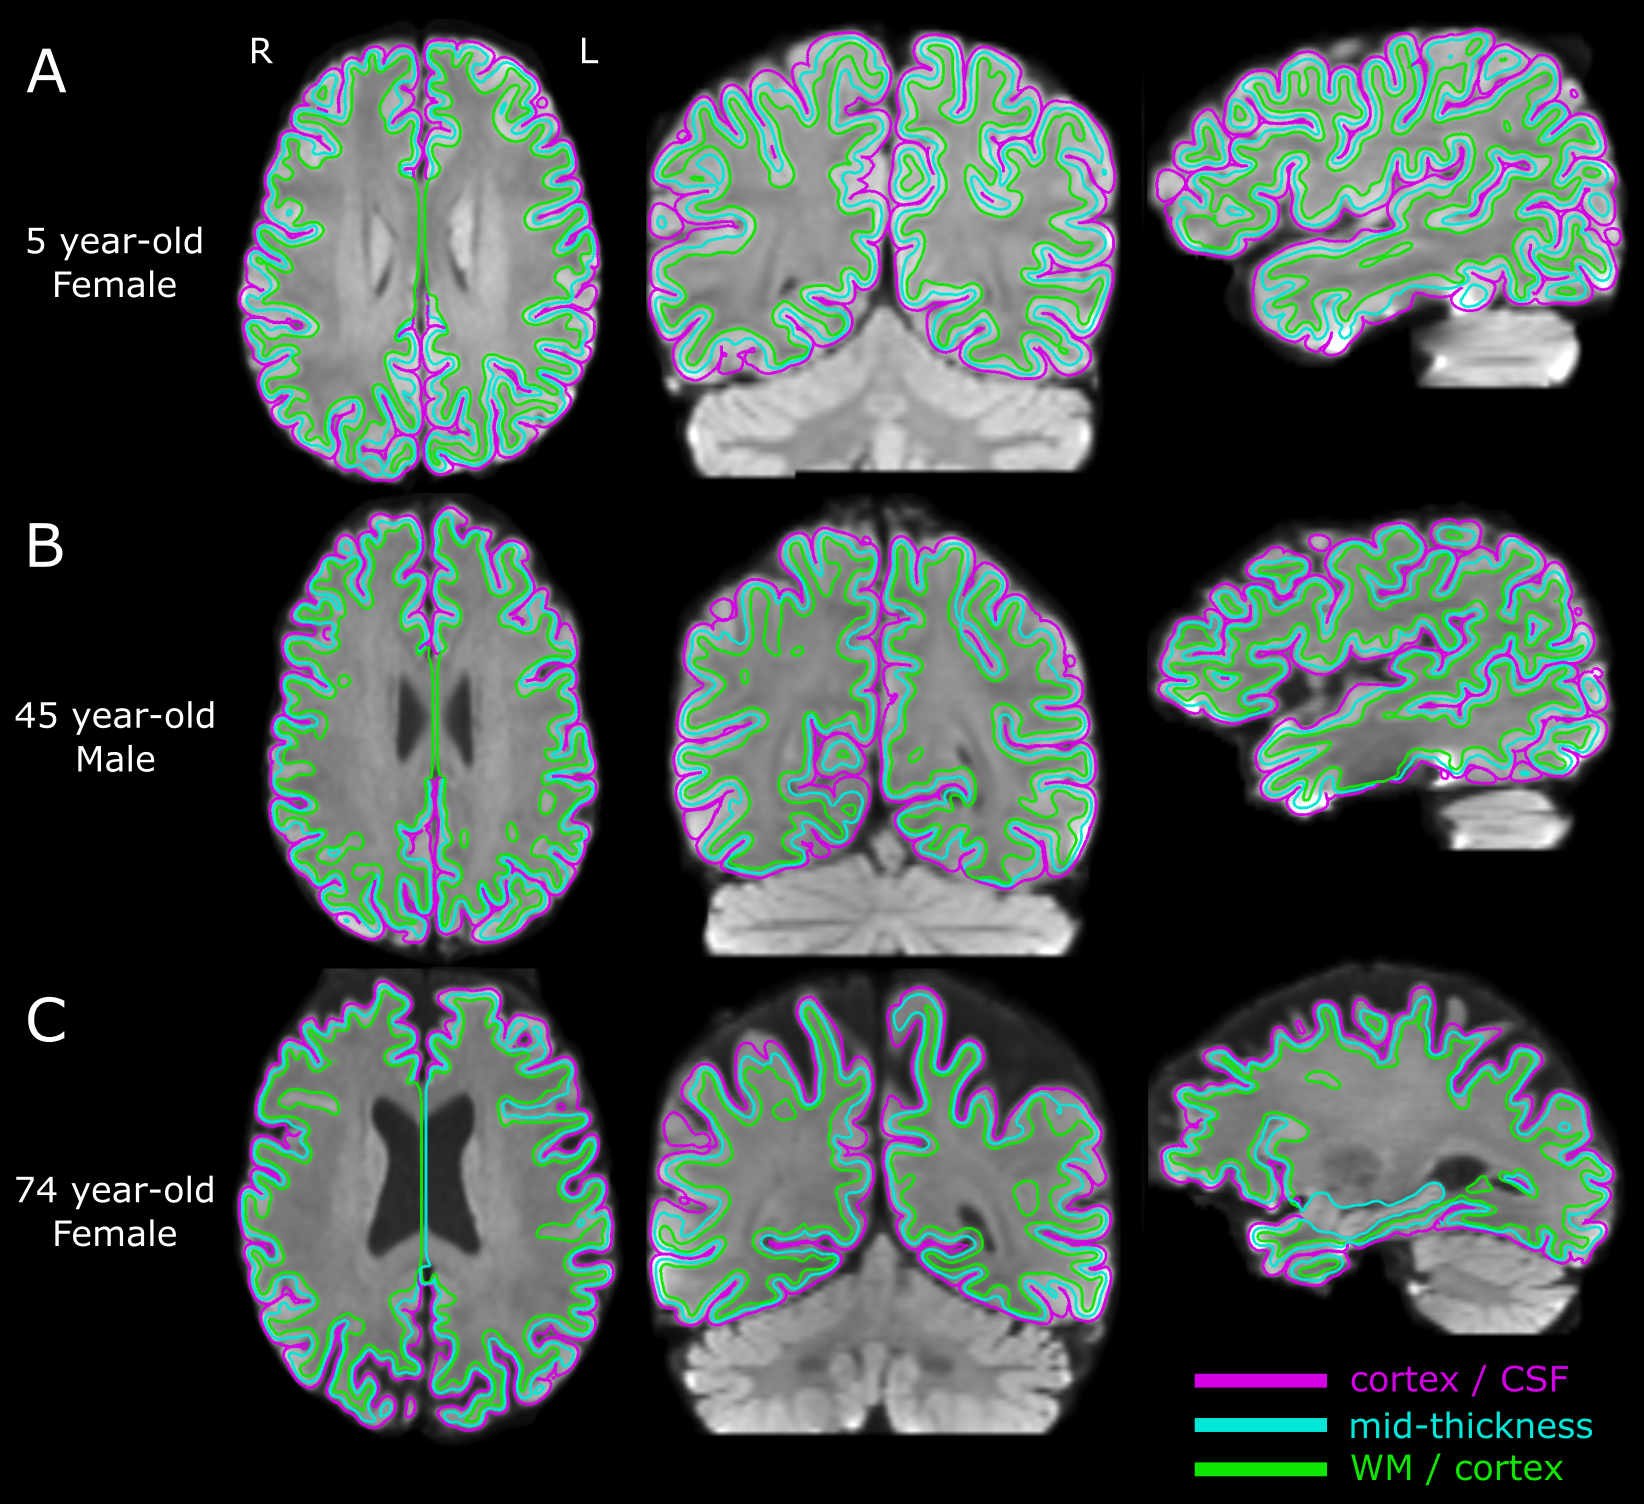
Figure 1. Example of the automated segmentation to delineate the cortical surfaces on 1.5 mm isotropic diffusion imaging alone in three participants with different ages. The magenta line is the surface between the cortex and the cerebrospinal fluid (CSF), the green line is the surface between the white matter (WM) and the cortex, and the cyan surface is the mid-thickness surface. The background image is a mean DWI volume as reference over the three anatomical planes.
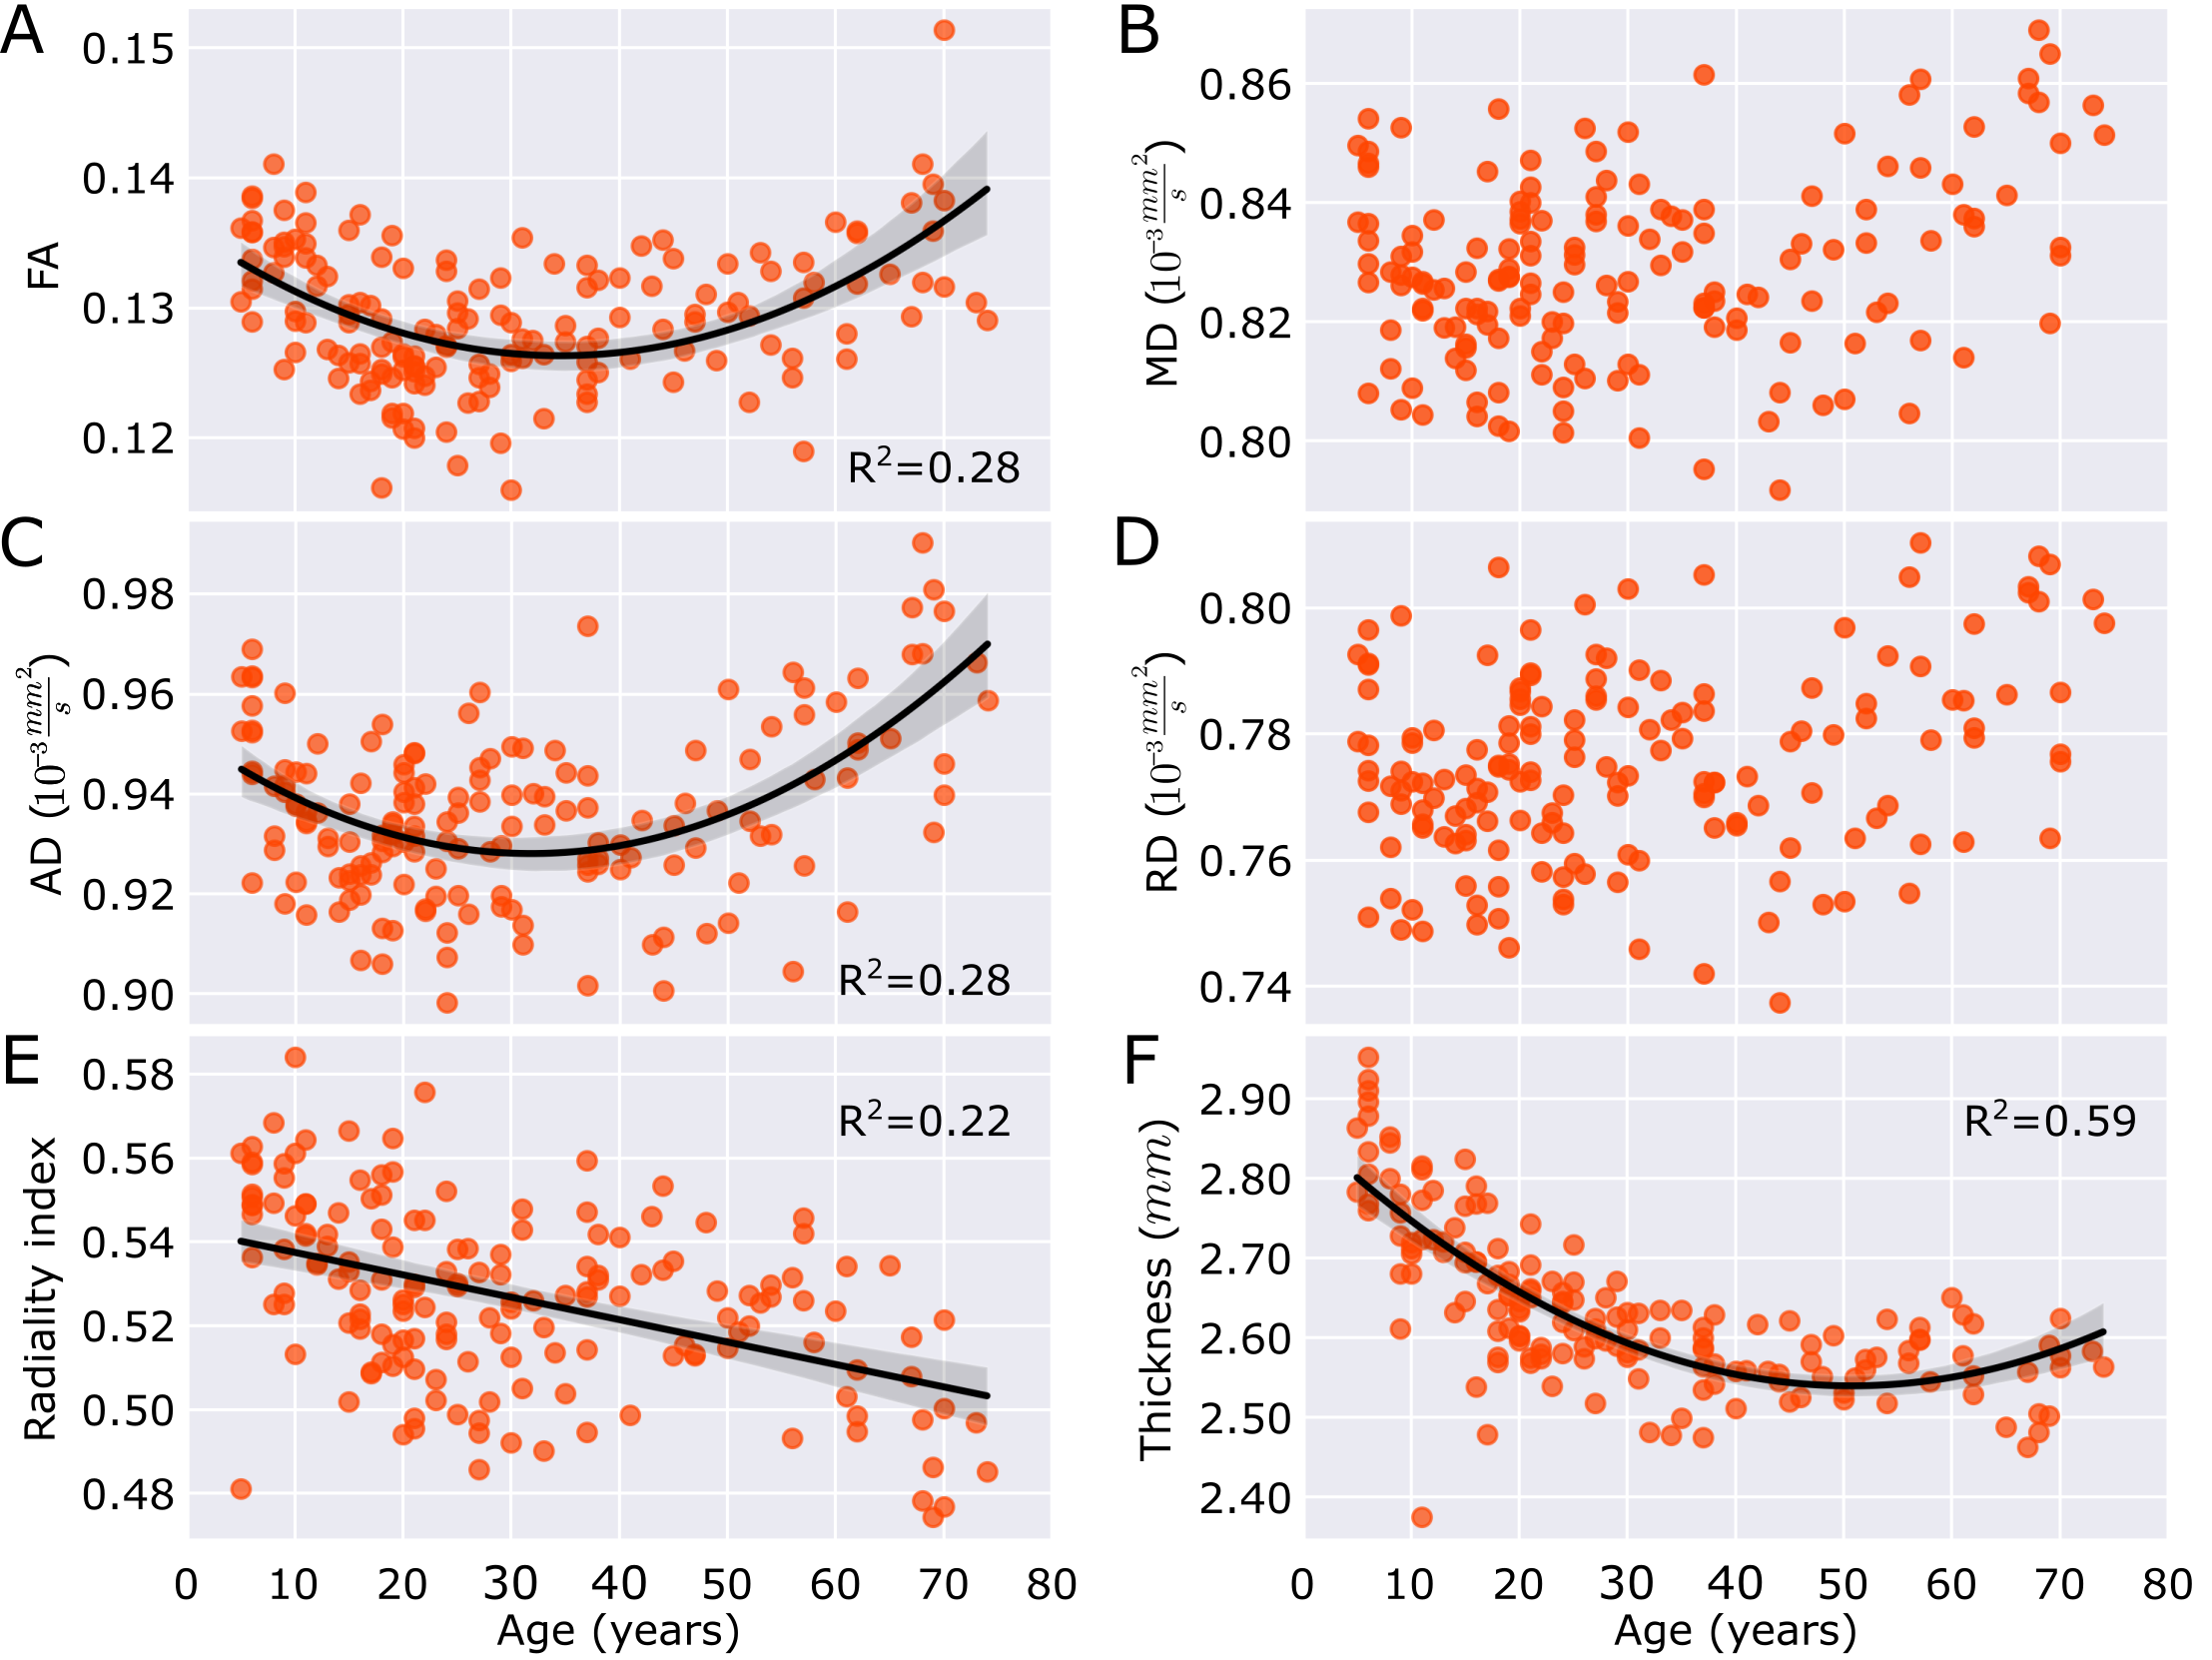
Figure 2. Average (A-E) diffusion metrics and (F) thickness over the total cortex across the lifespan (n=165, 5 to 74 years). The DTI metrics show different patterns than thickness which decreases then mainly levels off. FA and AD are lower in the mid-30s and then are greater at older ages with a steeper slope. MD and RD do not show an age dependency. Radiality index decreases linearly.
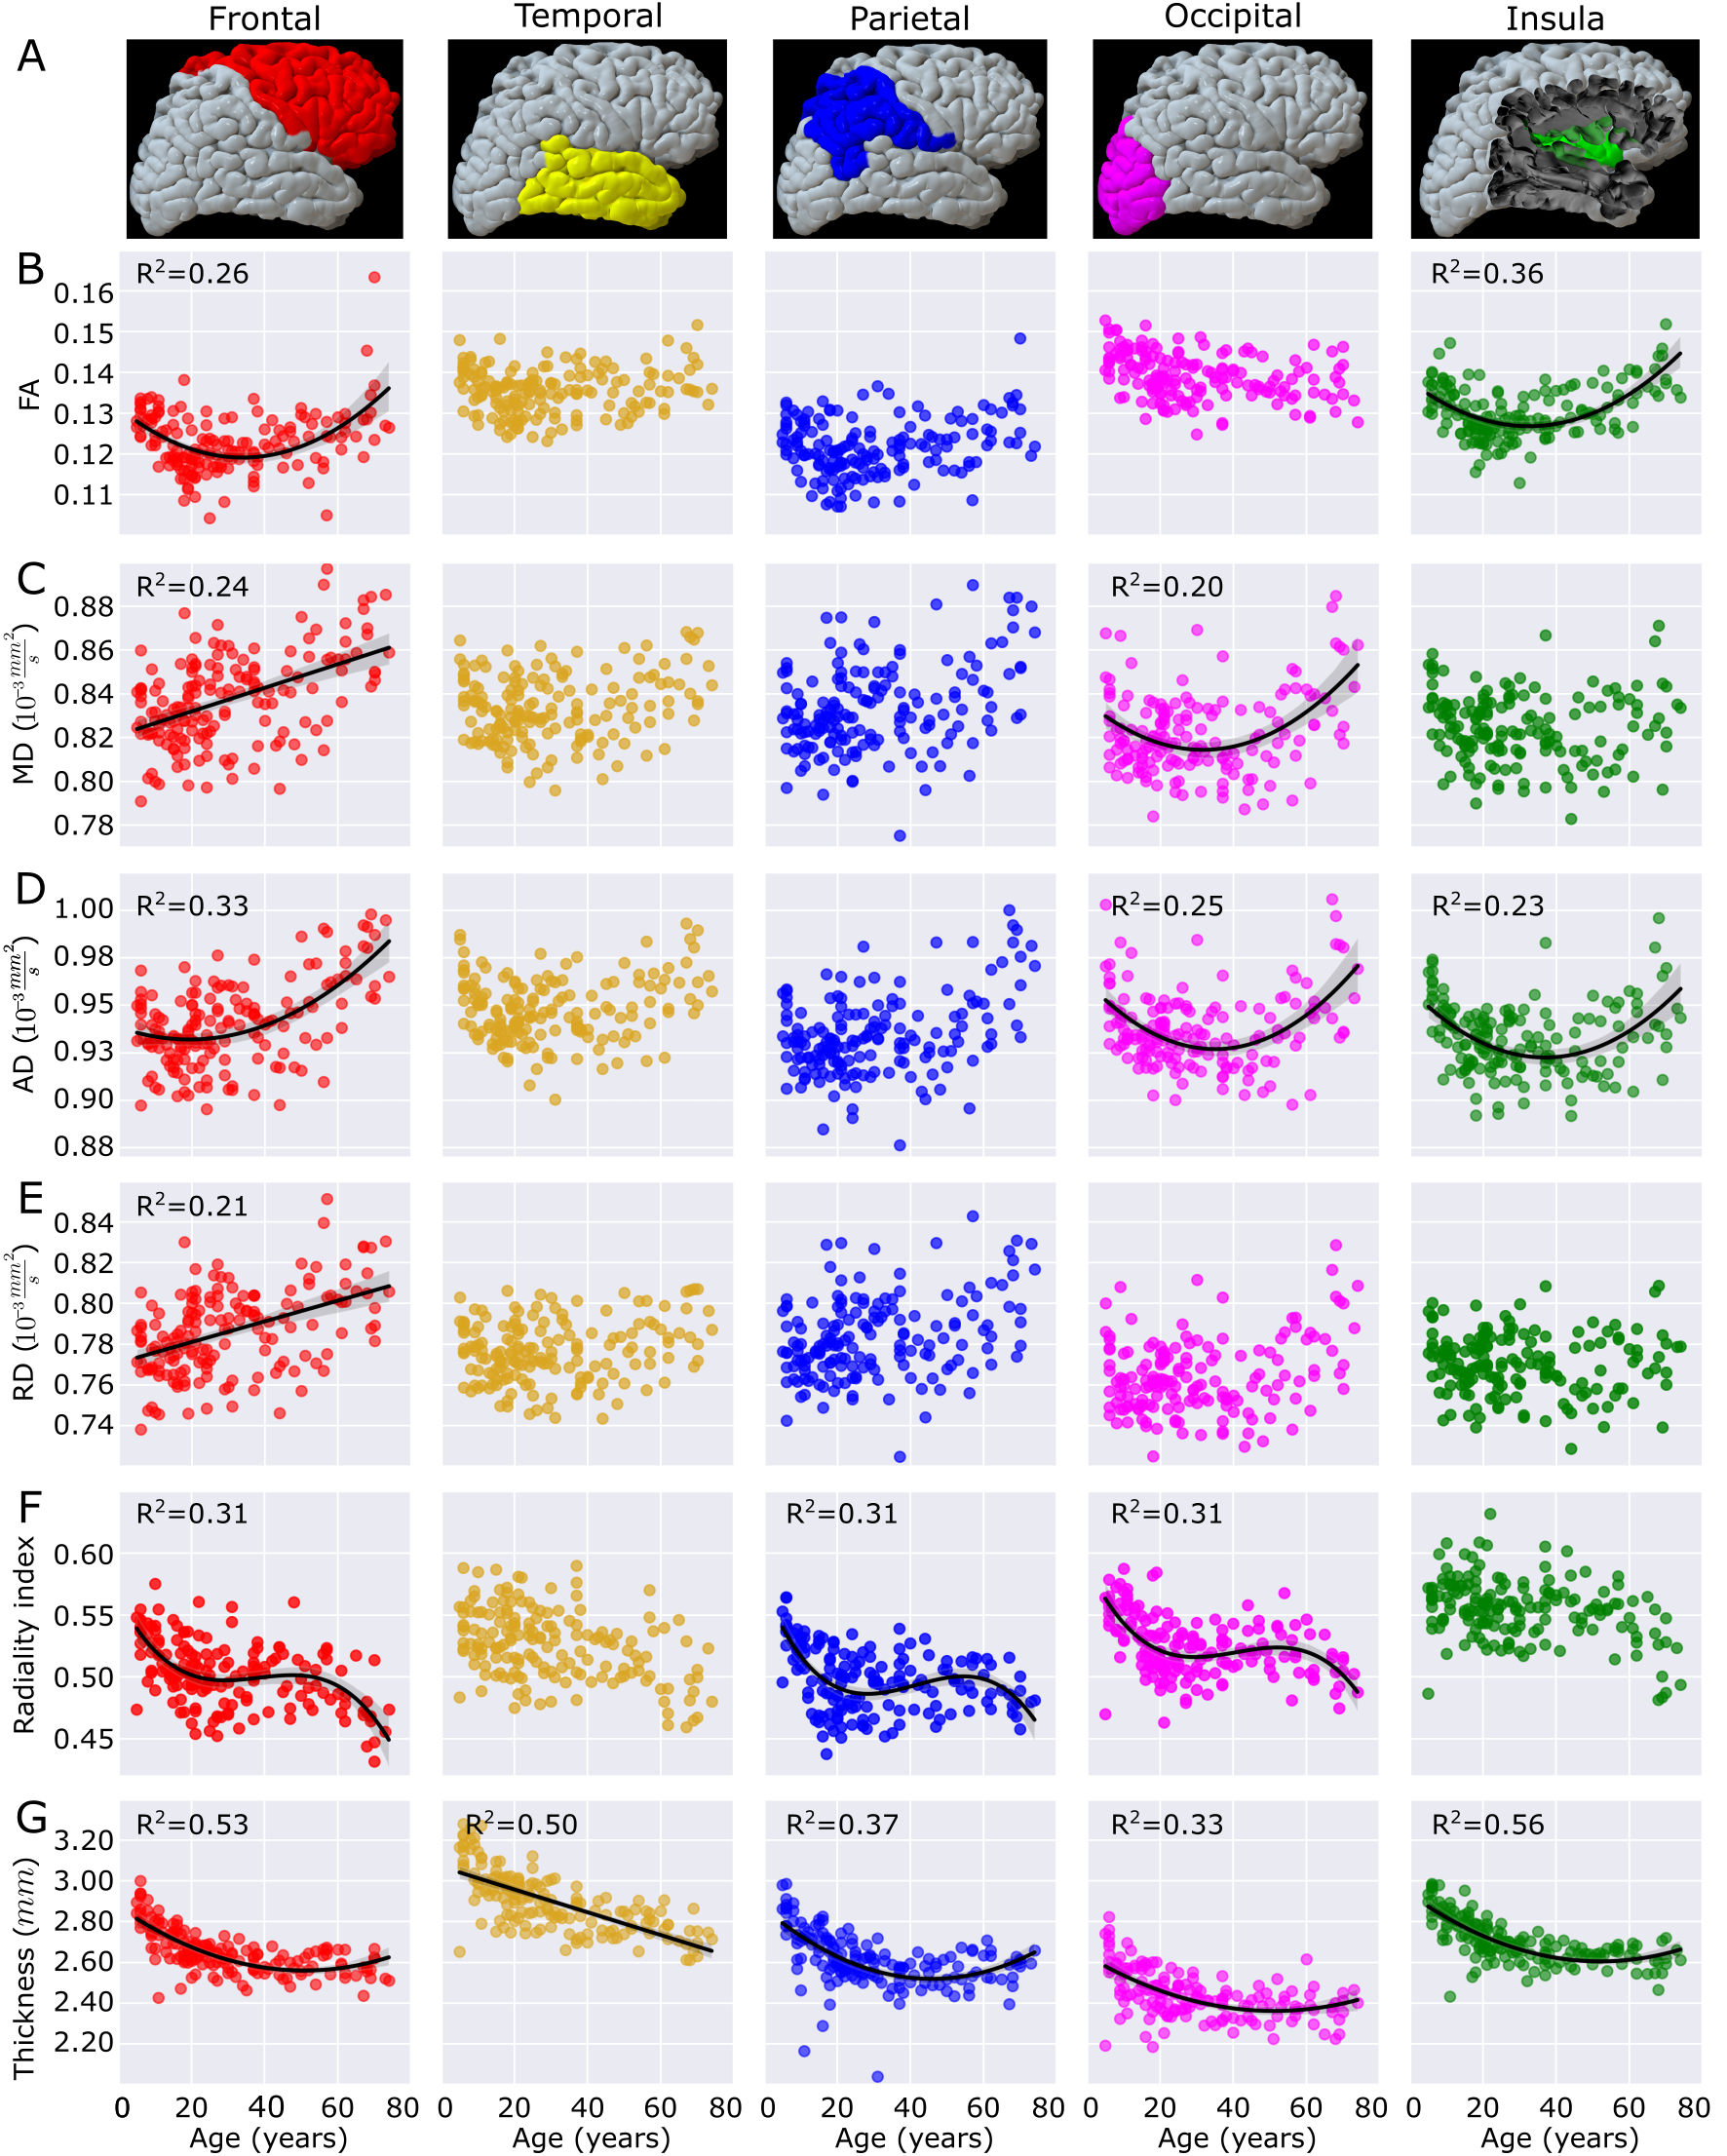
Figure 3. Regional cortical segmentation example (A) and metrics (B-G) in the five lobes (averaged left and right) with best fits versus age across the lifespan (n=165, 5 to 74 years). Cortical thickness is reduced in all lobes with age, but the diffusion parameters show different trajectories. The frontal lobe shows age changes for all diffusion parameters. AD and radiality show age relationships in 3/5 lobes.
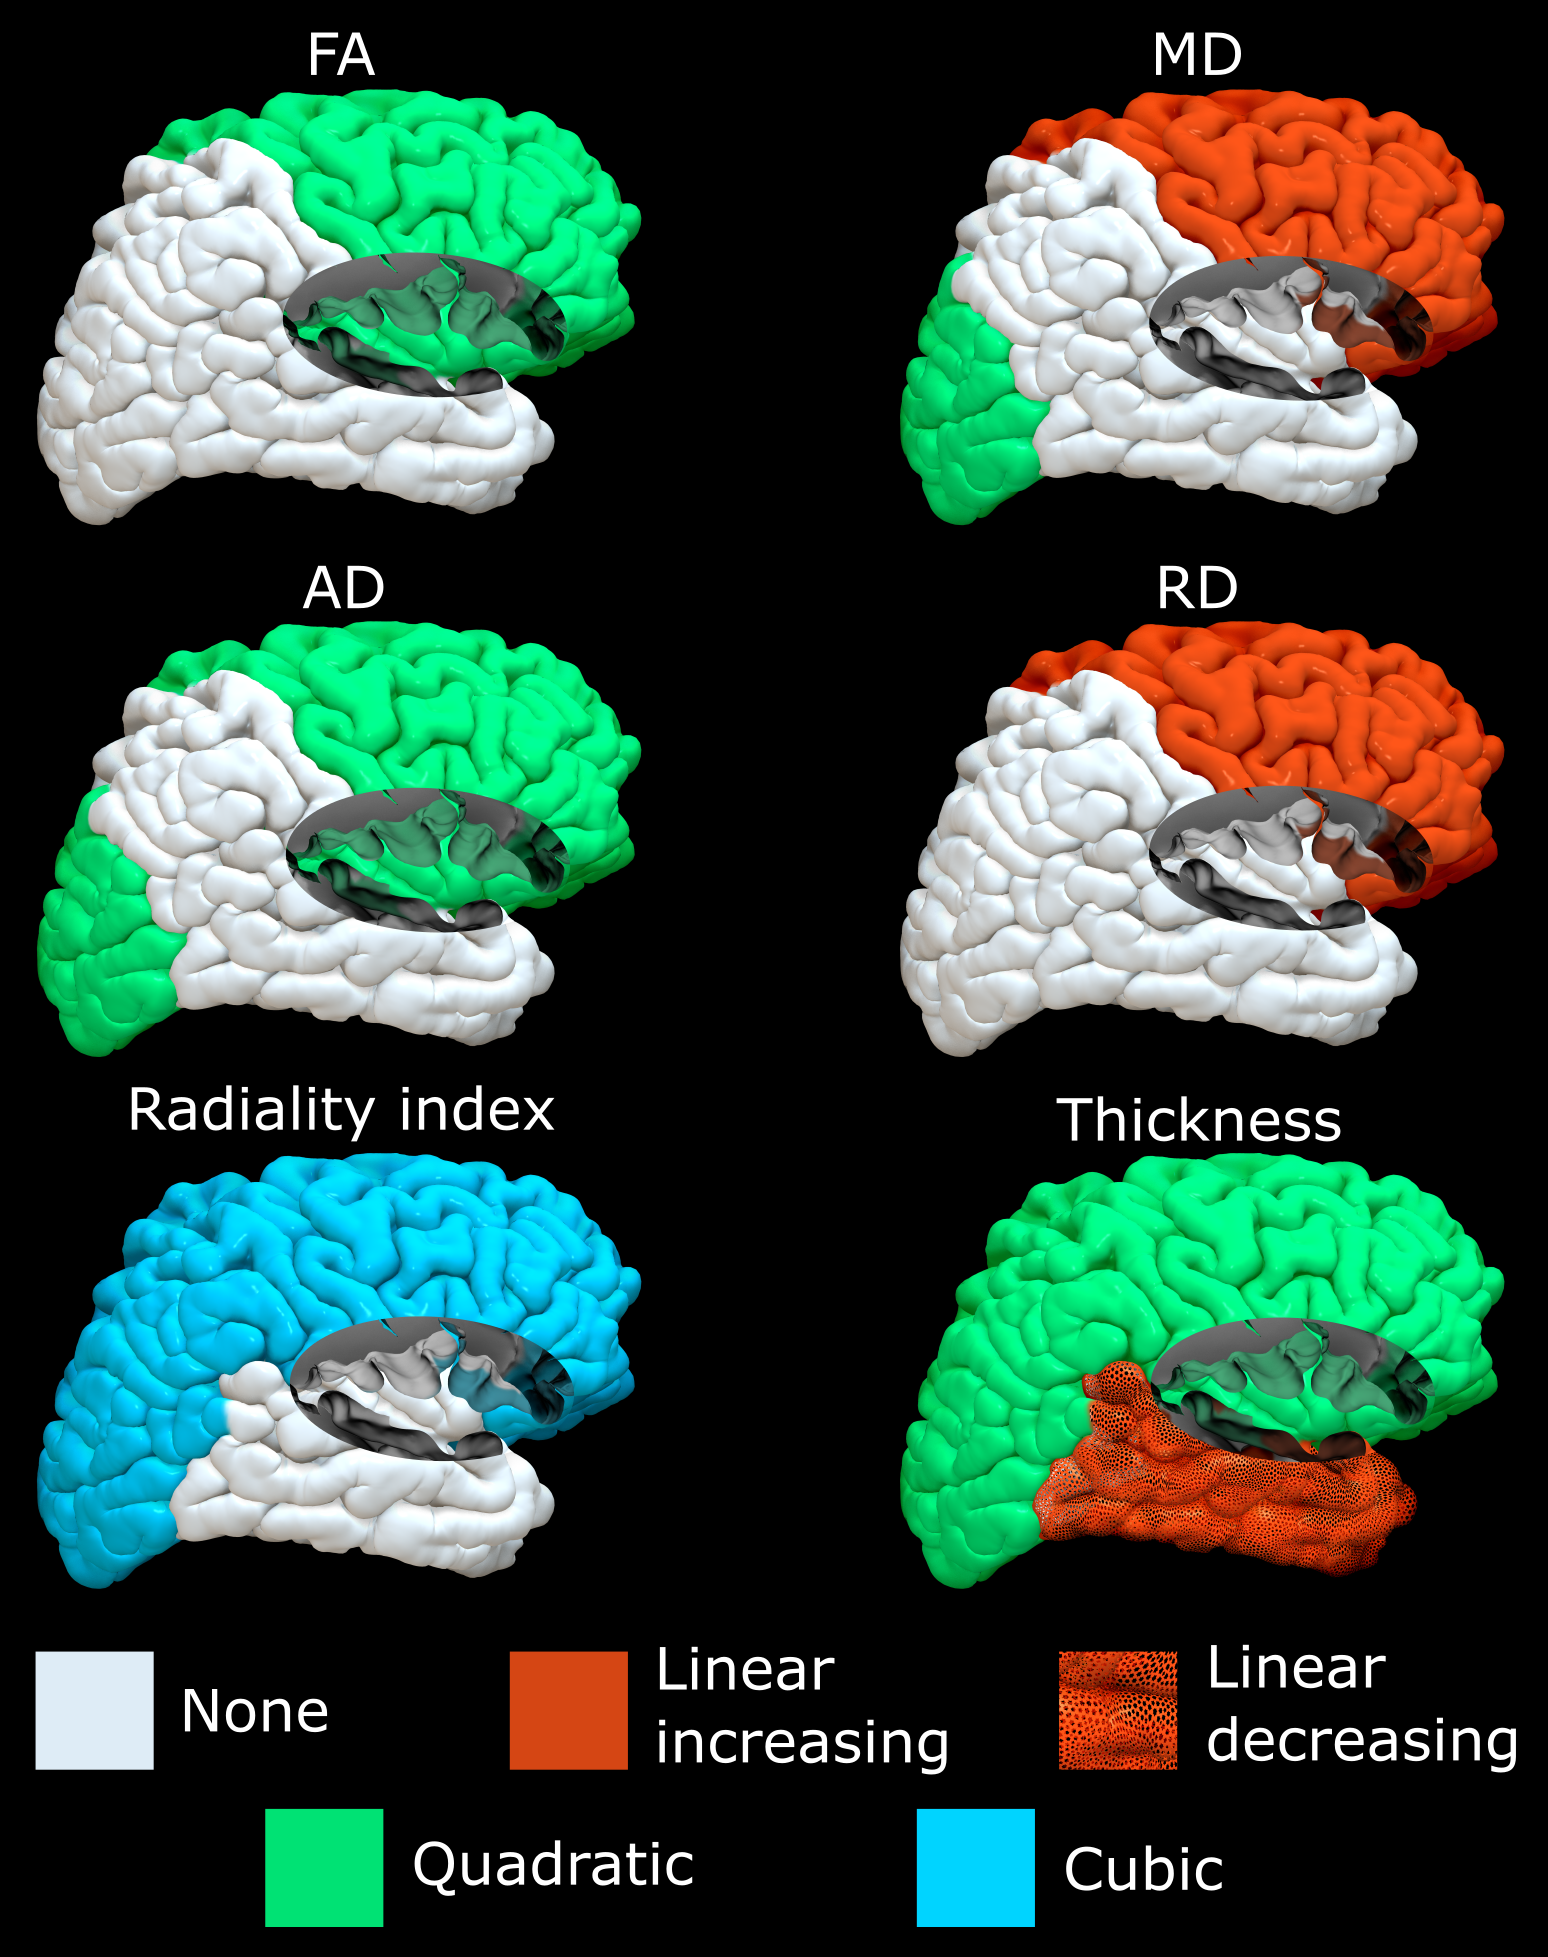
Figure 4. These hemispheric models summarize the significant trends of the cortical metrics found across the lifespan in each lobe (combining both hemispheres). All quadratic models are U-shaped, and cubic models start with a downward trend. The frontal lobe cortex has age-related changes for all six metrics.