3346
Multimodal structural and functional features underlying cognitive function in first-episode major depressive disorder1Department of Radiology, West China Hospital of Sichuan University, Huaxi MR Research Center, Chengdu, China
Synopsis
Keywords: Psychiatric Disorders, Brain, major depressive disorder
Multimodal joint differences in the right dorsal lateral prefrontal cortex, bilateral superior and inferior parietal lobules, and bilateral calcarine cortex contributed to identification of patients with major depressive disorder (MDD), offering promise in the multimodal psychoradiological characterization for MDD diagnosis. In addition, widespread gray matter alterations across neocortex were associated with cognitive impairments, and partially mediated the age-related cognitive difficulties associated with MDD, deepening the understanding of the relationships between brain alterations and neurocognitive changes in MDD.Introduction
Identifying neuroimaging biomarkers related to major depressive disorder (MDD) diagnosis is an active area of MDD research. Neuroimaging studies have demonstrated widespread abnormalities in brain structure and function in MDD 1. However, most of the previous studies focused on only 1 specific modality 2, and thus the relationship between these isolated structural and functional alterations in MDD individuals remains poorly understood. Multivariate data fusion methods offered an advantageous approach to examine multimodal data in an integrated way, further advancing efforts to understand and guide the diagnosis of MDD 3.Method
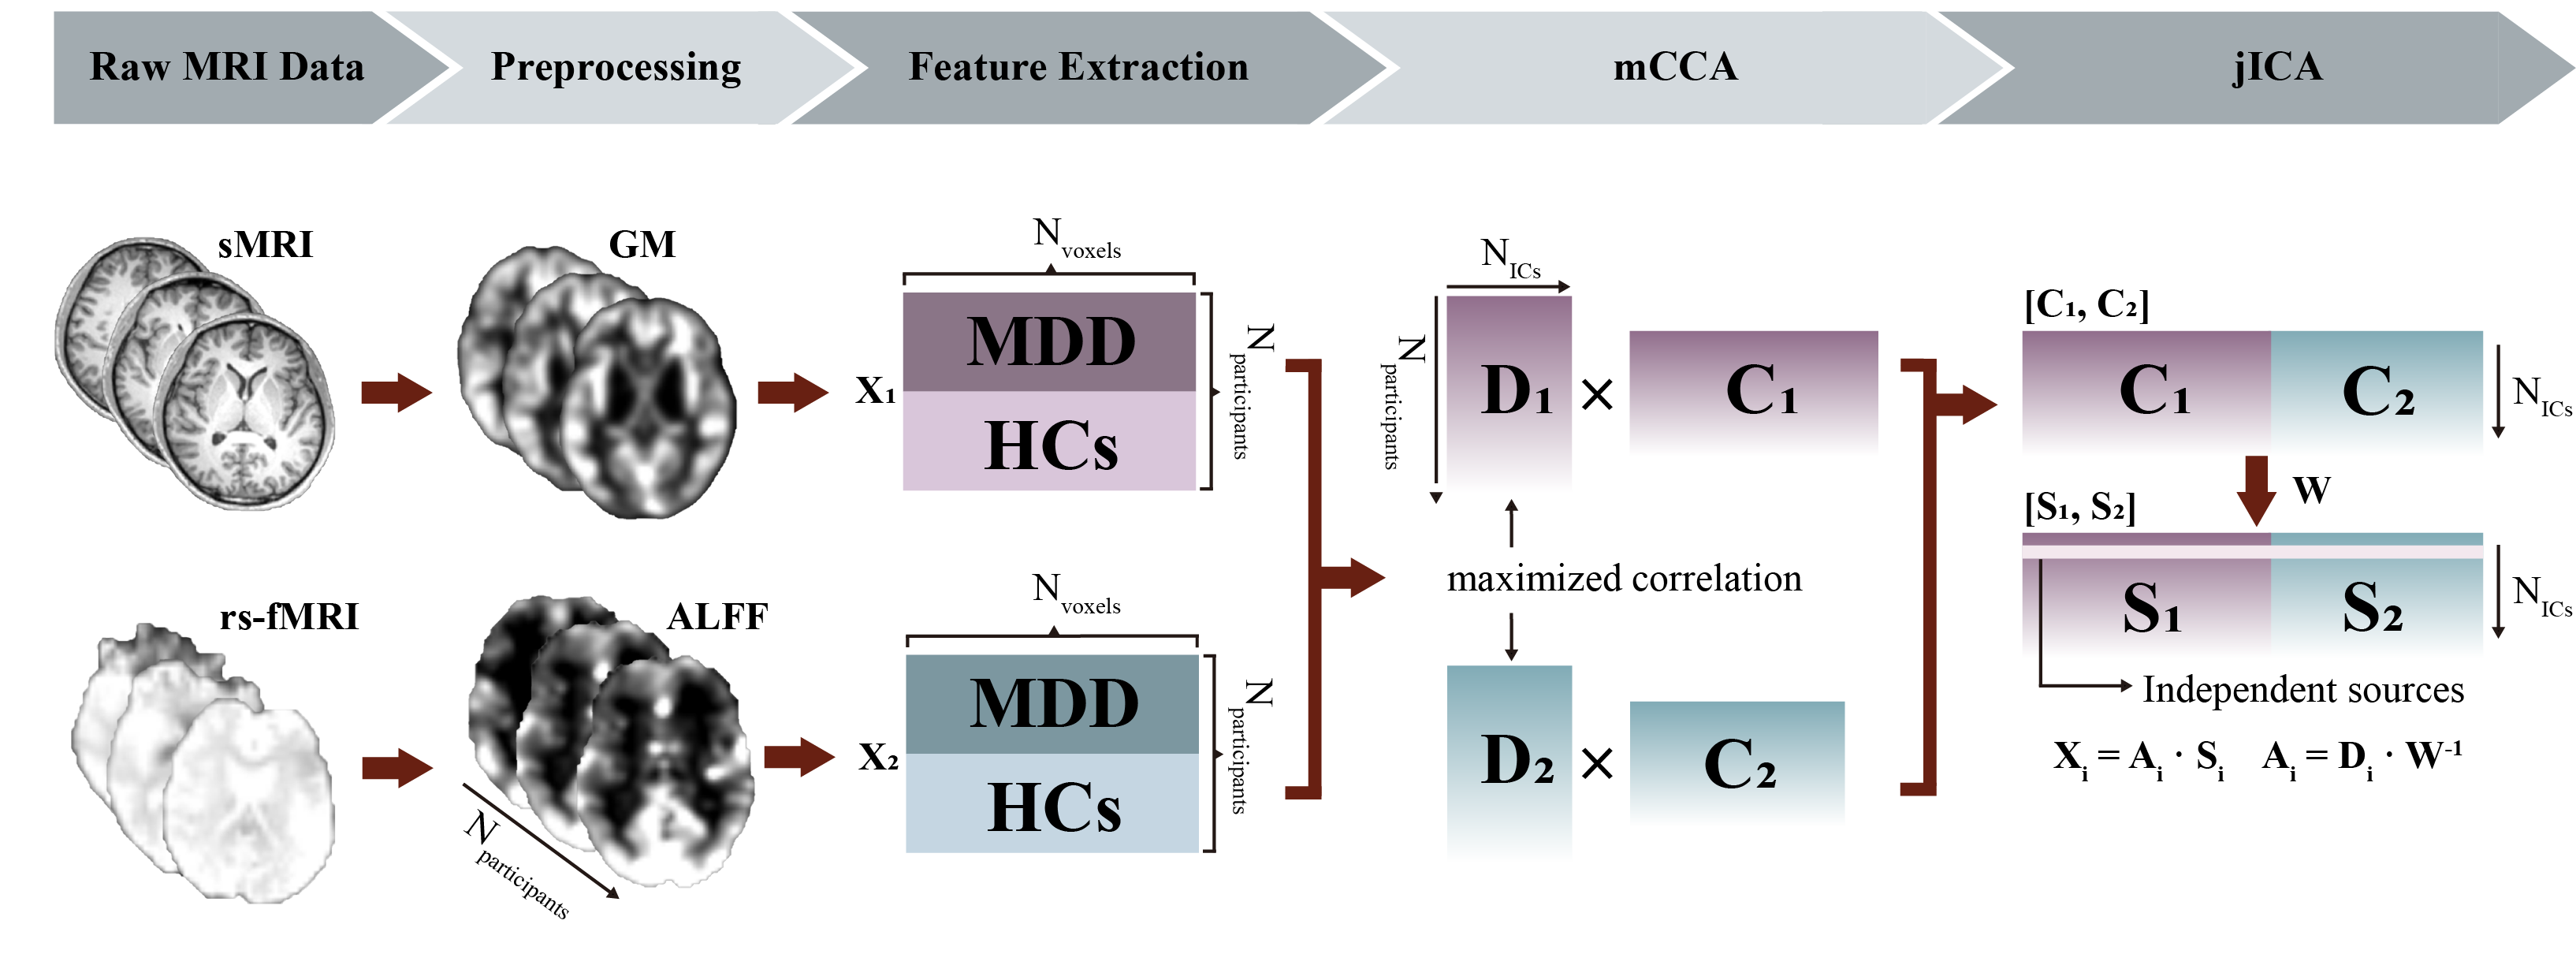
Multiset canonical correlation and joint independent component analysis (mCCA+jICA) 4 was utilized to fuse gray matter (GM) and amplitude of frequency fluctuations (ALFF) features of first-episode medication-naïve MDD patients (N=43) and healthy controls (HCs, N=43) (Figure 1). Joint independent components (ICs) showing significant between-group differences in both modalities were defined as modality-shared discriminative ICs, otherwise, they were considered modality-specific discriminative ICs that differentiated groups in a single modality. Correlation and mediation analyses were conducted to assess the associations between multimodal imaging features, clinical ratings, and cognitive test performance.Result
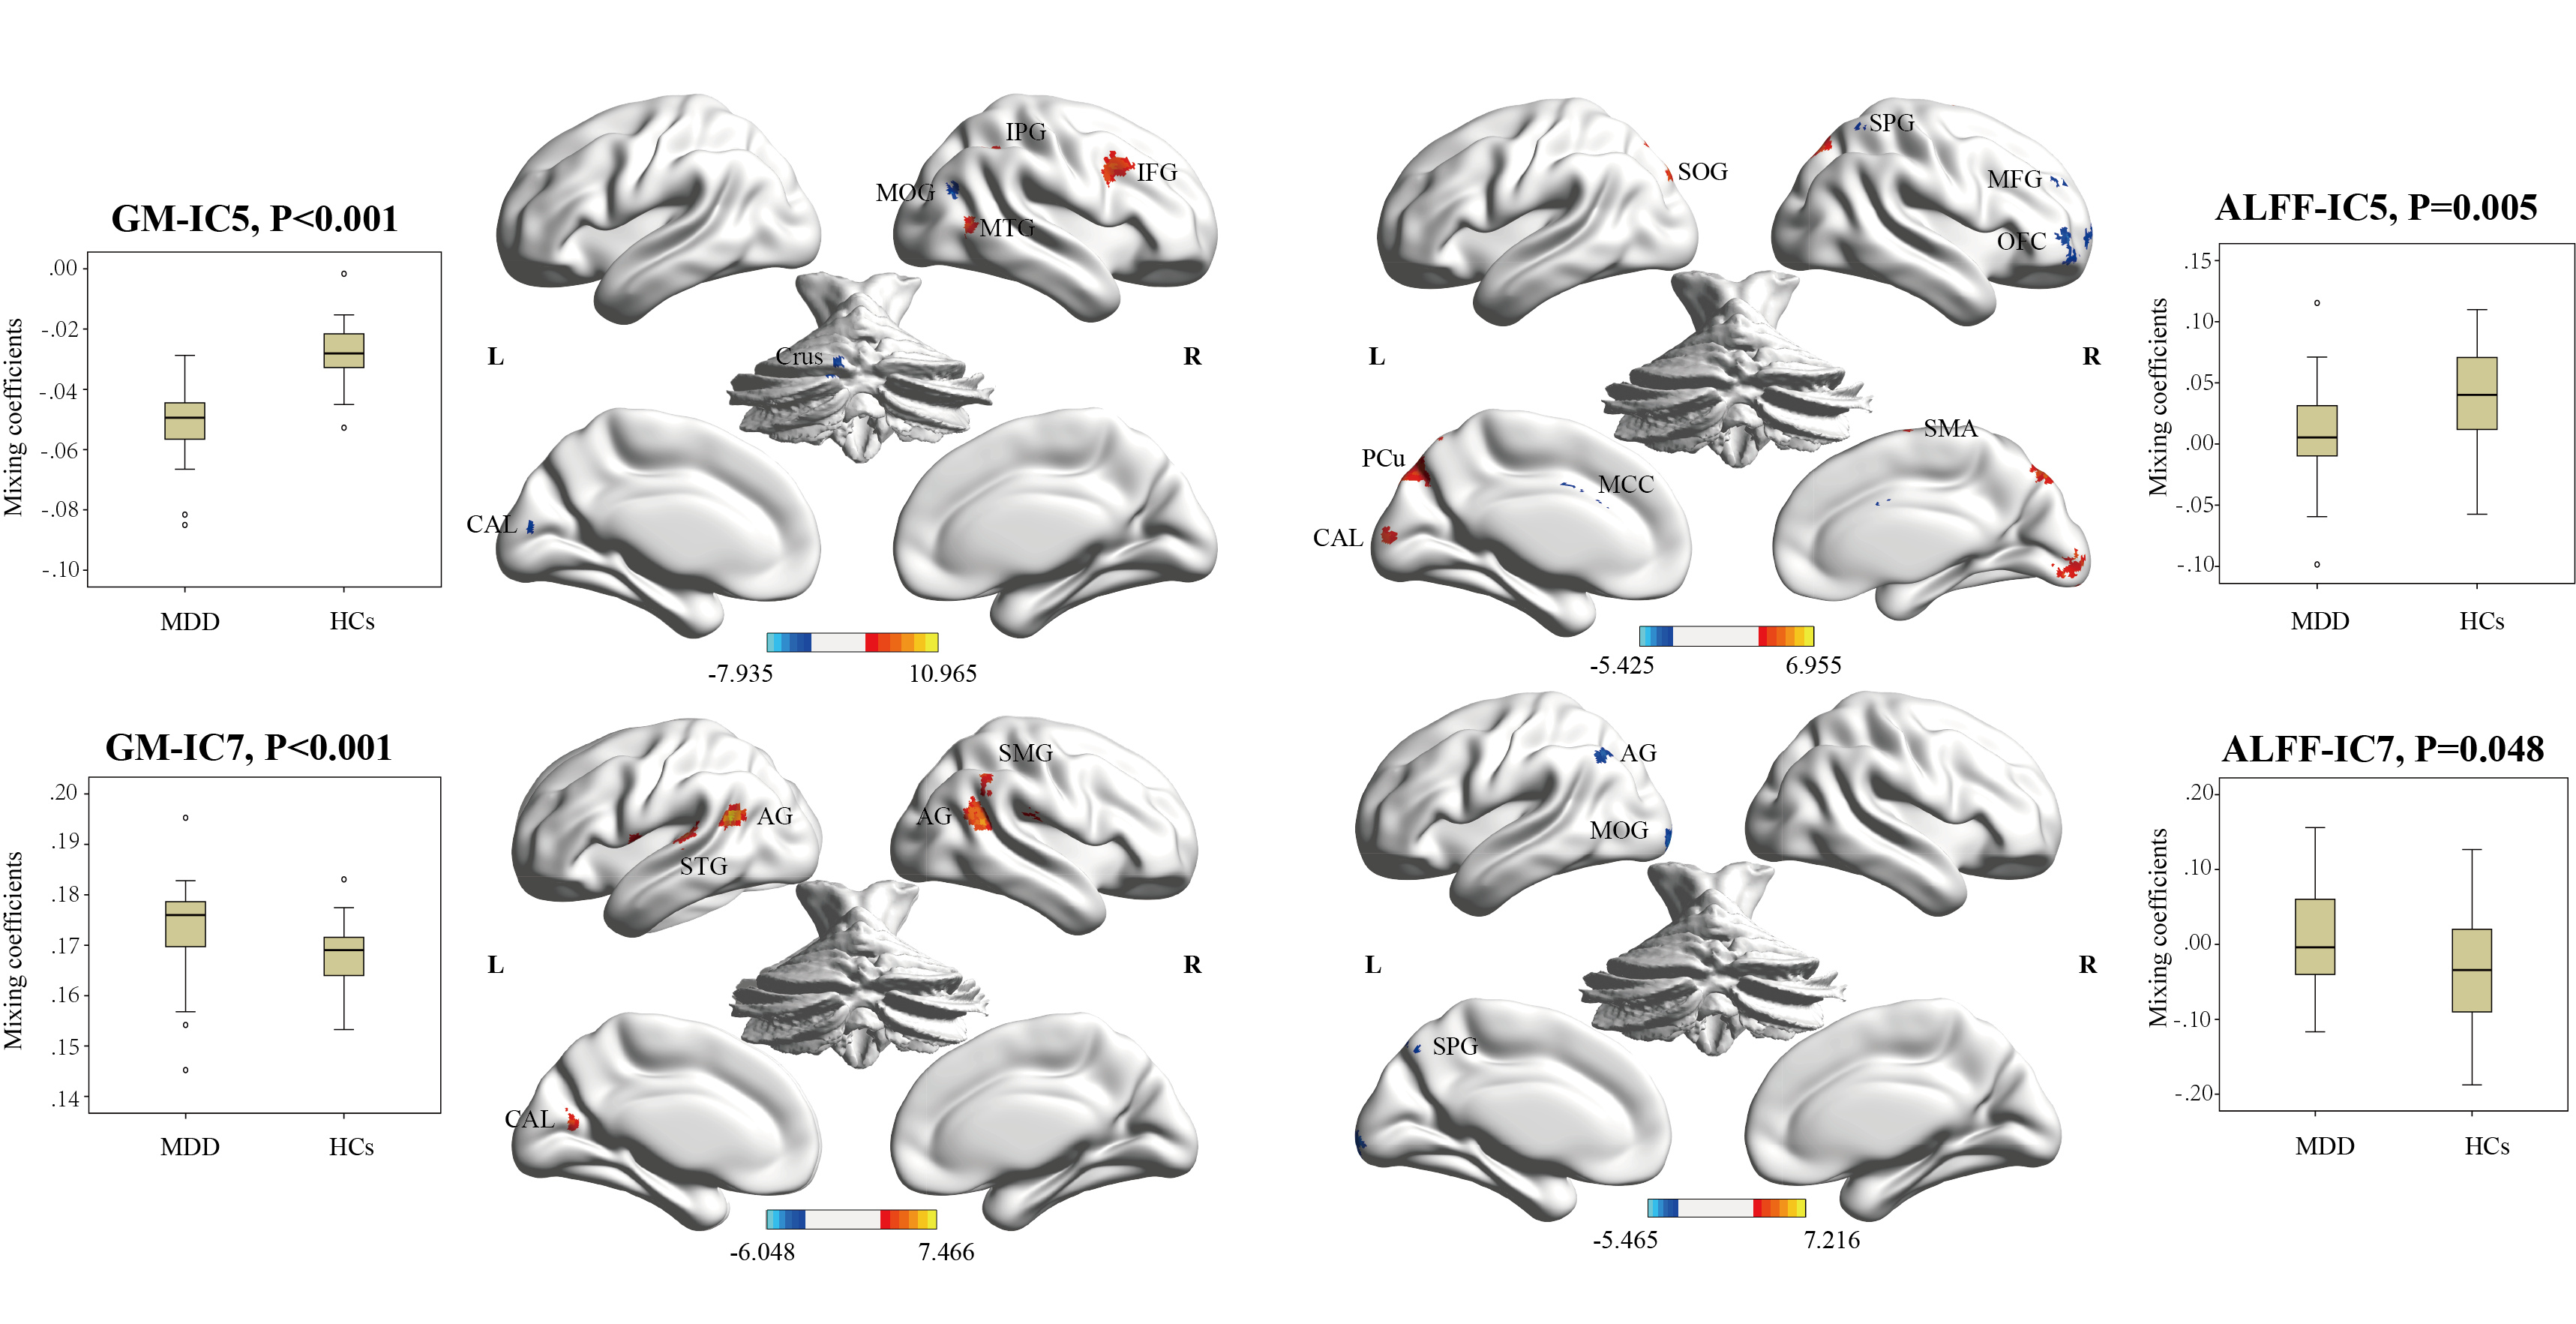
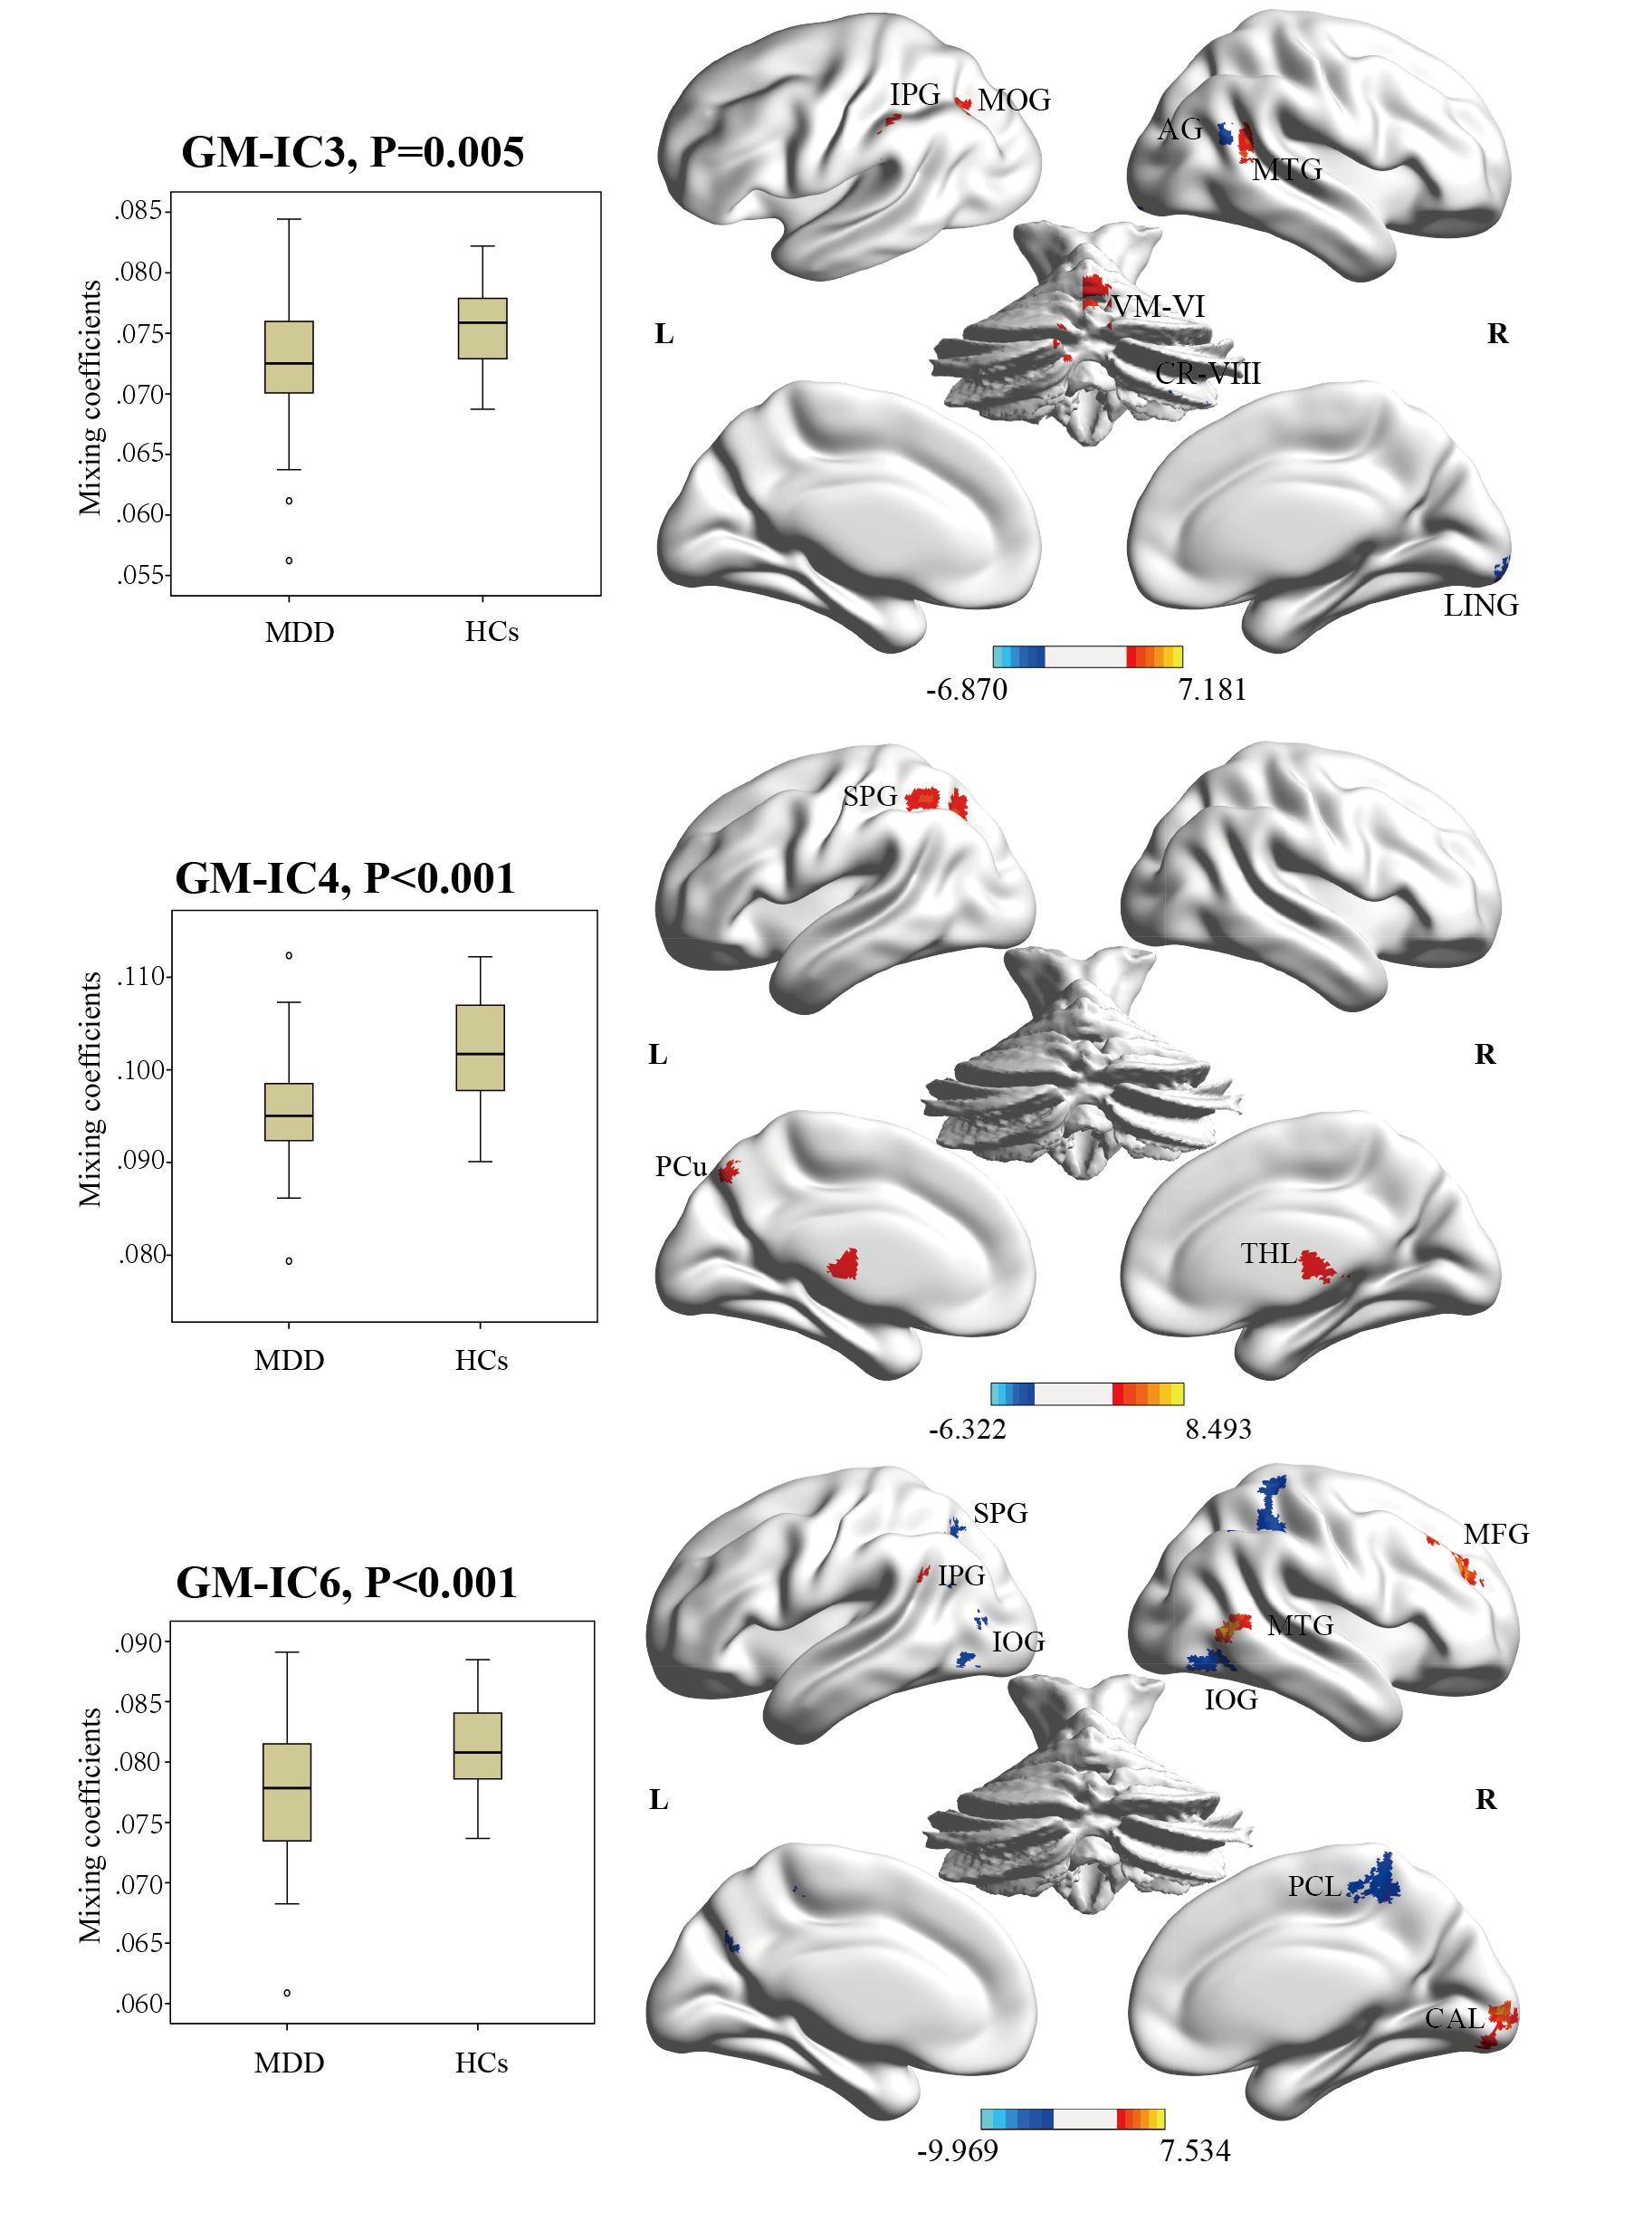
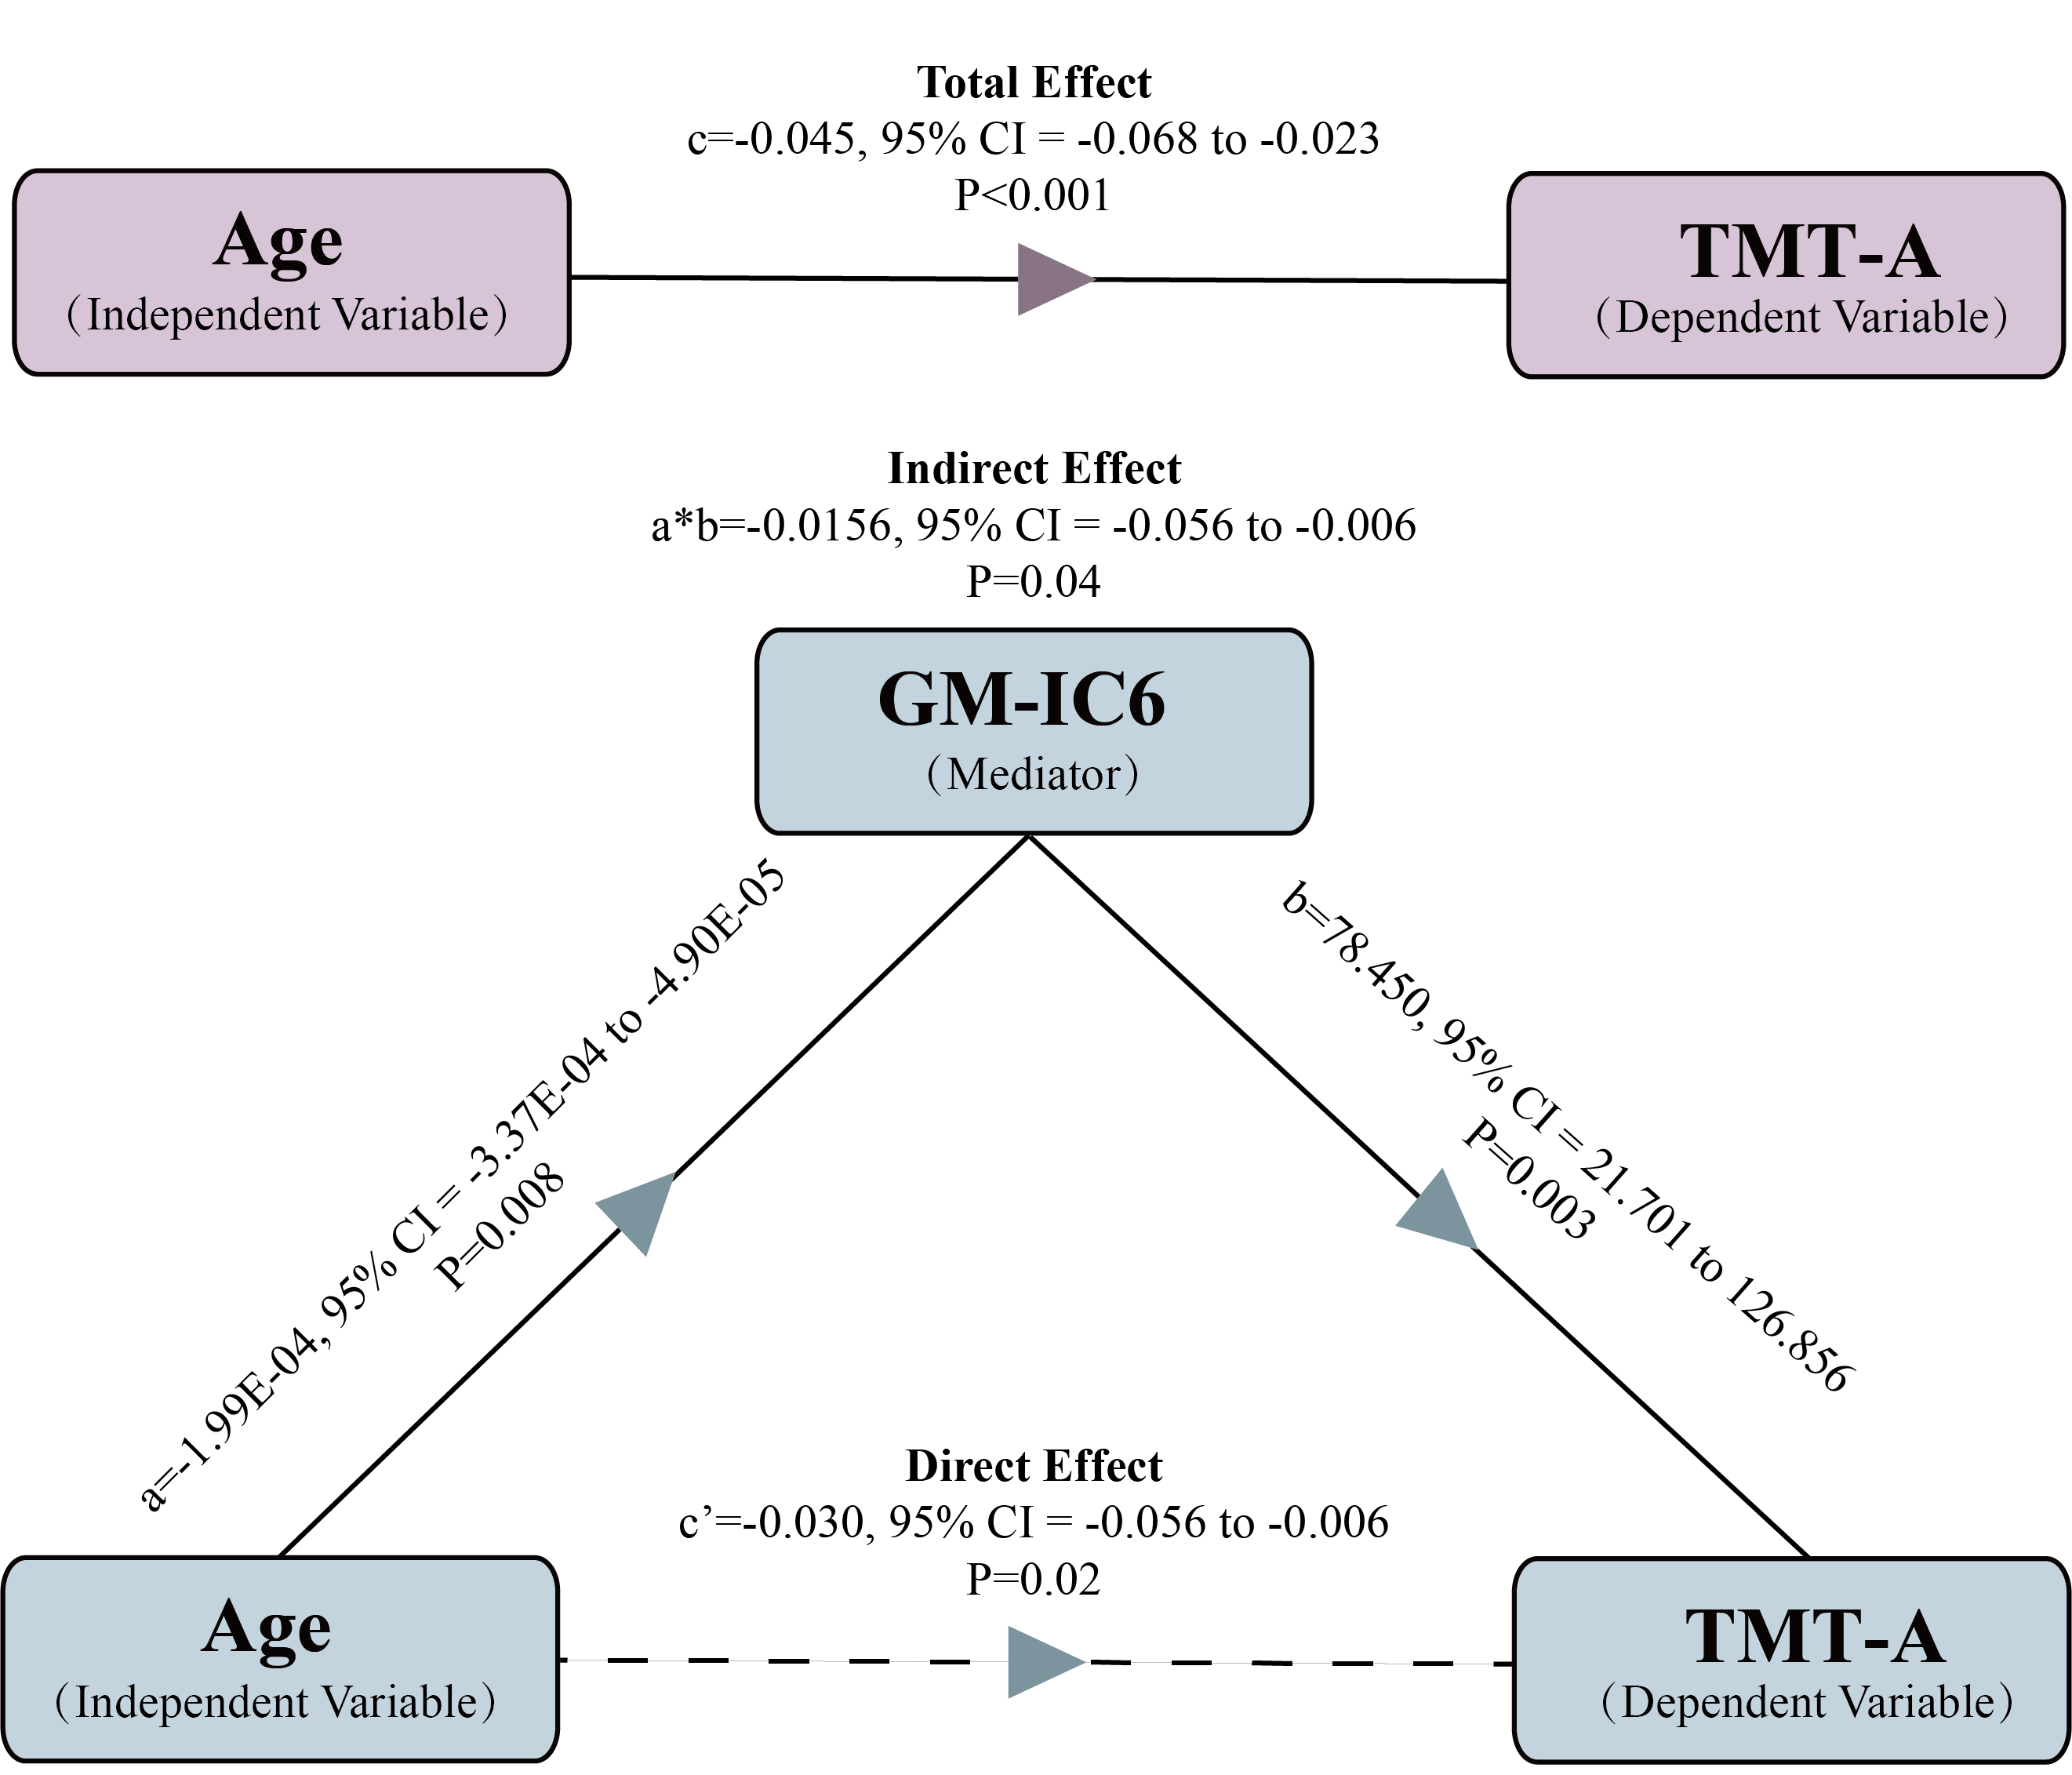
We identified 2 pairs of joint modality-shared ICs in both GM and ALFF (Figure 2) and 3 modality-specific ICs in GM (Figure 3) that significantly differentiated MDD patients from HCs. The covariant differences in GM and ALFF were primarily in right dorsal lateral prefrontal cortex, bilateral superior and inferior parietal lobules, and bilateral calcarine cortex. Significant interrelations between GM alterations in these regions and age-related cognitive performance on tests of attention and executive functioning were also observed (Figure 4), with GM alterations acting as a partial mediating factor (Figure 5).Discussion
Joint structural and functional alterations in the right dorsal lateral prefrontal cortex, bilateral superior and inferior parietal lobules, and bilateral calcarine cortex in MDD relative to HCs presented multimodal psychoradiological characterization for MDD identification. Consistent with previous findings 5,6, the significant correlation and mediation results further added that age influences aspects of cognitive functioning through the widespread GM alterations as a mediating factor, which may serve as potential therapeutic neurobiomarkers for prevention and prognosis of age-related cognitive decline in MDD.Conclusion
Structural-functional covariation mainly in the frontal, parietal, and occipital regions may assist in MDD identification and underpin age-related cognitive impairments in MDD. These findings add to the understanding of the multimodal brain alterations in depression, and provide evidence to its associations with age-related neurocognitive changes. Future studies may benefit from integrating data across more modalities, including topological, biochemical, metabolic, and genetic data to elucidate the neurophysiological mechanisms underlying the structural-functional interrelationships identified in the present study.Acknowledgements
This study was supported by the National Natural Science Foundation of China (Grant Nos. 81621003(Gong) and 82001795 (Zhao)), Sichuan Science and Technology Program (Grant No. 2022YFS0069 (Zhao)).References
1. Brandl F, Weise B, Mulej Bratec S, et al. Common and specific large-scale brain changes in major depressive disorder, anxiety disorders, and chronic pain: a transdiagnostic multimodal meta-analysis of structural and functional MRI studies. Neuropsychopharmacology. 2022;47(5):1071-1080.
2. Cattarinussi G, Delvecchio G, Maggioni E, Bressi C, Brambilla P. Ultra-high field imaging in Major Depressive Disorder: a review of structural and functional studies. J Affect Disord. 2021;290:65-73.
3. Sui J, He H, Yu Q, et al. Combination of Resting State fMRI, DTI, and sMRI Data to Discriminate Schizophrenia by N-way MCCA + jICA. Front Hum Neurosci. 2013;7:235.
4. Sui J, He H, Pearlson GD, et al. Three-way (N-way) fusion of brain imaging data based on mCCA+jICA and its application to discriminating schizophrenia. Neuroimage. 2013;66:119-132.
5. Salthouse TA. Neuroanatomical substrates of age-related cognitive decline. Psychol Bull. 2011;137(5):753-784.
6. Deary IJ, Corley J, Gow AJ, et al. Age-associated cognitive decline. British Medical Bulletin. 2009;92(1):135-152.
Figures