3341
Older Brain Age Prediction Using Functional Brain Network Efficiency Linked to Early Disorder Onset among Depression and Epilepsy Patients1Icahn School of Medicine at Mount Sinai, New York, NY, United States
Synopsis
Keywords: Brain Connectivity, Aging
Brain network organization, and specifically its efficiency, is known to be associated with age, implying older brain exhibit reduced network efficiency. Using resting-state functional magnetic resonance imaging, we investigate if estimated brain age according to functional network efficiency is deviant from chronological age in major depressive disorder (MDD) and Epilepsy patients (EP). Global network efficiency significantly predicted chronological age among HC. Importantly, we found the differences between predicted and true brain age among MDD and EP patients were significantly associated with age at onset, indicating that the prediction of an older age brain is associated with early age disorder onset.INTRODUCTION
Normal aging is known to alter brain structure and function in multiple ways detectable through neuroimaging1,2. Accelerated biological aging has been hypothesized as a mechanism underlying the clinical and cognitive deterioration of several brain pathologies such as epilepsy3 and depression4. Previous studies have also suggested that these brain morphological aging effects may also be dependent on disease duration4. Therefore, there is a need for identifying brain aging patterns in patients with brain pathologies to determine whether and how they differ from healthy normal patterns of aging. The mathematical field of graph theory provides a powerful toolset for characterizing the brain connectome (comprehensive map of neural connections). Global network efficiency, for example, offers a measure of the overall ability of the system for parallel information flow and integrated processing among distributed regions5. Using graph theory methods, previous studies have shown that brain network topological organization, and specifically its efficiency, is associated with age, implying older brains exhibit reduced brain network efficiency6,7.Using resting-state functional magnetic resonance imaging (rsfMRI), we investigate if estimated brain age according to functional brain network efficiency among people with major depressive disorder (MDD) and Epilepsy patients (EP) is deviant from normal aging in healthy volunteers.METHODS
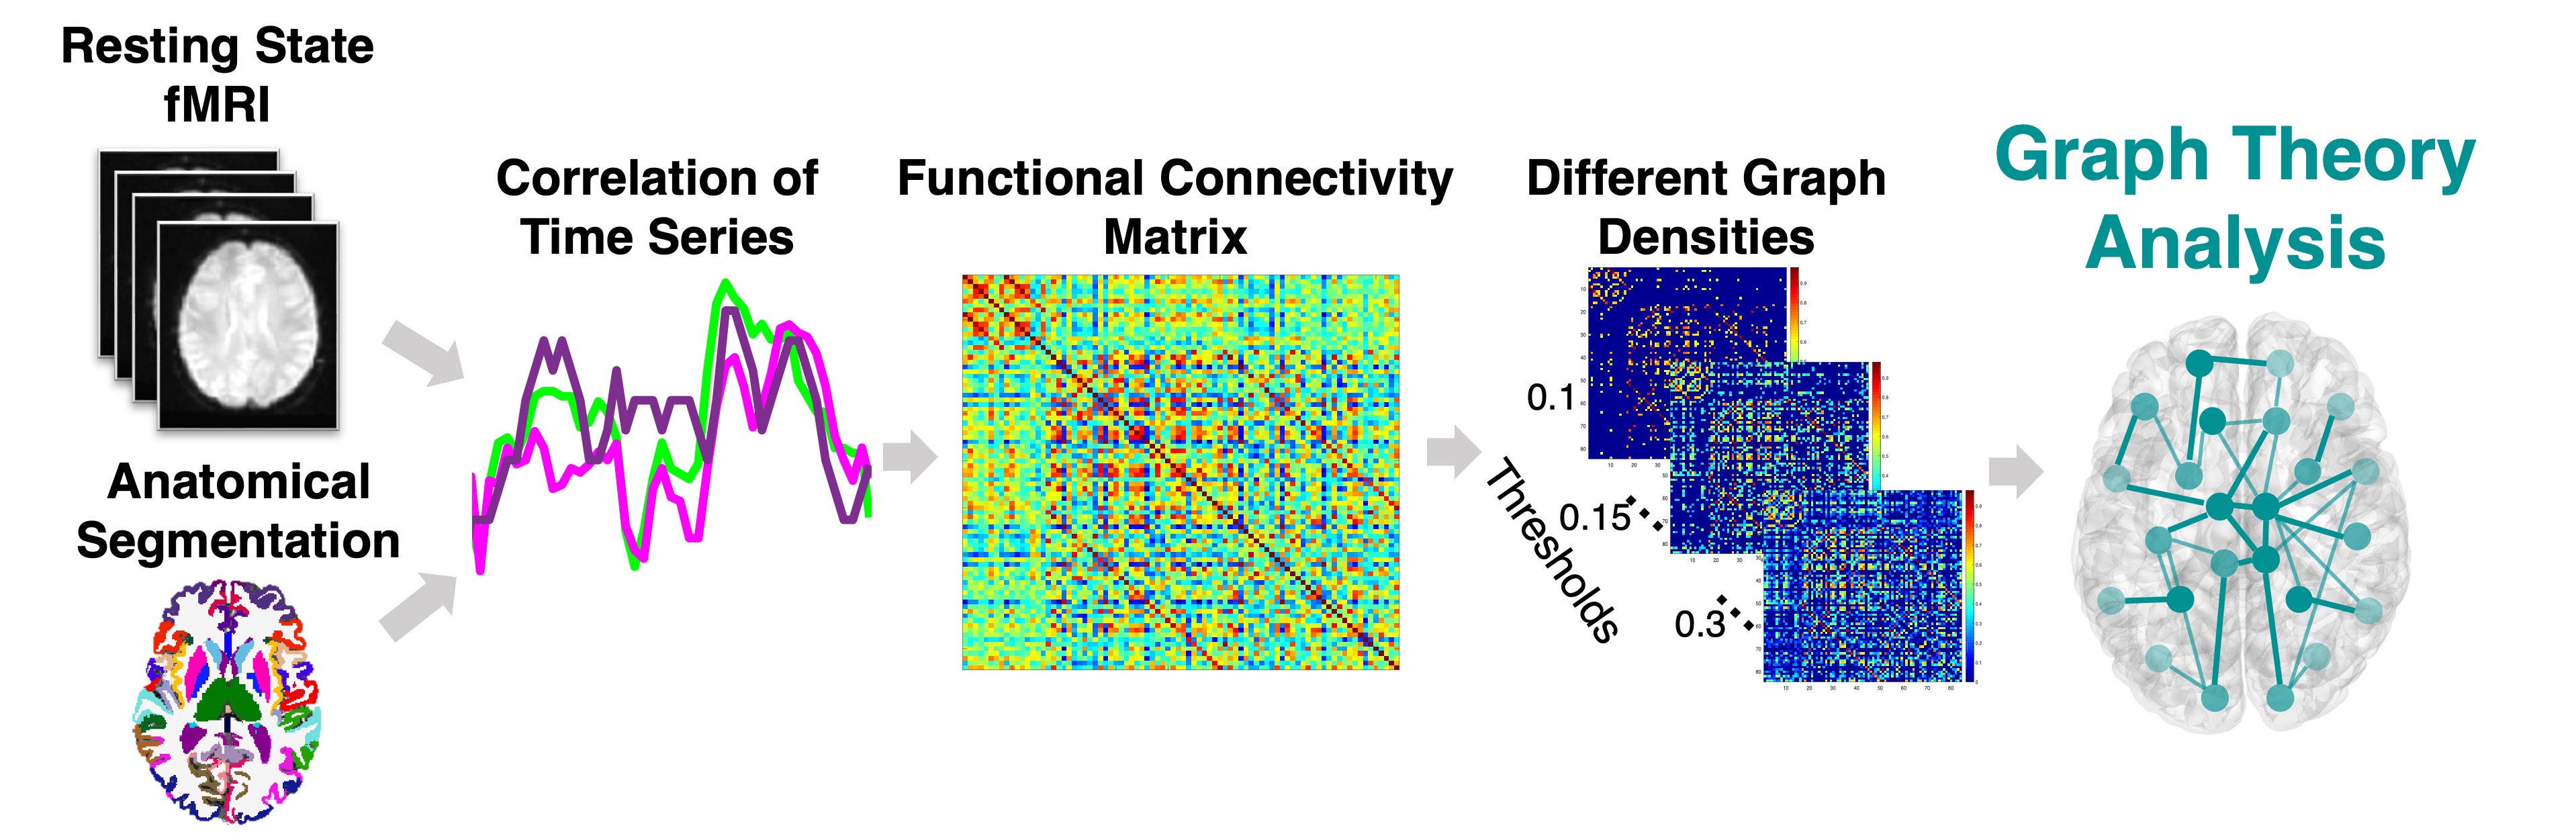
Data were acquired on a Siemens Magnetom 7T MRI scanner (Erlangen, Germany). 36 healthy controls (HC), 29 MDD and 27 EP patients underwent resting state fMRI (10 minutes multi-echo multi-band time course EPI with 2.5mm isotropic resolution, 50 slices, TR/TE’s = 1850/8.5, 23.17, 37.84, 52.51, MB = 2, iPAT acceleration factor= 3, flip angle= 70, field of view = 640 x 640). Functional images were preprocessed using the multi-echo independent component analysis implemented in AFNI8.Each subject’s anatomical T1-weighted image was segmented into Desikan-Killiany Atlas9 using FreeSurfer v.6.0 and co-registered into the fMRI space to construct the functional connectome. Each of the segmented 82 regions of interest (ROIs) represents a node in the graph. The functional connectome edges (links) are defined by the partial correlation coefficients between the mean time series of all pairwise ROIs and normalized using Fisher r-to-Z transformation10 (Figure 1). To ensure that the number of nodes and connections are matched across participants, we used a sparsity threshold S, which retains S% of the top connections for each subject11 (Figure 1). Next, Using the Brain Connectivity Toolbox12, we examined a common global network property of global efficiency (Eglob), which is the average inverse shortest path length (minimum number of edges that must be traversed to go from one node to another) in the network. For example, random networks exhibit high global efficiency, whereas ordered regular lattice networks exhibit low global efficiency. We examined the Eglob across a range of thresholds (10% < S < 30% in steps of 1%)11. We then calculated the area under the curve for Eglob, which provides a summarized measure independent of single threshold selection11. A linear regression model was then applied using the HC Eglob to predict age controlling for gender. The same model was subsequently used to predict the MDD and EP patients' age. Brain-predicted ages differences (brain-PAD) were defined as the predicted age minus the chronological age. Between-group t-test were conducted to examine brain-PAD differences between the groups. Linear regression analysis was conducted to assess the association between brain-PAD and clinical measures such as age at onset and disease duration among the MDD and EP patients, controlling for gender.RESULTS
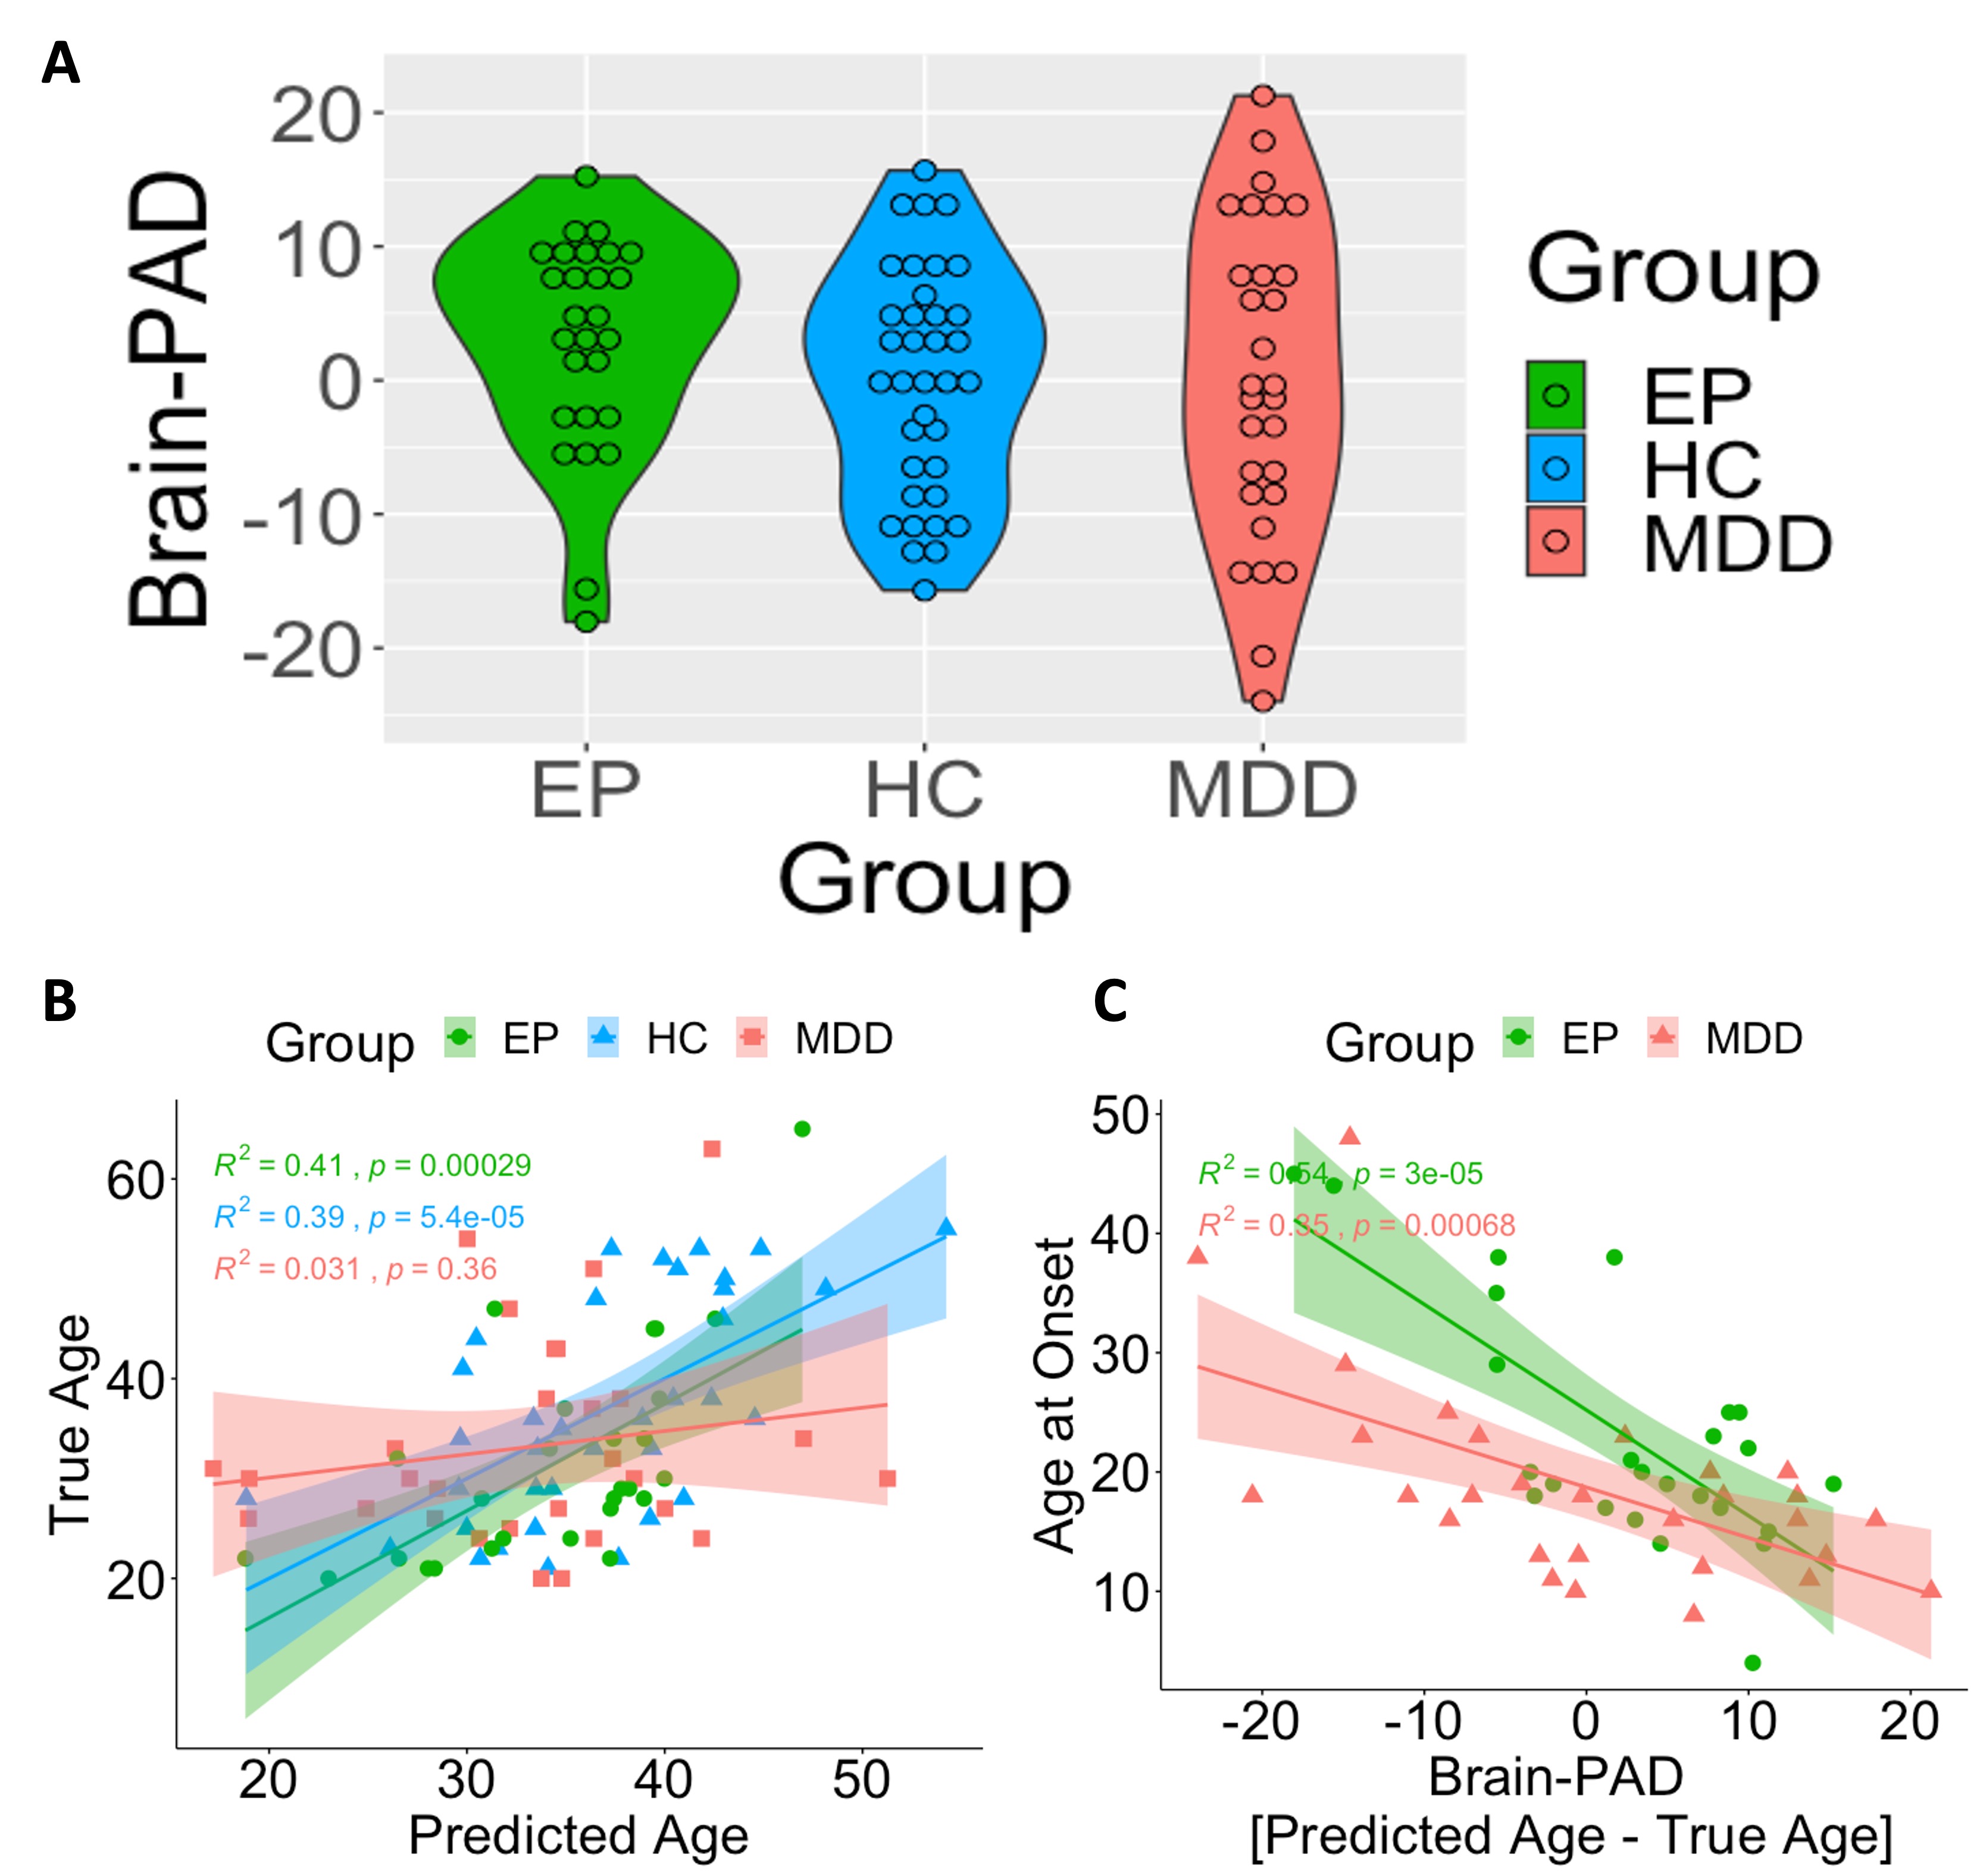
As expected, Eglob significantly predicted chronological age among HC (r=-0.62, p=5.38E-05, Figure 2B). When applying this model to the EP group dataset, the model showed accuracy in age prediction with a significant correlation between predicted and true age (r=-0.64, p=0.00035, Figure 2B). However, when applying the same model to the MDD group dataset, the model showed reduced accuracy in age prediction with no correlation between predicted and true age (r=0.067, n.s., Figure 2B). Brain-PAD measures were not significantly different between the HC and EP and MDD patient groups (t=-0.75, p=n.s and t=-0.62, p=n.s, respectively, Figure 2A). However, the brain-PAD among both EP and MDD patients was significantly associated with the subjects' disorder age at onset (r=-0.75, p=1.5E-05 and r=-0.62, p=0.00026, respectively, Figure 2C), indicating that the prediction of an older age brain is associated with early age disorder onset. No significant associations were found with the disease duration measure among both patient groups.DISCUSSION
Our results demonstrate that lower whole-brain global network efficiency during resting state fMRI was significantly associated with older chronological age. These results replicate previous studies6,7. Decreased global network efficiency indicates decreased within-network connections and overall degradation of proper information flow within the network, which might imply of a maladaptive functional behavior of the network. More importantly, implementing the functional network efficiency as a model to predict age among different patient populations with brain pathologies such as EP and MDD revealed that overall patients with early age onset exhibit reduced brain network efficiency and are thus predicted as older brains. These results suggest that brain functional changes in early-onset patients mimic or exacerbate brain aging.Acknowledgements
Funding was provided by NIH R01 MH109544.References
1. Chen, Z. J., He, Y., Rosa-Neto, P., Gong, G. & Evans, A. C. Age-related alterations in the modular organization of structural cortical network by using cortical thickness from MRI. Neuroimage 56, 235-245 (2011).
2. Lemaitre, H. et al. Normal age-related brain morphometric changes: nonuniformity across cortical thickness, surface area and gray matter volume? Neurobiology of aging 33, 617. e611-617. e619 (2012).
3. Verma, G. et al. Quantification of brain age using high-resolution 7 tesla MR Imaging and implications for epilepsy. Epilepsy & Behavior Reports, 100530 (2022).
4. Han, L. K. et al. Brain aging in major depressive disorder: results from the ENIGMA Major Depressive Disorder working group. Molecular Psychiatry, 1-16 (2020).
5. Bullmore, E. & Sporns, O. The economy of brain network organization. Nature reviews neuroscience 13, 336-349 (2012).
6. Song, J. et al. Age-related reorganizational changes in modularity and functional connectivity of human brain networks. Brain connectivity 4, 662-676, doi:10.1089/brain.2014.0286 (2014).
7. Ajilore, O. et al. Graph Theory Analysis of Cortical-Subcortical Networks in Late-Life Depression. The American Journal of Geriatric Psychiatry 22, 195-206, doi:https://doi.org/10.1016/j.jagp.2013.03.005 (2014).
8. Kundu, P., Inati, S. J., Evans, J. W., Luh, W. M. & Bandettini, P. A. Differentiating BOLD and non-BOLD signals in fMRI time series using multi-echo EPI. Neuroimage 60, 1759-1770, doi:10.1016/j.neuroimage.2011.12.028 (2012).
9. Desikan, R. S. et al. An automated labeling system for subdividing the human cerebral cortex on MRI scans into gyral based regions of interest. Neuroimage 31, 968-980, doi:10.1016/j.neuroimage.2006.01.021 (2006).
10. Jacob, Y. et al. Neural correlates of rumination in major depressive disorder: A brain network analysis. NeuroImage: Clinical 25, 102142, doi:https://doi.org/10.1016/j.nicl.2019.102142 (2020).
11. Korgaonkar, M. S., Fornito, A., Williams, L. M. & Grieve, S. M. Abnormal Structural Networks Characterize Major Depressive Disorder: A Connectome Analysis. Biol Psychiatry 76, 567-574, doi:https://doi.org/10.1016/j.biopsych.2014.02.018 (2014).
Figures