3340
Altered network pattern of cortical microarchitecture in major depressive disorder
Ziyun Xu1, Gangqiang Hou1, Yingli Zhang1, Bo Peng1, Long Qian2, and wentao Lai1
1Shenzhen Kangning Hospital, Shenzhen, China, 2MR Research, GE Healthcare, Beijing, China
1Shenzhen Kangning Hospital, Shenzhen, China, 2MR Research, GE Healthcare, Beijing, China
Synopsis
Keywords: Brain Connectivity, Brain Connectivity
Although major depressive disorder (MDD) has been deeply studied in decades, there are still no reliable biological markers. Here, we combine the T1-wighted, diffusion tensor imaging (DTI) and inhomogeneous magnetization transfer imaging (IhMT) to detect cortical morphometric changes in individuals with MDD. Morphometric similarity network (MSN) was established for each subject. Network properties and rich-club organizations were assessed and analyzed between groups. MDD showed significant alteration in global and nodal properties, as well as reorganization of rich clubs. Consequently, topological structure of the morphometric similarity network is disrupted, which may be a potential biomarker for major depressive disorder.Background or Purpose
Major depressive disorder (MDD) is one of the most prevalent and debilitating psychiatric diseases. Especially, as the resulting effects of the COVID-19 pandemic, prevalent of depressive disorders is increasing continuously1. In order to explore the biological markers, mounts of structural and functional neuroimaging studies have revealed abnormalities of widespread brain regions in MDD2. However, no local brain regions can explain all aspects of MDD. Therefore, the dysconnectivity hypothesis was proposed, which interpret that not only specific local regions but also integrations of the global regions were altered in MDD3,4. Accumulating researches about structural covariance network revealed group-level abnormal structural connectomes in MDD5. Against the challenge that structural covariance network analysis only measures group-level network, a recent morphometric similarity network (MSN) analysis was proposed to analyze interregional correlation network for single individual by capturing the multiple morphometric features from multi-modal image7. Importantly, changes of MSN in MDD may be related to expression of MDD-related genes and abnormalities of astrocytes, microglial, and neuronal cells8. However, there is no findings about the topological properties of MSN in MDD. Considering the high specificity and sensitivity9 of inhomogeneous magnetization transfer imaging (ihMT) in detecting reduced myelin density in MDD10, we will integrate multi-modal features of T1-wighted, diffusion tensor imaging (DTI) and ihMT to identify the alterations of cortical microarchitecture in this study, which may provide further interpretations of the biological mechanism of MDD.Methods
The MR images of 79 MDD and 74 normal controls were obtained in Shenzhen Kangning Hospital. The severity of depressive symptoms was quantified by the 17-item Hamilton Rating Scale for Depression (HAMD). T1-whited images were preprocessed with the frame pipeline VBM8 to calculate gray matter (GM) maps. DTI scans were preprocessed with the FSL software to calculate the FA, AD, RD and MD maps, including eddy current-induced distortions and head motion corrections, cerebral tissue extraction and ellipsoid modelling. ihMT images were preprocessed to obtain qMT, MTR, qihMT and ihMTR maps with a post processing software provided by GE Healthcare according to the following models. All of 9 acquired maps were normalized to T1 space. The nodes of MSN were defined by 90 regions of automated anatomical labeling (AAL) atlas, each node contain 9 features from 9 maps. The edges were defined by Pearson correlation coefficient between every two nodes. Characteristic path length (Lp), Clustering coefficient (Cp), small-worldness, global efficiency (Eg) and local efficiency (Eloc) were used to evaluate the whole network. Nodal efficiency (Ne) and Nodal local efficiency (Eloc) were calculated to measure the nodes. Two sample t test were conducted to detect group differences of the topological properties with age, education and gender as the covariates. The significance was determined with p < 0.05 using the False Discovery Rate (FDR) correction. Correlation analyses were performed between topological properties and clinical measures by calculating the Pearson's correlation coefficient with the significance p < 0.05.Results
Consequently, MSN of both groups are small-world networks. Compared with NC, MDD showed significant increased Lp, Cp and decreased Eg, no difference in the Eloc(Figure 1). For the nodal characters, Ne was found significantly decreased in triangular part of left inferior frontal gyrus, left posterior cingulate gyrus and left lenticular nucleus of pallidum. While significantly decreased Nle in right lenticular nucleus of pallidum, increased Nle was found in left middle occipital gyrus and left fusiform gyrus(Figure 2). Both MDD and NC showed significant rich-club organization(Figure 3). The rich-club and feeder connections were significantly increased and the local connections were significantly decreased(Figure 4). However, no changes showed correlation with HAMD scores.Conclusions
Our findings suggest that topological structure of the morphometric similarity network is altered in patients with major depressive disorder. Such patterns of disruption might indicate the mechanism underling major depressive disorder, which may be a potential biomarker for major depressive disorder.Acknowledgements
this work was supported by the Shenzhen Sanming Project (No. SZSM201512038) and the Shenzhen Fund for Guangdong Provincial High-level Clinical Key Specialties (No. SZGSP013).
References
- "Global prevalence and burden of depressive and anxiety disorders in 204 countries and territories in 2020 due to the COVID-19 pandemic," Lancet (London, England) 398 (10312), 1700-1712 (2021).
- J. Pilmeyer, W. Huijbers, R. Lamerichs, J. F. A. Jansen, M. Breeuwer, and S. Zinger, "Functional MRI in major depressive disorder: A review of findings, limitations, and future prospects," Journal of neuroimaging : official journal of the American Society of Neuroimaging 32 (4), 582-595 (2022).
- T. Chen, Z. Chen, and Q. Gong, "White Matter-Based Structural Brain Network of Major Depression," Advances in experimental medicine and biology 1305, 35-55 (2021).
- Q. Gong and Y. He, "Depression, neuroimaging and connectomics: a selective overview," Biological psychiatry 77 (3), 223-235 (2015).
- C. Chen, Z. Liu, C. Xi, W. Tan, Z. Fan, Y. Cheng, J. Yang, L. Palaniyappan, and J. Yang, "Multimetric structural covariance in first-episode major depressive disorder: a graph theoretical analysis," Journal of psychiatry & neuroscience : JPN 47 (3), E176-e185 (2022).
- J. Seidlitz, F. Váša, M. Shinn, R. Romero-Garcia, K. J. Whitaker, P. E. Vértes, K. Wagstyl, P. Kirkpatrick Reardon, L. Clasen, S. Liu, A. Messinger, D. A. Leopold, P. Fonagy, R. J. Dolan, P. B. Jones, I. M. Goodyer, A. Raznahan, and E. T. Bullmore, "Morphometric Similarity Networks Detect Microscale Cortical Organization and Predict Inter-Individual Cognitive Variation," Neuron 97 (1), 231-247.e237 (2018).
- J. Li, J. Seidlitz, J. Suckling, F. Fan, G. J. Ji, Y. Meng, S. Yang, K. Wang, J. Qiu, H. Chen, and W. Liao, "Cortical structural differences in major depressive disorder correlate with cell type-specific transcriptional signatures," Nature communications 12 (1), 1647 (2021).
- F. Munsch, G. Varma, M. Taso, O. Girard, A. Guidon, G. Duhamel, and D. C. Alsop, "Characterization of the cortical myeloarchitecture with inhomogeneous magnetization transfer imaging (ihMT)," NeuroImage 225, 117442 (2021).
- G. Chen, S. Fu, P. Chen, S. Zhong, F. Chen, L. Qian, Z. Luo, Y. Pan, G. Tang, Y. Jia, L. Huang, and Y. Wang, "Reduced myelin density in unmedicated major depressive disorder: An inhomogeneous magnetization transfer MRI study," Journal of affective disorders 300, 114-120 (2022).
Figures
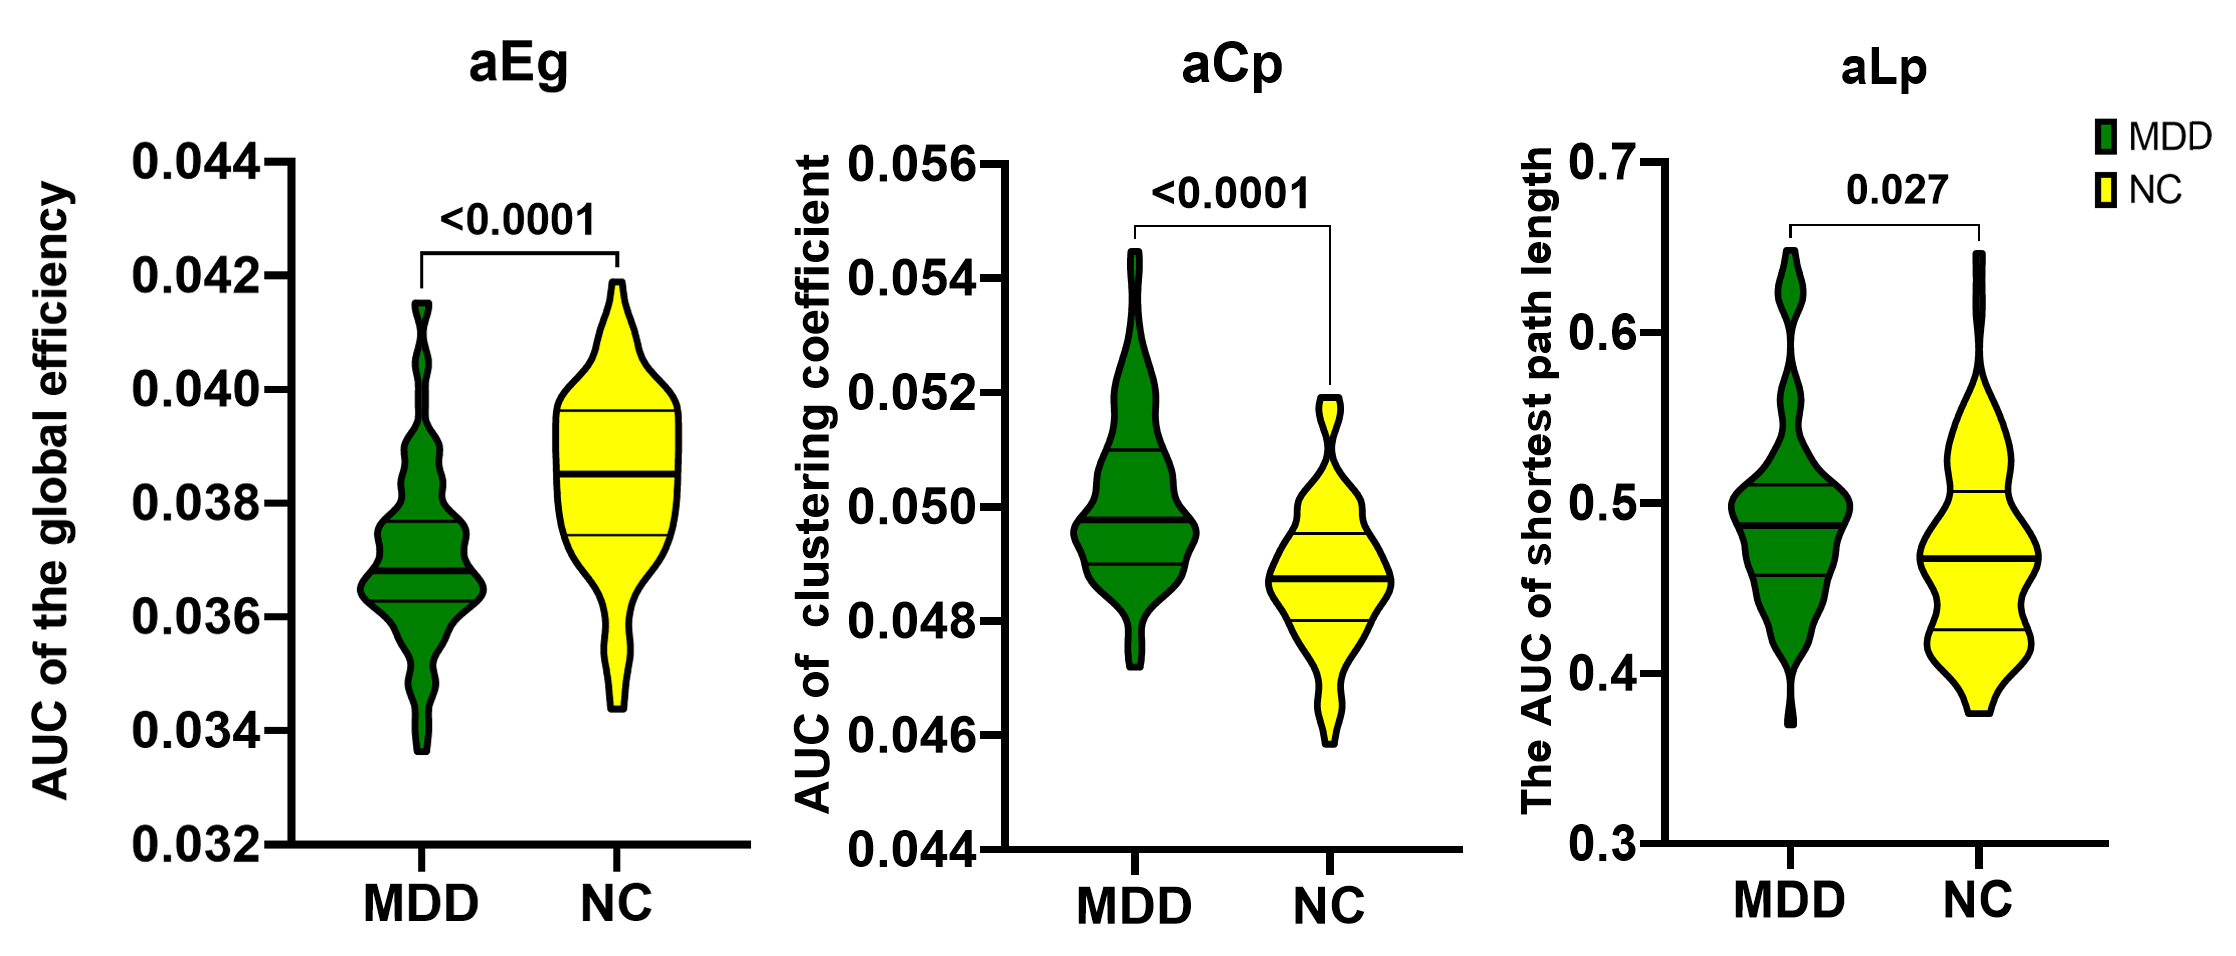
Figure 1. Significant differences of global topological properties between groups. AUC means area under curve; <0.0001 means p < 0.0001.
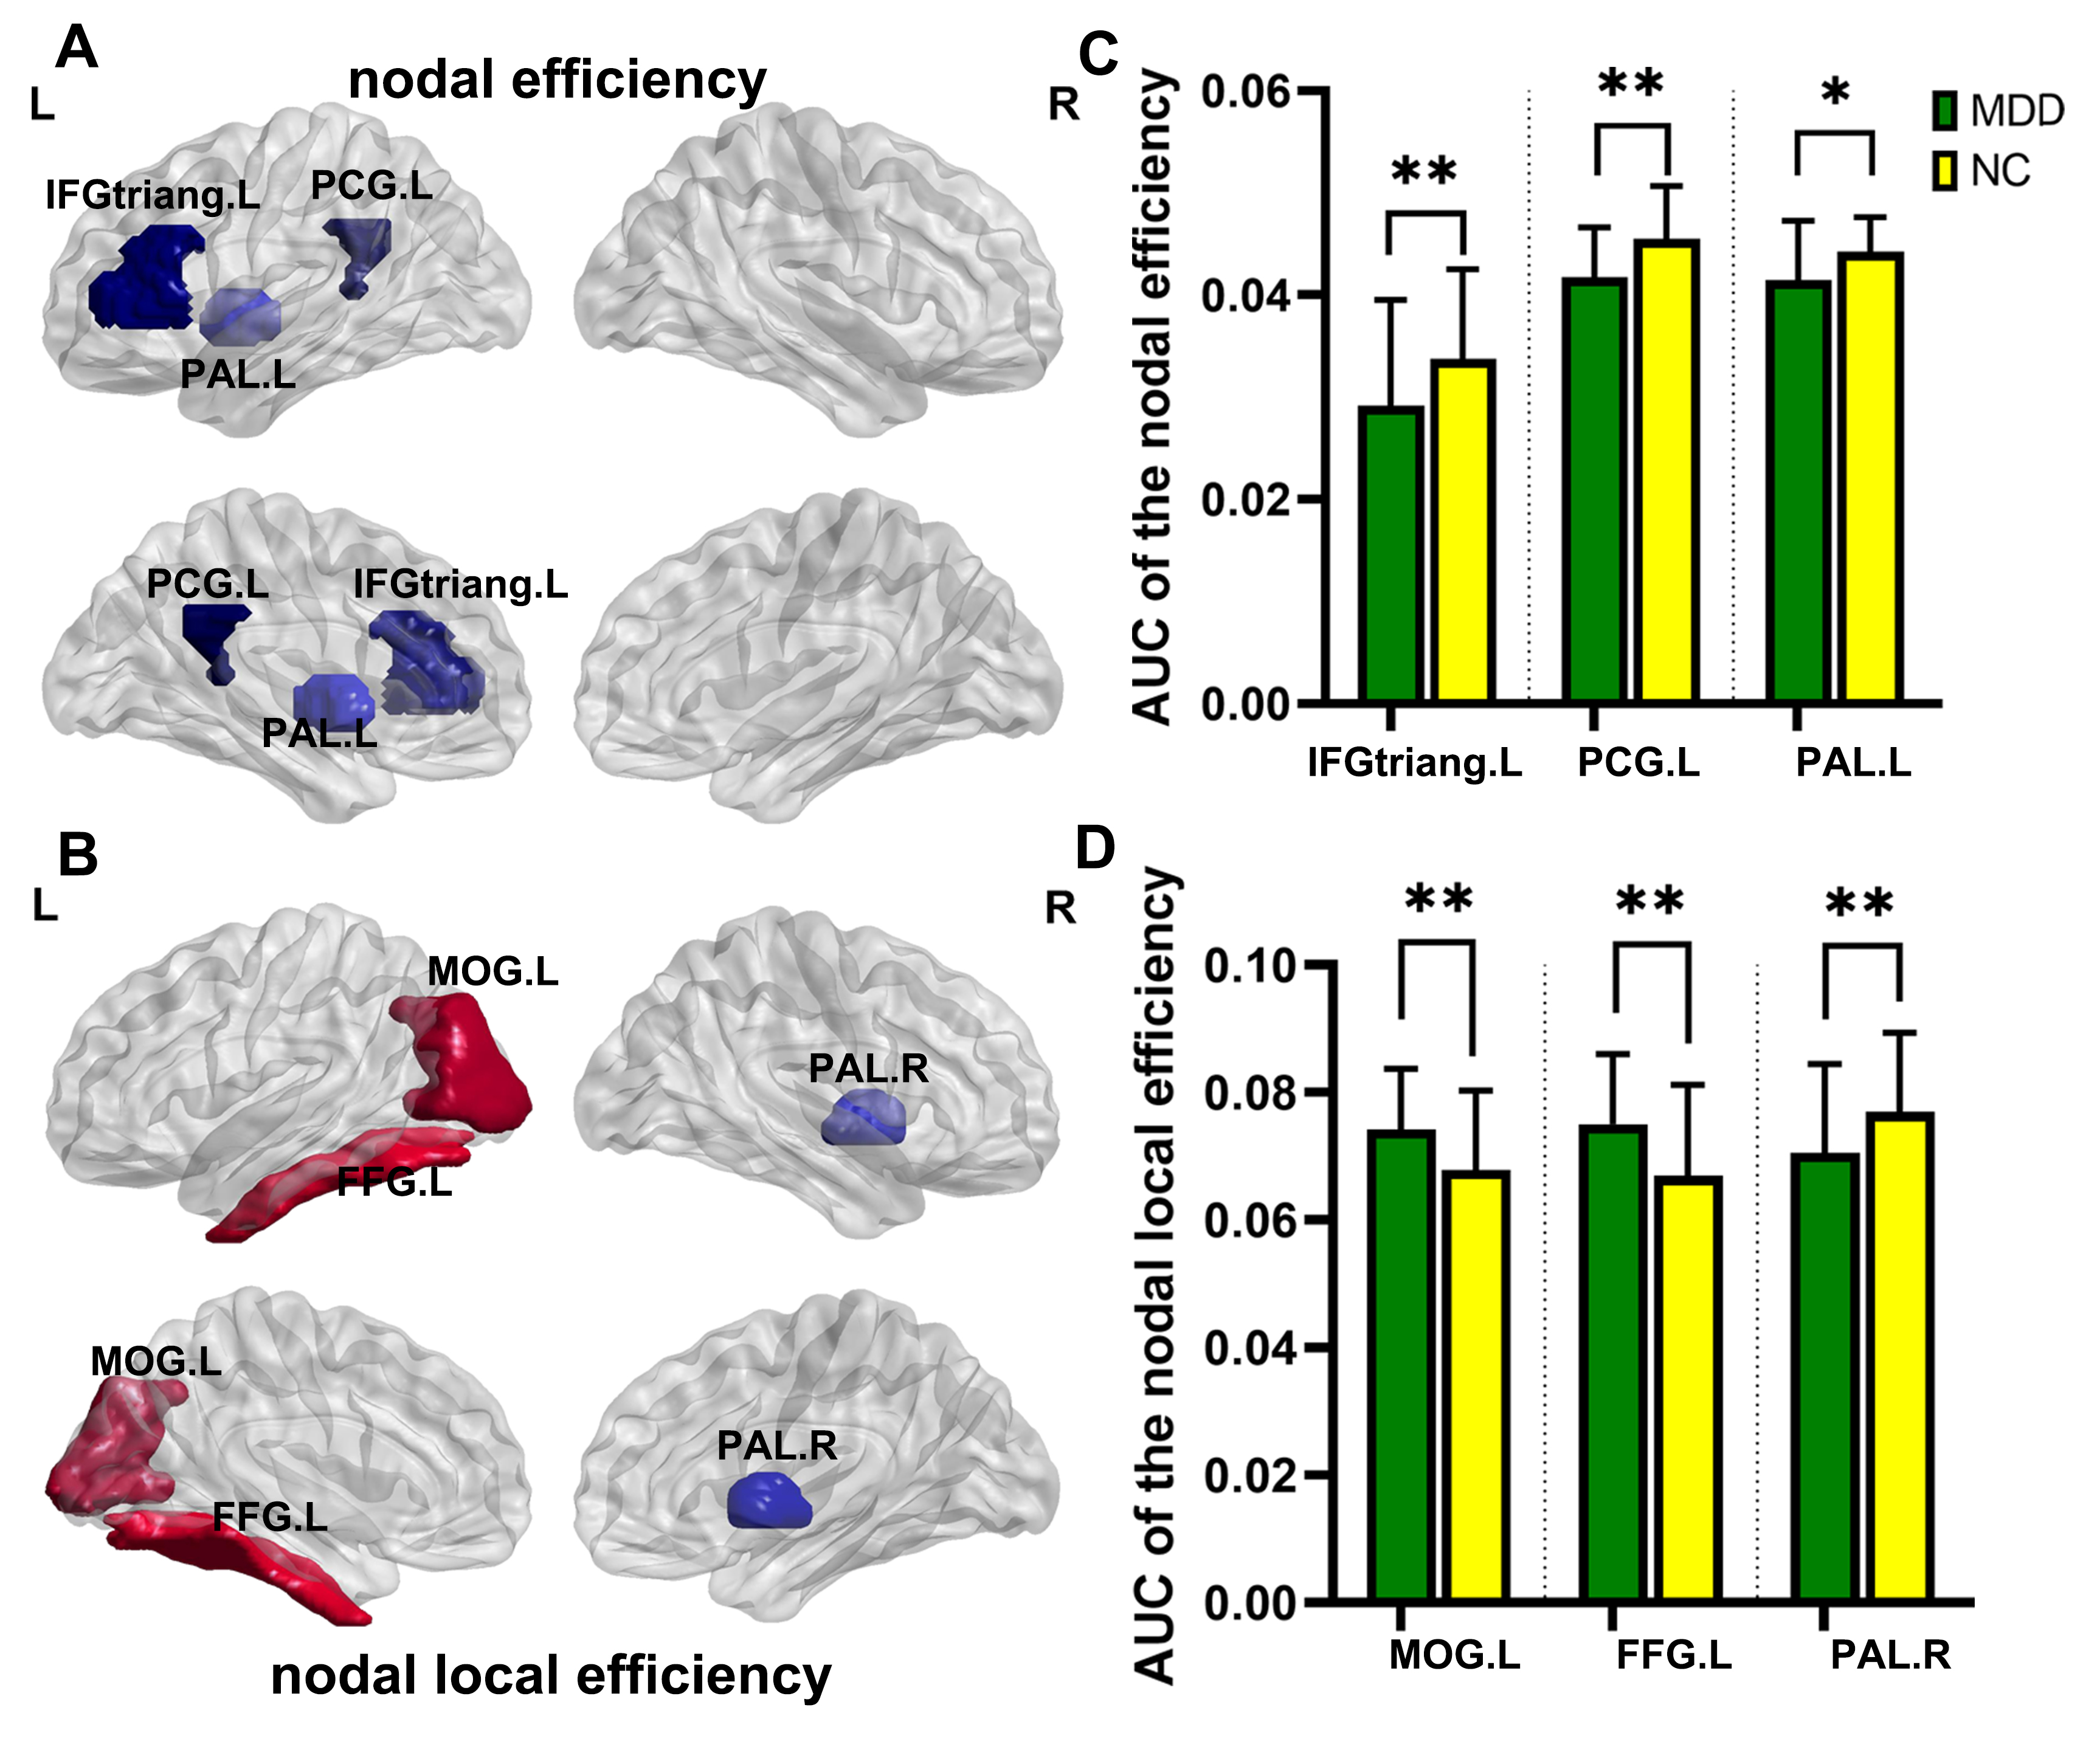
Figure 2. Group-level
comparison and mean values of nodal topological properties. A shows regions which shows significant differences of nodal effiecience between MDD and NC, and C shows their mean values. B shows regions which shows significant differences of nodal local effieciencebetween two groups, and D shows their mean values.** means p < 0.01, * means p < 0.05, FDR corrected.
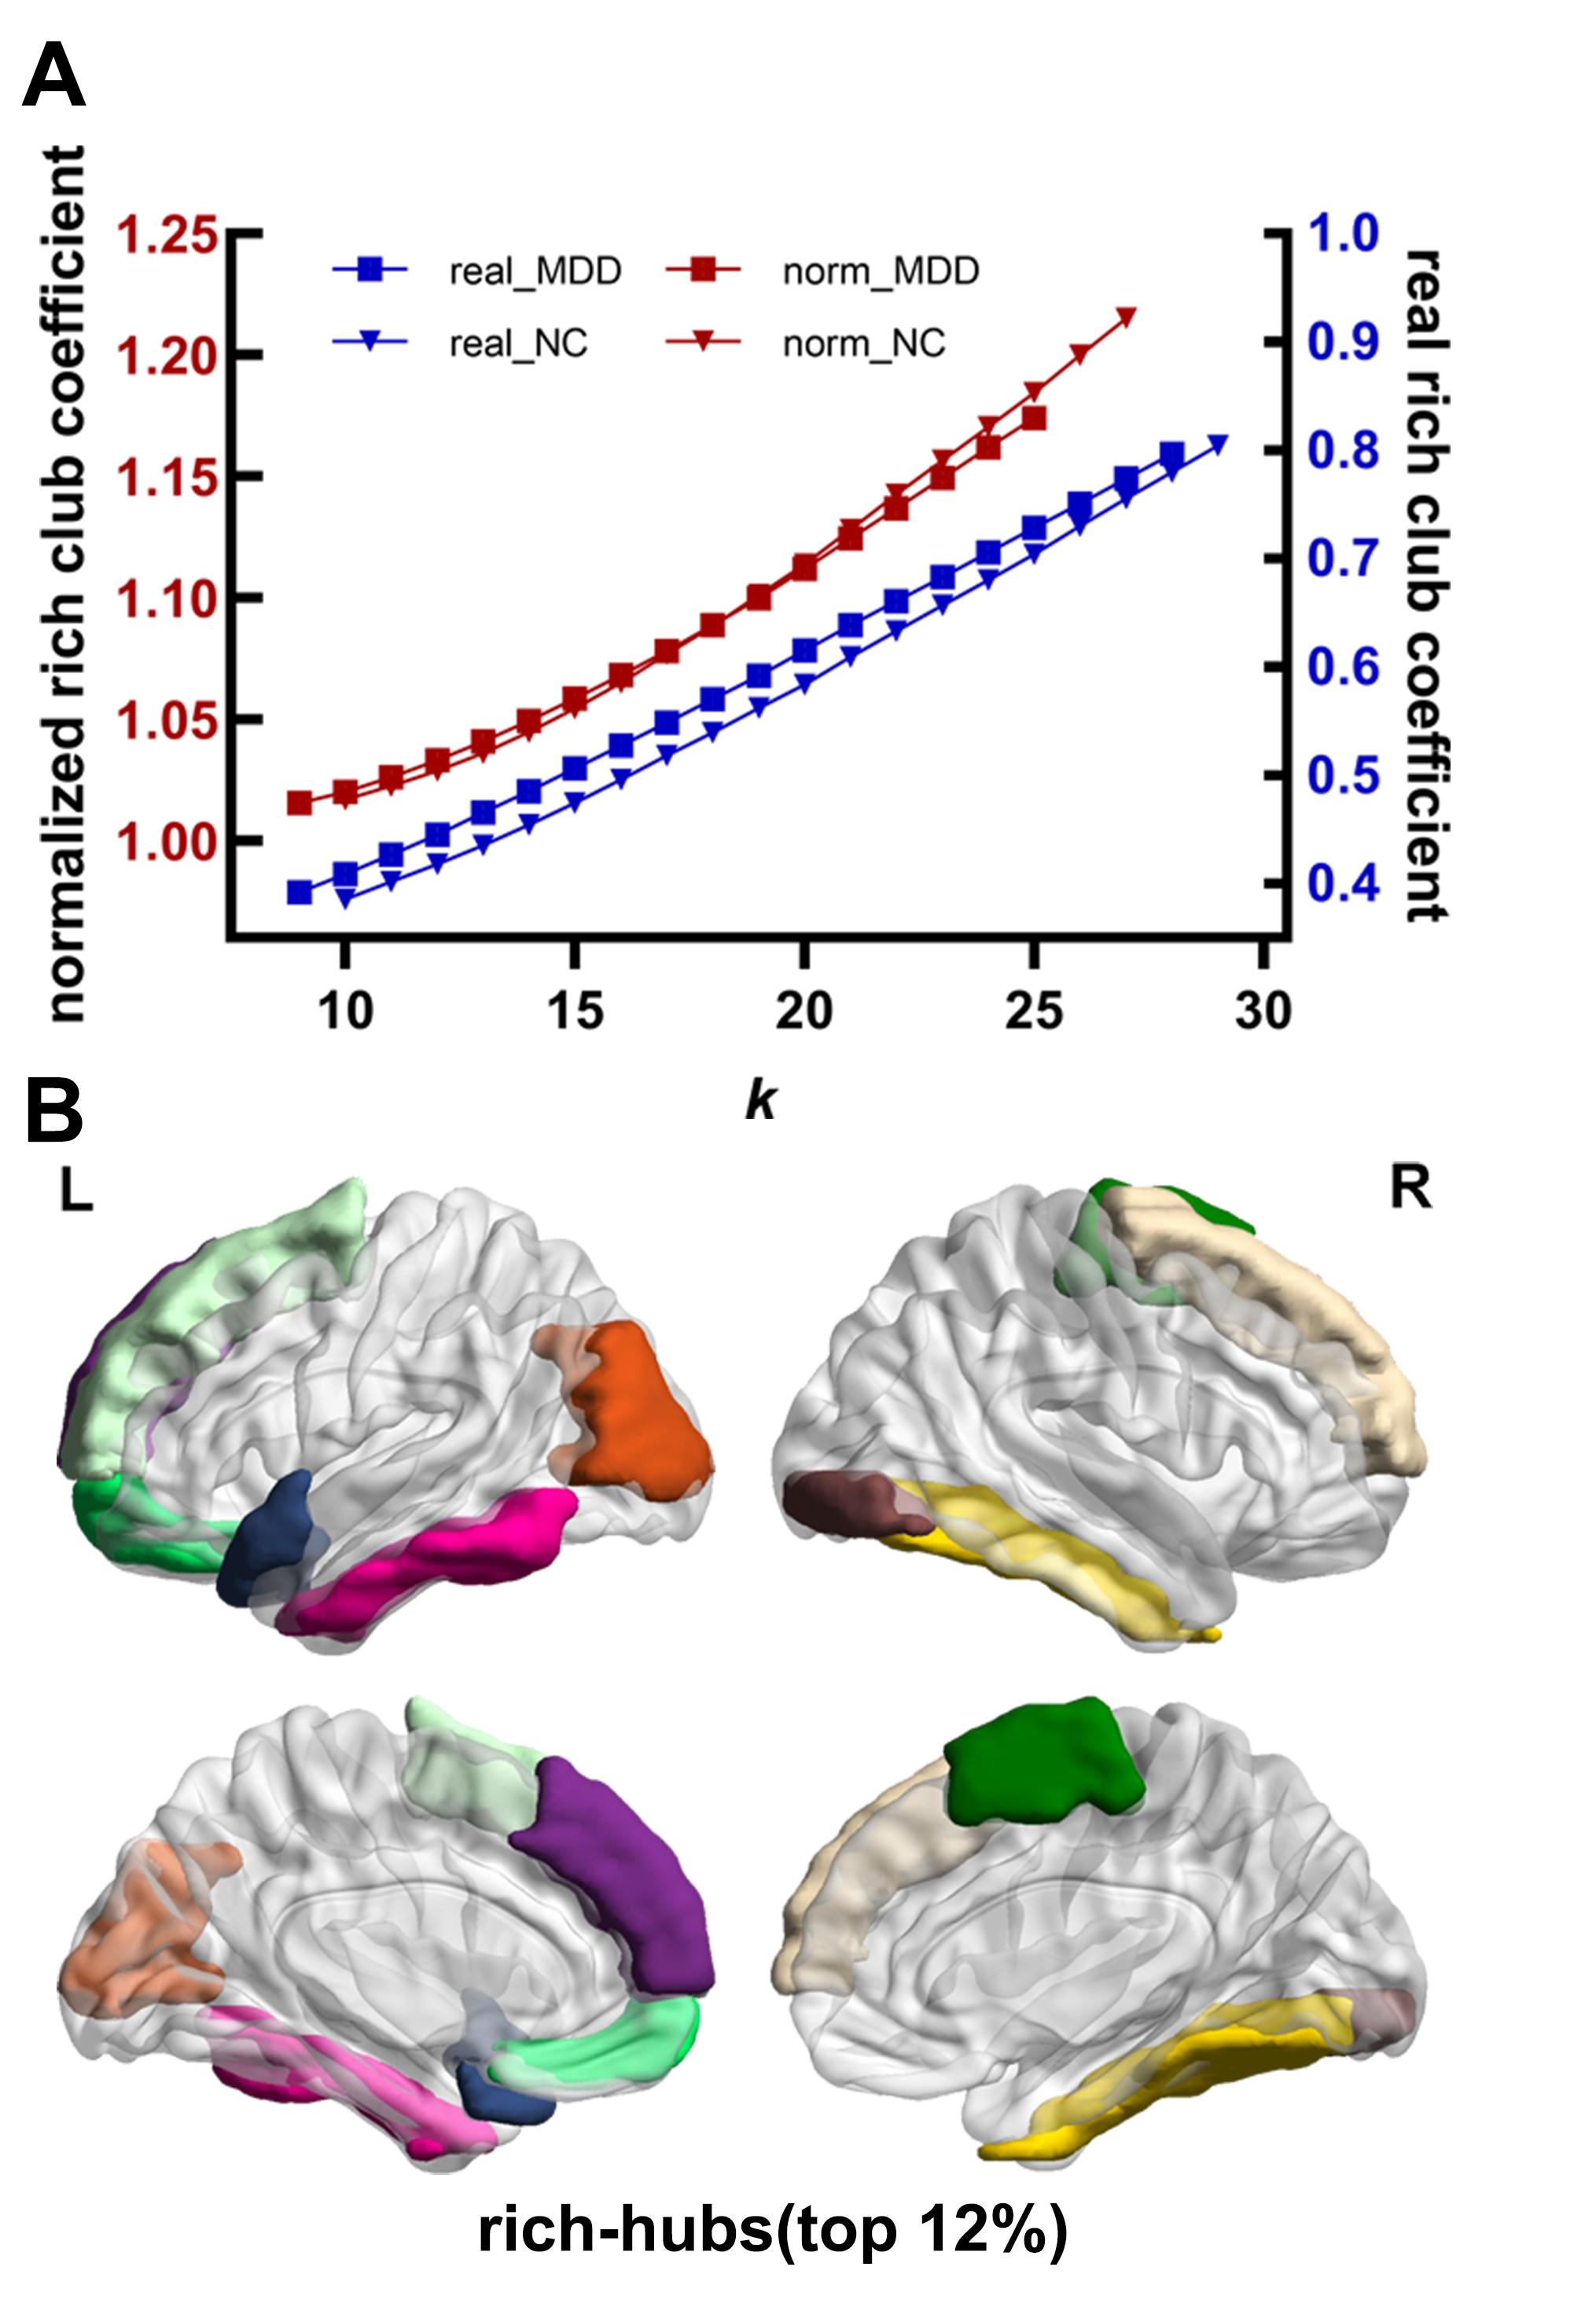
Figure 3. Rich-club organizations and rich-hubs. A shows that both MDD and NC have rich-club organization. B shows the regions of rich-club.
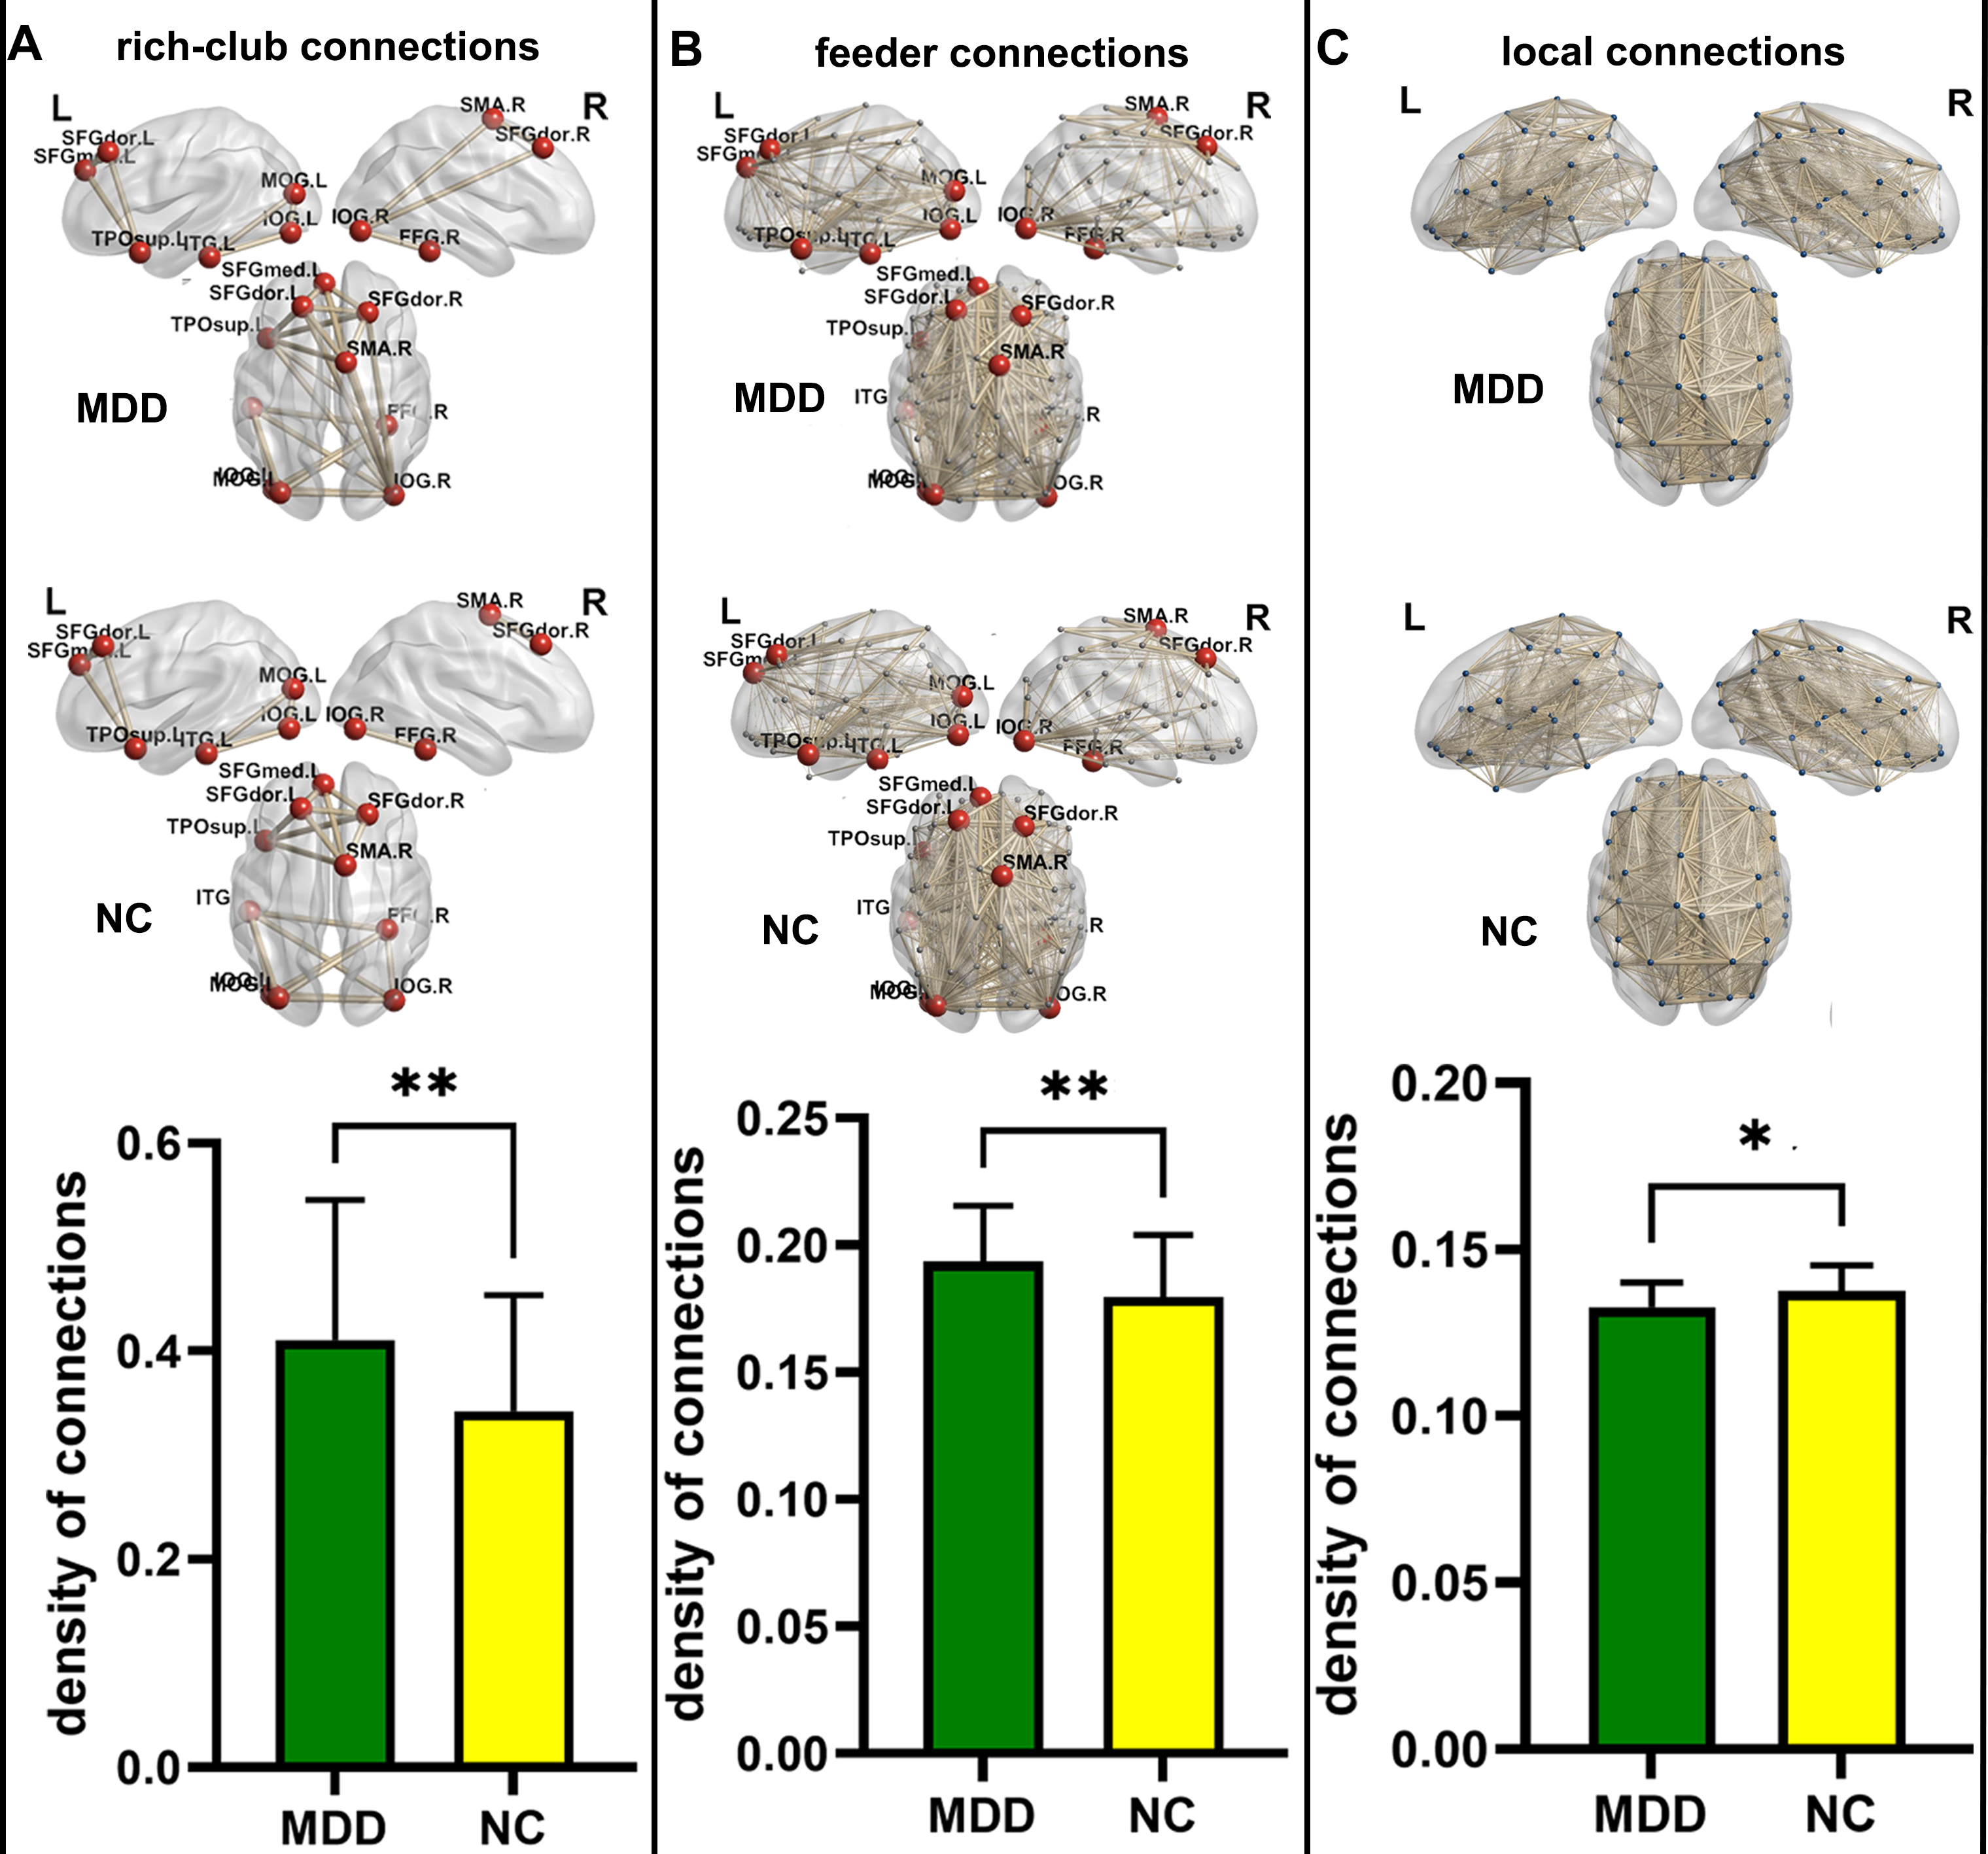
Figure 4. Group-level comparisons of rich club organizations. A shows the connections between rich hubs. B shows the connections between rich hubs and non-rich hubs. C shows the connections between non-rich hubs.** means p < 0.01, * means p < 0.05, FDR corrected.
DOI: https://doi.org/10.58530/2023/3340